| Param | Original file | Final file |
|---|---|---|
| Filename | modeM0/AS1A07_138T09_9000003458_23394cztM0_level2.evt | modeM0/AS1A07_138T09_9000003458_23394cztM0_level2_quad_clean.evt |
| Size (bytes) | 259,329,600 | 32,976,000 |
| Size | 247.3 MB | 31.4 MB |
| Events in quadrant A | 1,594,653 | 195,019 |
| Events in quadrant B | 1,757,646 | 196,852 |
| Events in quadrant C | 1,645,395 | 189,208 |
| Events in quadrant D | 2,624,664 | 176,903 |
| Mode SS | |||
|---|---|---|---|
| Quadrant | BADHDUFLAG | Total packets | Discarded packets |
| A | 0 | 68 | 0 |
| B | 0 | 68 | 0 |
| C | 0 | 68 | 0 |
| D | 0 | 68 | 0 |
| Mode M0 | |||
|---|---|---|---|
| Quadrant | BADHDUFLAG | Total packets | Discarded packets |
| A | 0 | 6859 | 1 |
| B | 0 | 7357 | 1 |
| C | 0 | 6891 | 1 |
| D | 0 | 9955 | 1 |
| Quadrant | Total seconds | Saturated seconds | Saturation percentage |
|---|---|---|---|
| A | 3379 | 10 | 0.295946% |
| B | 3380 | 19 | 0.562130% |
| C | 3380 | 22 | 0.650888% |
| D | 3380 | 323 | 9.556213% |
Noise dominated data is calculated using 1-second bins in cleaned event files. If a bin has >2000 counts, and if more than 50% of those come from <1% of pixels, then it is considered to be noise-dominated and hence unusable.
| Quadrant | # 1 sec bins | Bins with >0 counts | Bins with >2000 counts | High rate bins dominated by noise | Noise dominated (total time) | Noise dominated (detector-on time) | Marked lightcurve |
|---|---|---|---|---|---|---|---|
| A | 3379 | 3379 | 0 | 0 | 0.00% | 0.00% | 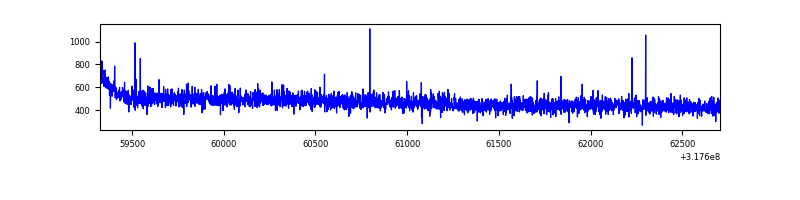 |
| B | 3380 | 3380 | 13 | 13 | 0.38% | 0.38% | 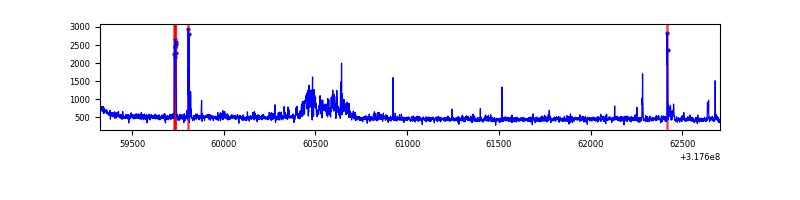 |
| C | 3380 | 3380 | 0 | 0 | 0.00% | 0.00% | 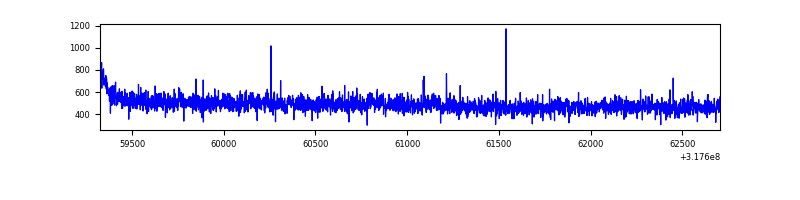 |
| D | 3380 | 3380 | 281 | 281 | 8.31% | 8.31% | 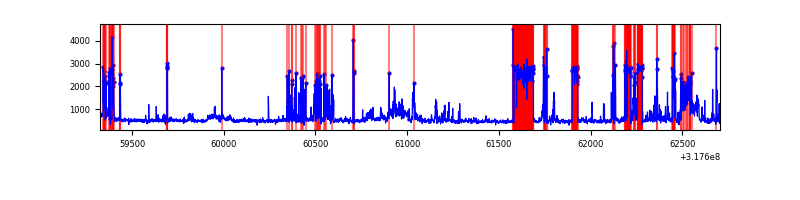 |
Top three noisy pixels from each quadrant. If the there are fewer than three noisy pixels in the level2.evt file, extra rows are filled as -1
| Pixel properties | Quadrant properties | ||||||
|---|---|---|---|---|---|---|---|
| Quadrant | DetID | PixID | Counts | Sigma | Mean | Median | Sigma |
| A | 13 | 254 | 4755 | 51.85 | 412 | 403 | 83.9 |
| A | 6 | 16 | 4005 | 42.91 | 412 | 403 | 83.9 |
| A | 0 | 226 | 3528 | 37.23 | 412 | 403 | 83.9 |
| B | 0 | 190 | 84328 | 1081.4 | 406 | 396 | 77.6 |
| B | 5 | 172 | 33928 | 432.03 | 406 | 396 | 77.6 |
| B | 0 | 189 | 24099 | 305.39 | 406 | 396 | 77.6 |
| C | 14 | 238 | 64836 | 685.29 | 398 | 401 | 94.0 |
| C | 10 | 9 | 18432 | 191.77 | 398 | 401 | 94.0 |
| C | 3 | 233 | 3259 | 30.4 | 398 | 401 | 94.0 |
| D | 1 | 52 | 1013991 | 10697.65 | 385 | 374 | 94.8 |
| D | 7 | 238 | 134618 | 1416.8 | 385 | 374 | 94.8 |
| D | 2 | 234 | 14390 | 147.92 | 385 | 374 | 94.8 |
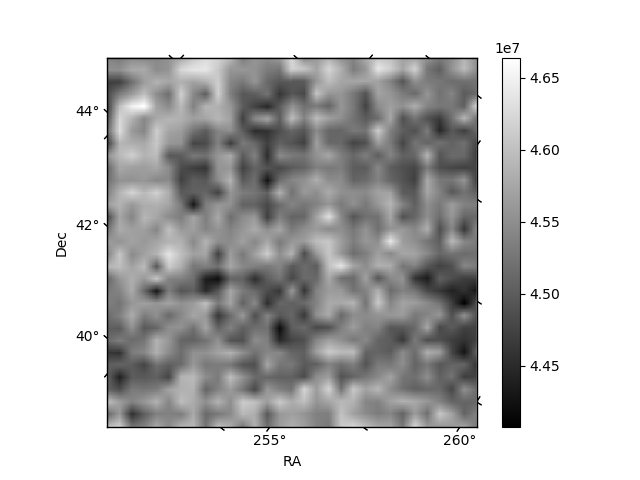
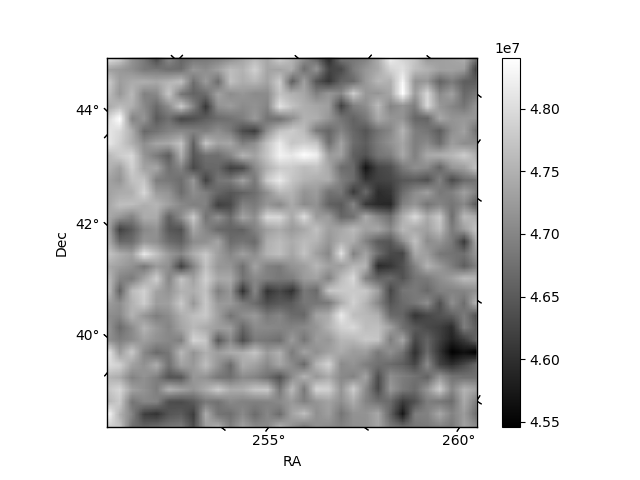
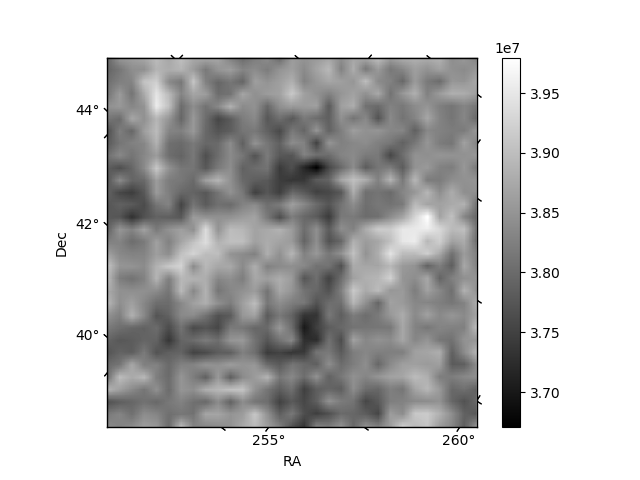
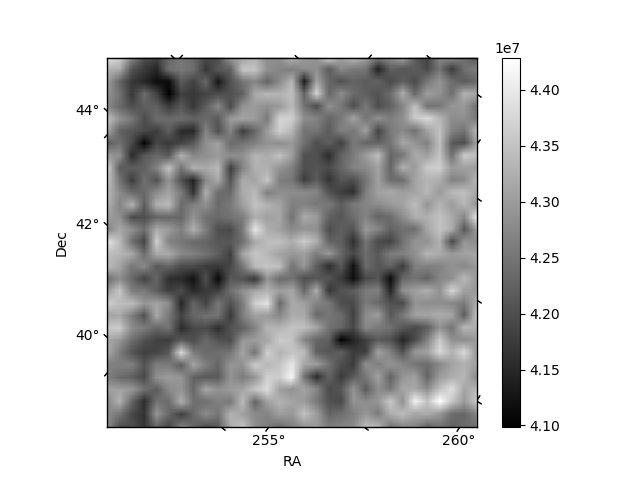
Histogram calculated using DETX and DETY for each event in the final _common_clean file
| Quadrant A | 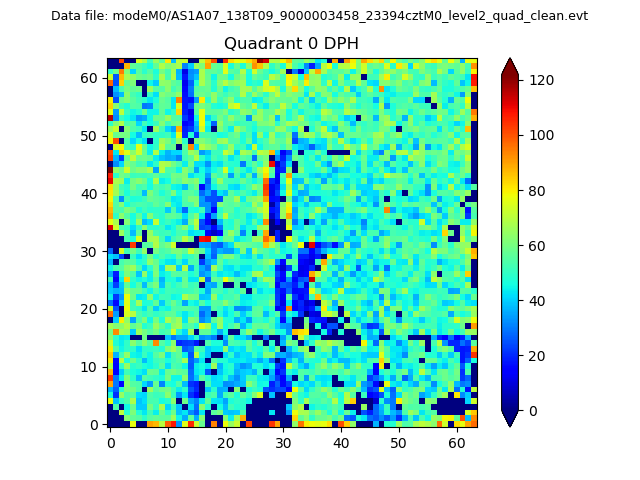 |
 |
Quadrant B |
|---|---|---|---|
| Quadrant D | 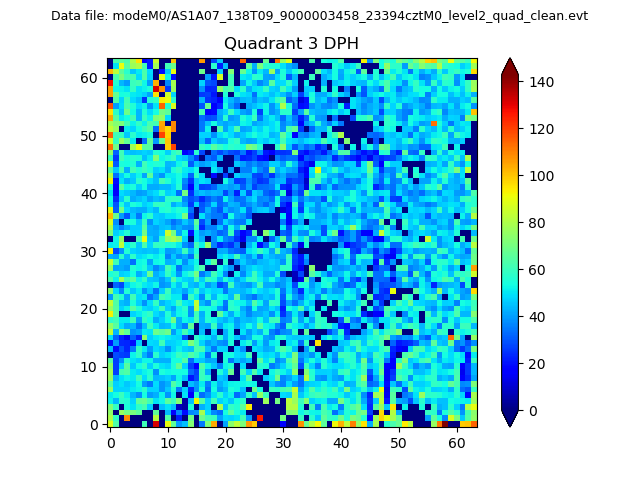 |
 |
Quadrant C |
| Plot type | Count rate plots | Images |
|---|---|---|
| Comparison with Poisson distribution Blue bars denote a histogram of data divided into 1 sec bins. Red curve is a Poisson curve with rate = median count rate of data. |
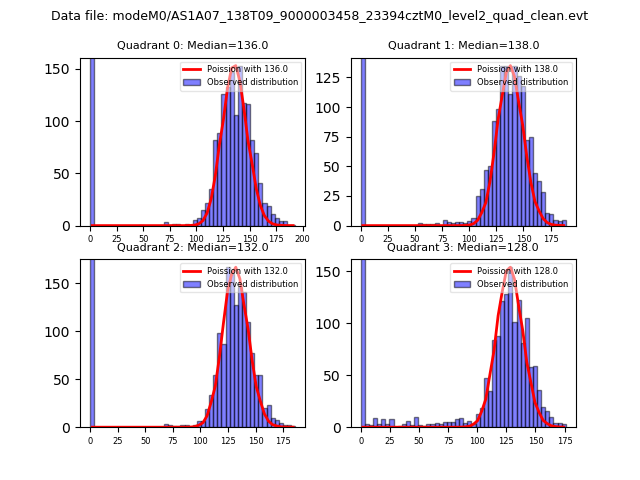 |
 |
| Quadrant-wise count rates Data is divided into 100 sec bins |
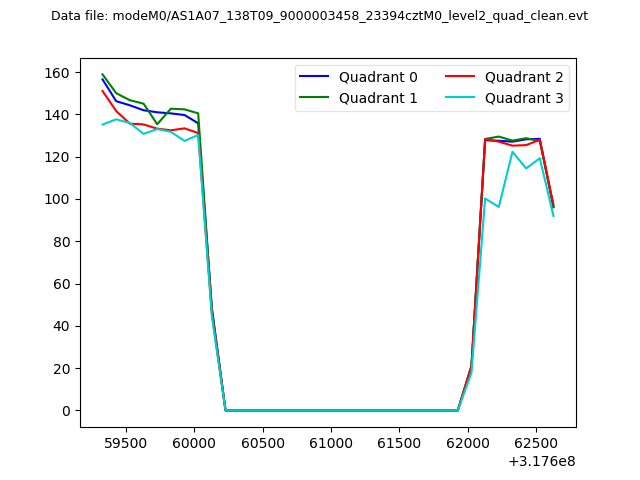 |
|
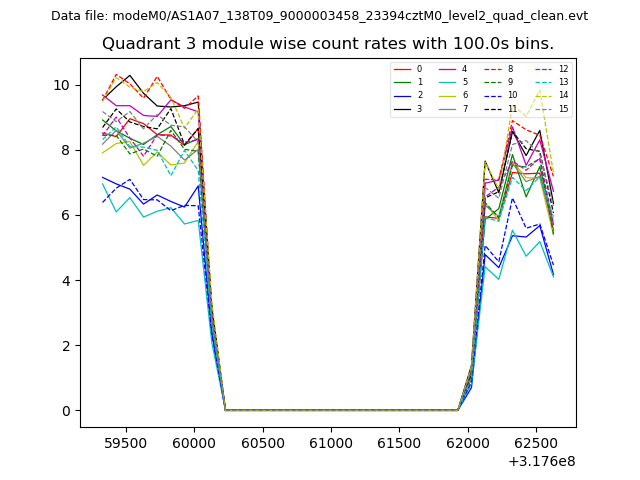
| Module-wise count rates for Quadrant A Data is divided into 100 sec bins |
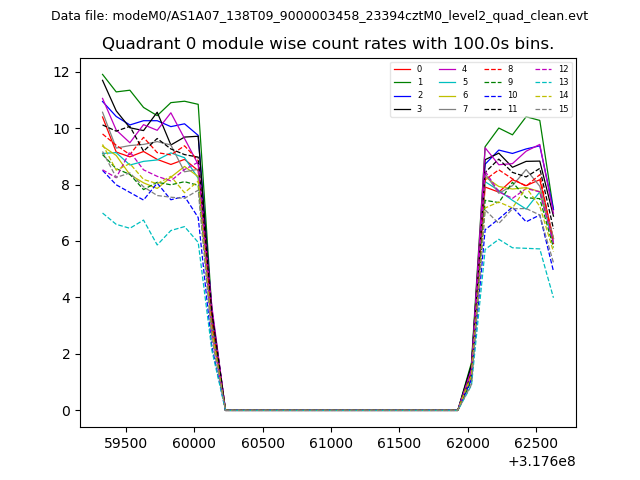 |
 |
| Module-wise count rates for Quadrant B Data is divided into 100 sec bins |
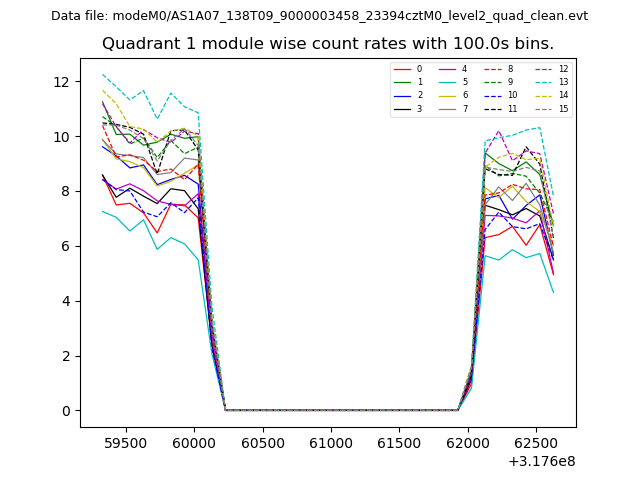 |
 |
| Module-wise count rates for Quadrant C Data is divided into 100 sec bins |
 |
 |
| Module-wise count rates for Quadrant D Data is divided into 100 sec bins |
 |
 |
| Parameter | Plot |
|---|---|
| CZT HV Monitor |  |
| D_VDD | 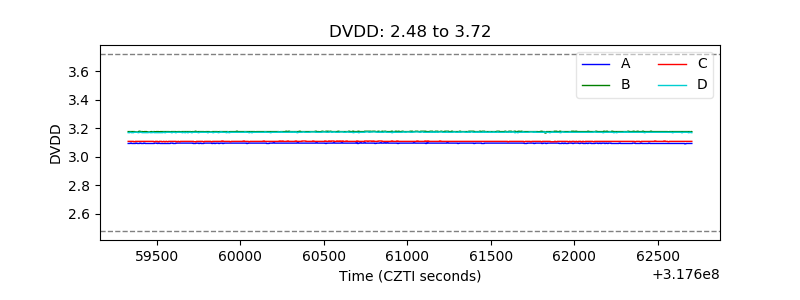 |
| Temperature 1 | 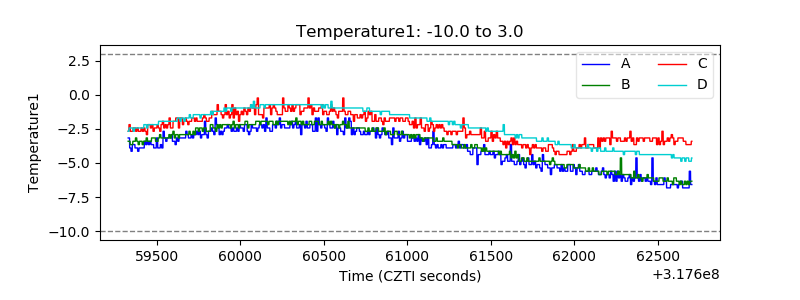 |
| Veto HV Monitor | 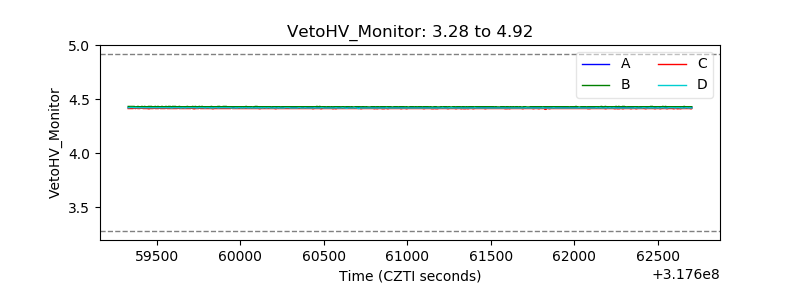 |
| Veto LLD | 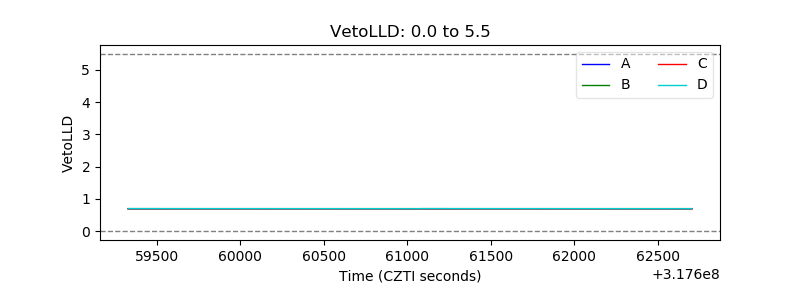 |
| Alpha Counter | 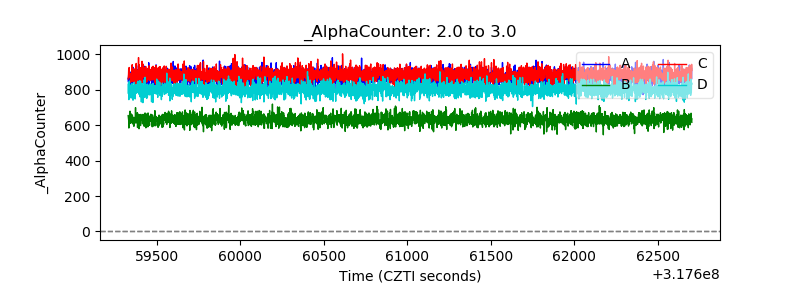 |
| _CPM_Rate | 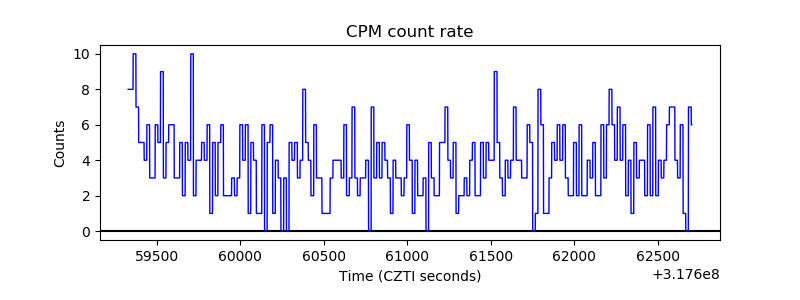 |
| CZT Counter | 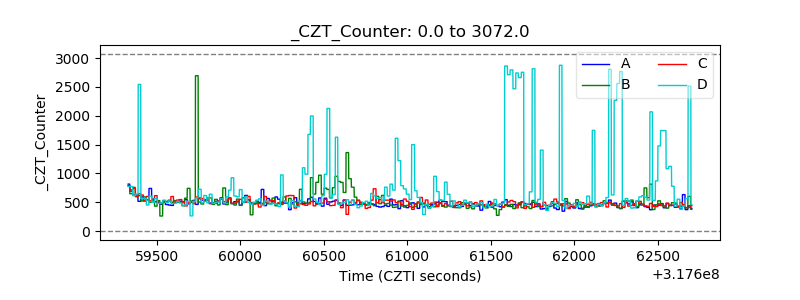 |
| +2.5 Volts monitor |  |
| +5 Volts monitor | 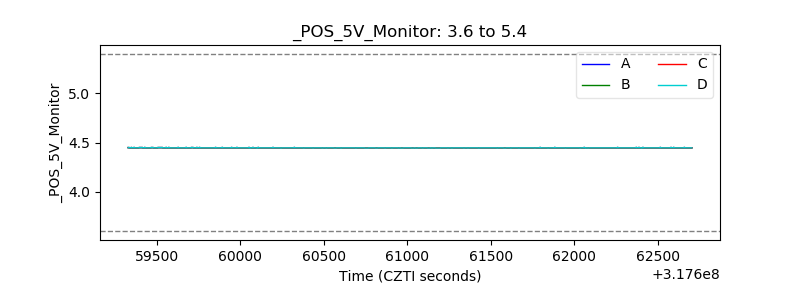 |
| _ROLL_ROT | 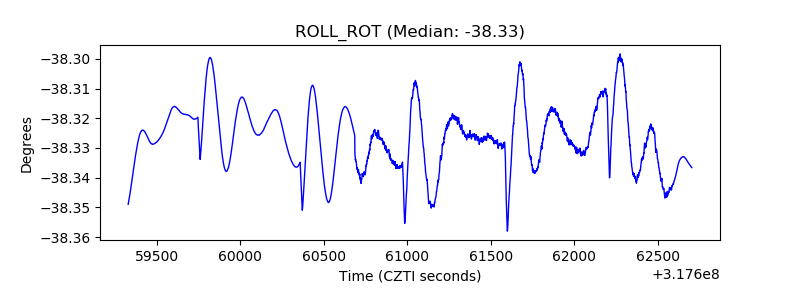 |
| _Roll_DEC | 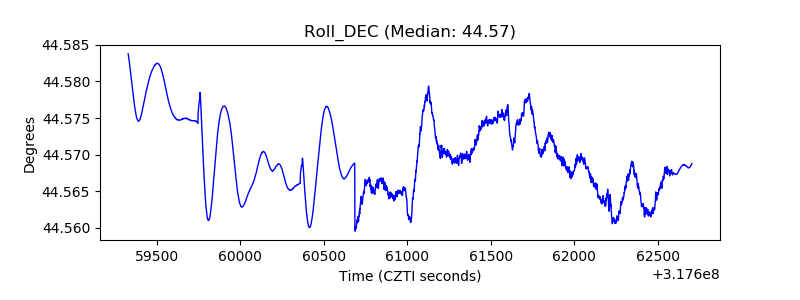 |
| _Roll_RA | 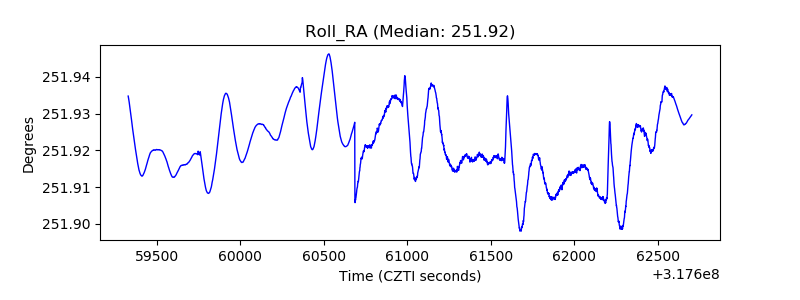 |
| Veto Counter | 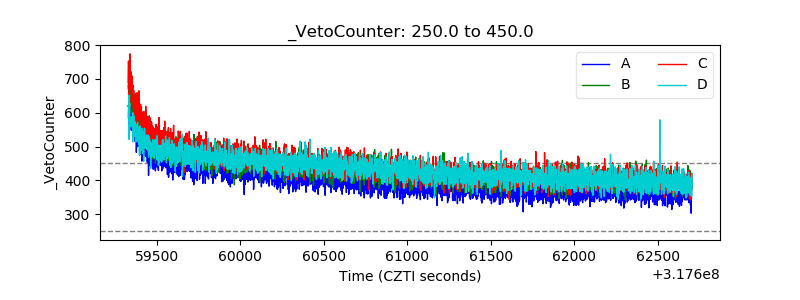 |