| Param | Original file | Final file |
|---|---|---|
| Filename | modeM0/AS1A07_138T09_9000003458_23552cztM0_level2.evt | modeM0/AS1A07_138T09_9000003458_23552cztM0_level2_quad_clean.evt |
| Size (bytes) | 175,305,600 | 35,271,360 |
| Size | 167.2 MB | 33.6 MB |
| Events in quadrant A | 1,212,876 | 226,658 |
| Events in quadrant B | 1,343,653 | 228,894 |
| Events in quadrant C | 1,278,087 | 220,716 |
| Events in quadrant D | 1,308,326 | 217,851 |
| Mode SS | |||
|---|---|---|---|
| Quadrant | BADHDUFLAG | Total packets | Discarded packets |
| A | 0 | 54 | 6 |
| B | 0 | 54 | 4 |
| C | 0 | 54 | 6 |
| D | 0 | 54 | 4 |
| Mode M9 | |||
|---|---|---|---|
| Quadrant | BADHDUFLAG | Total packets | Discarded packets |
| A | 0 | 12 | 0 |
| B | 0 | 12 | 0 |
| C | 0 | 12 | 0 |
| D | 0 | 12 | 0 |
| Mode M0 | |||
|---|---|---|---|
| Quadrant | BADHDUFLAG | Total packets | Discarded packets |
| A | 0 | 5400 | 341 |
| B | 0 | 5818 | 339 |
| C | 0 | 5582 | 325 |
| D | 0 | 5774 | 355 |
| Quadrant | Total seconds | Saturated seconds | Saturation percentage |
|---|---|---|---|
| A | 2408 | 57 | 2.367110% |
| B | 2413 | 58 | 2.403647% |
| C | 2422 | 55 | 2.270851% |
| D | 2419 | 28 | 1.157503% |
Noise dominated data is calculated using 1-second bins in cleaned event files. If a bin has >2000 counts, and if more than 50% of those come from <1% of pixels, then it is considered to be noise-dominated and hence unusable.
| Quadrant | # 1 sec bins | Bins with >0 counts | Bins with >2000 counts | High rate bins dominated by noise | Noise dominated (total time) | Noise dominated (detector-on time) | Marked lightcurve |
|---|---|---|---|---|---|---|---|
| A | 3749 | 2457 | 0 | 0 | 0.00% | 0.00% | 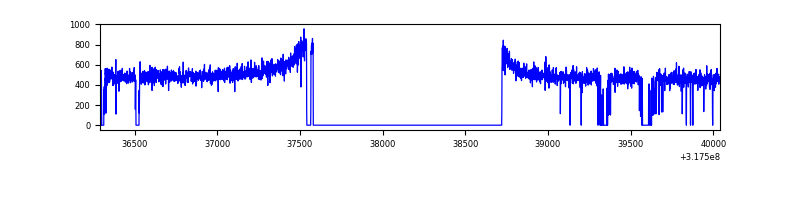 |
| B | 3749 | 2454 | 0 | 0 | 0.00% | 0.00% | 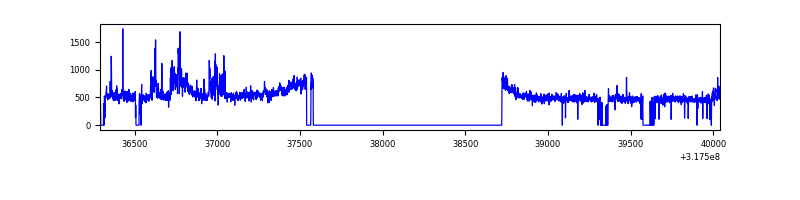 |
| C | 3748 | 2464 | 0 | 0 | 0.00% | 0.00% | 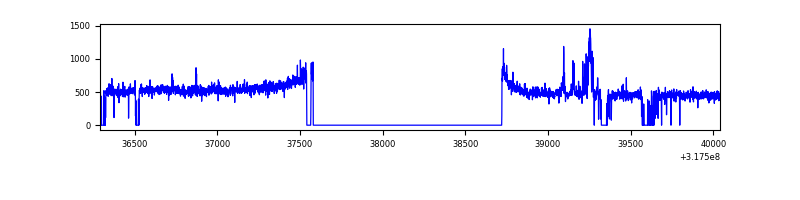 |
| D | 3749 | 2467 | 3 | 3 | 0.08% | 0.12% | 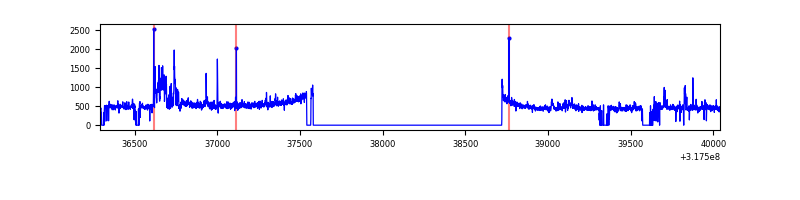 |
Top three noisy pixels from each quadrant. If the there are fewer than three noisy pixels in the level2.evt file, extra rows are filled as -1
| Pixel properties | Quadrant properties | ||||||
|---|---|---|---|---|---|---|---|
| Quadrant | DetID | PixID | Counts | Sigma | Mean | Median | Sigma |
| A | 13 | 254 | 4157 | 59.42 | 314 | 307 | 64.8 |
| A | 3 | 137 | 2793 | 38.37 | 314 | 307 | 64.8 |
| A | 0 | 226 | 2705 | 37.01 | 314 | 307 | 64.8 |
| B | 3 | 64 | 94842 | 1543.54 | 313 | 304 | 61.2 |
| B | 0 | 189 | 13404 | 213.89 | 313 | 304 | 61.2 |
| B | 12 | 111 | 7288 | 114.03 | 313 | 304 | 61.2 |
| C | 14 | 238 | 47548 | 669.17 | 300 | 301 | 70.6 |
| C | 7 | 247 | 33275 | 467.02 | 300 | 301 | 70.6 |
| C | 10 | 91 | 20511 | 286.24 | 300 | 301 | 70.6 |
| D | 9 | 85 | 71111 | 949.42 | 305 | 295 | 74.6 |
| D | 1 | 52 | 68738 | 917.61 | 305 | 295 | 74.6 |
| D | 2 | 234 | 9996 | 130.06 | 305 | 295 | 74.6 |
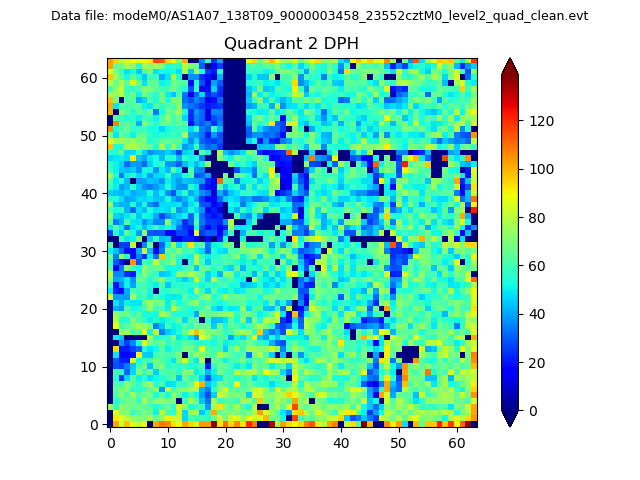
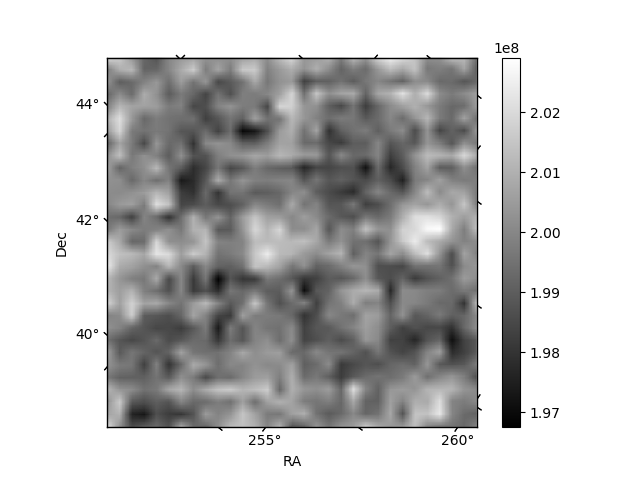
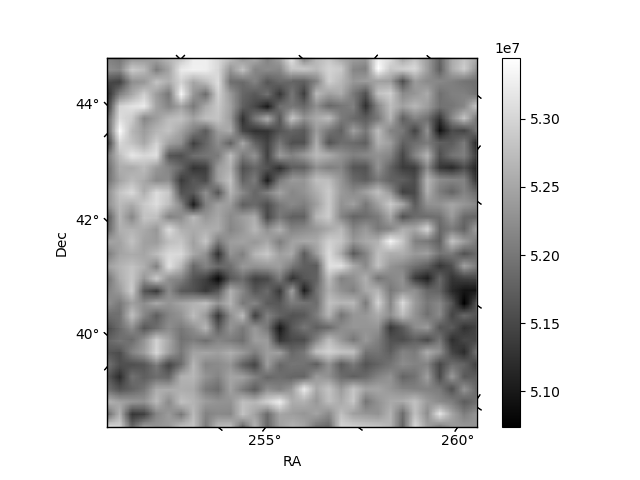
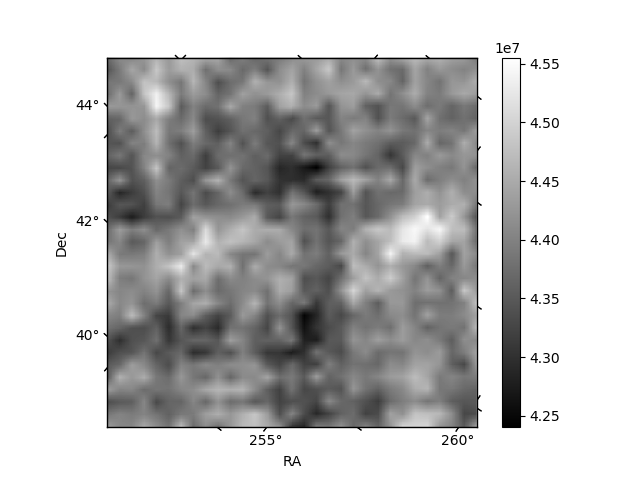
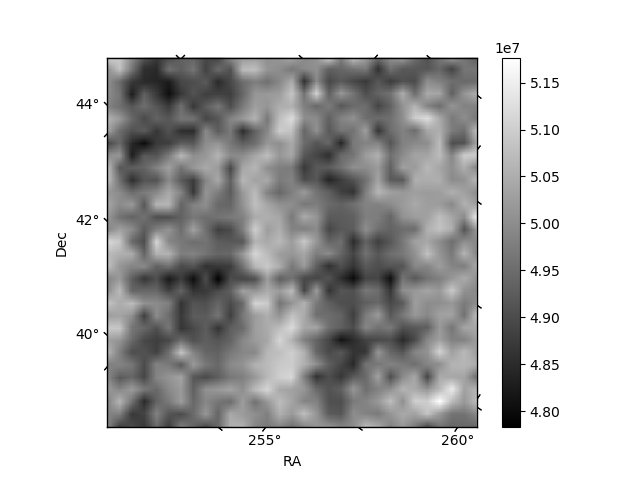
Histogram calculated using DETX and DETY for each event in the final _common_clean file
| Quadrant A | 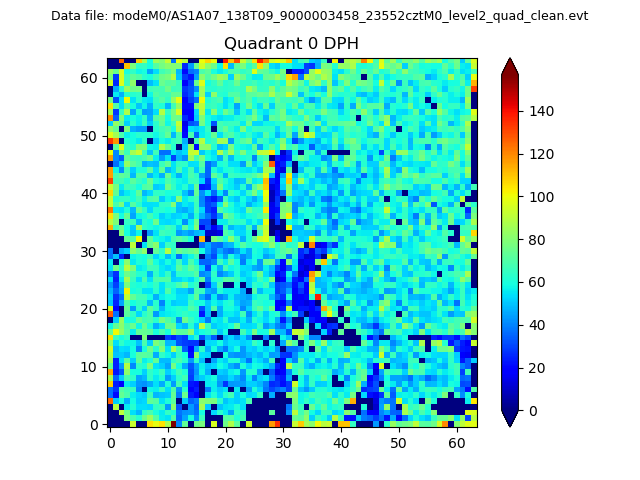 |
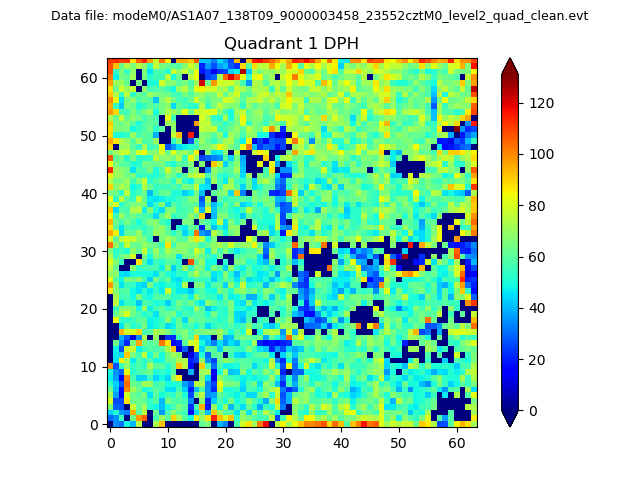 |
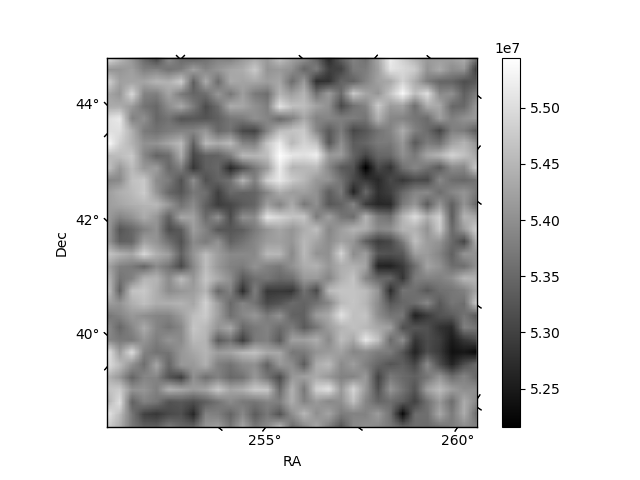
Quadrant B |
|---|---|---|---|
| Quadrant D | 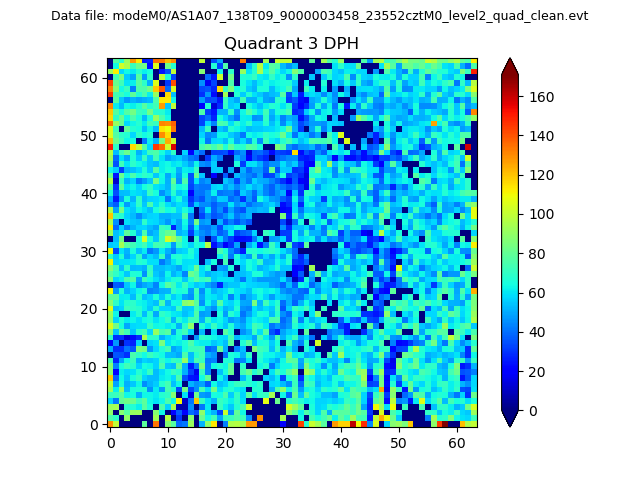 |
 |
Quadrant C |
| Plot type | Count rate plots | Images |
|---|---|---|
| Comparison with Poisson distribution Blue bars denote a histogram of data divided into 1 sec bins. Red curve is a Poisson curve with rate = median count rate of data. |
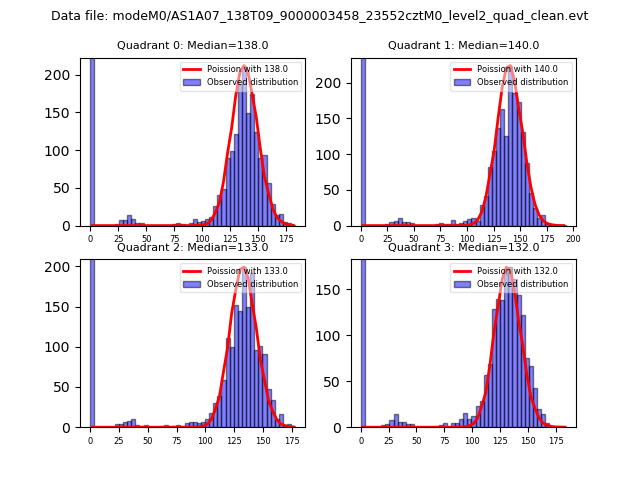 |
 |
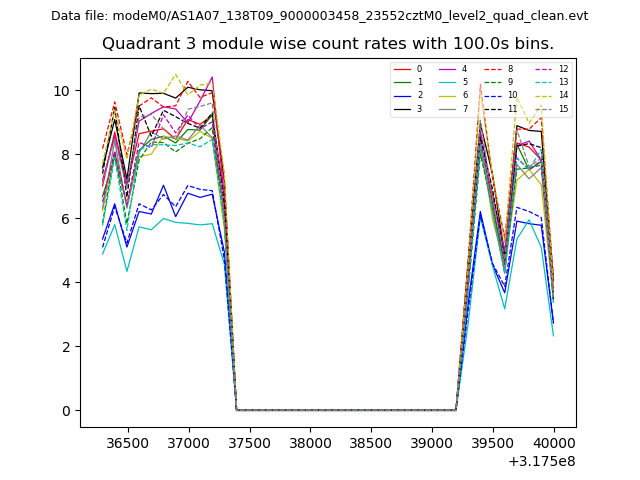
| Quadrant-wise count rates Data is divided into 100 sec bins |
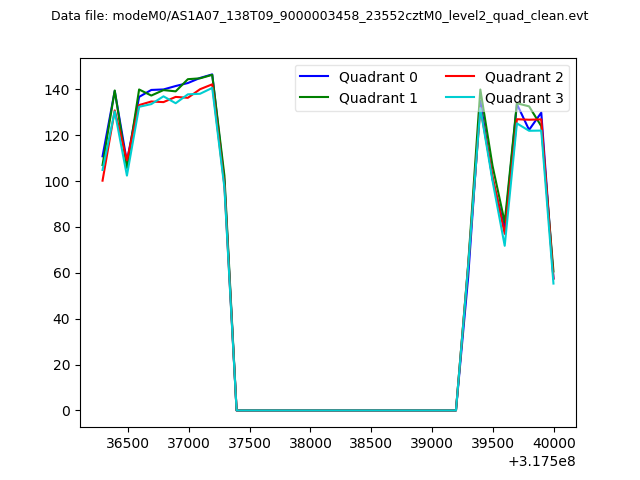 |
|
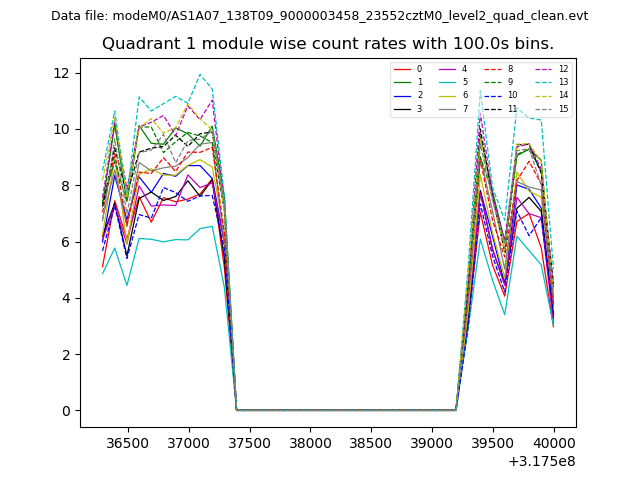
| Module-wise count rates for Quadrant A Data is divided into 100 sec bins |
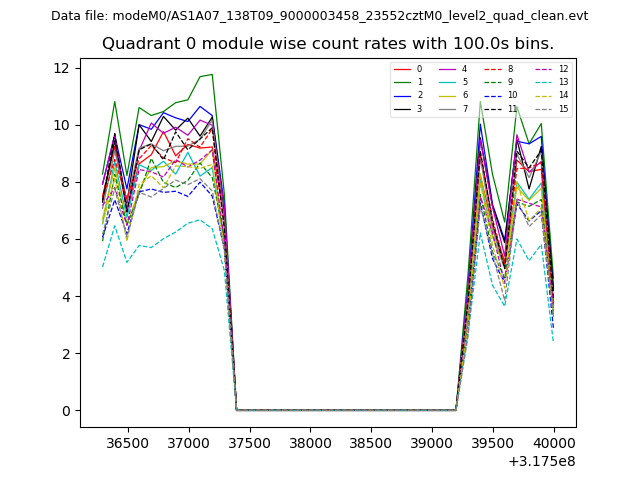 |
 |
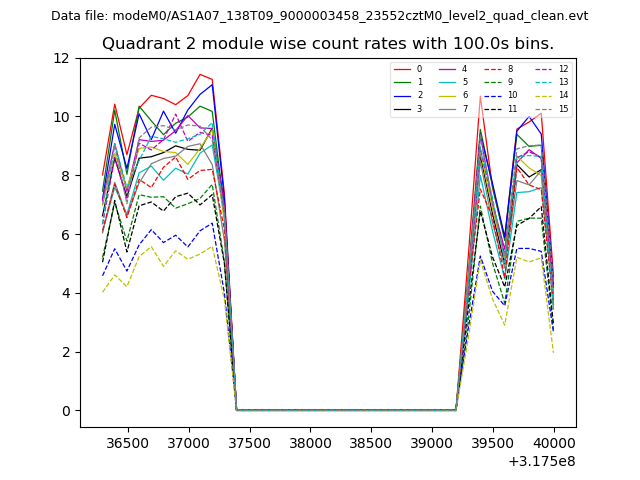
| Module-wise count rates for Quadrant B Data is divided into 100 sec bins |
 |
 |
| Module-wise count rates for Quadrant C Data is divided into 100 sec bins |
 |
 |
| Module-wise count rates for Quadrant D Data is divided into 100 sec bins |
 |
 |
| Parameter | Plot |
|---|---|
| CZT HV Monitor | 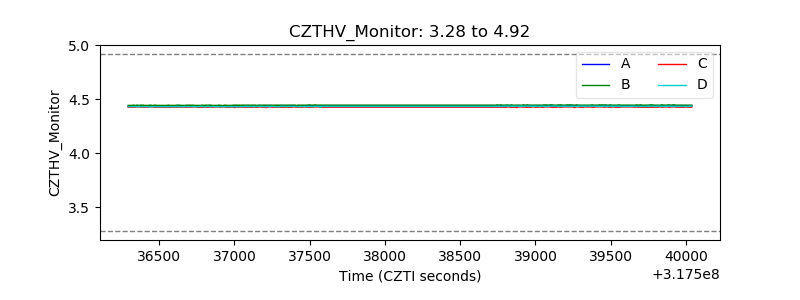 |
| D_VDD | 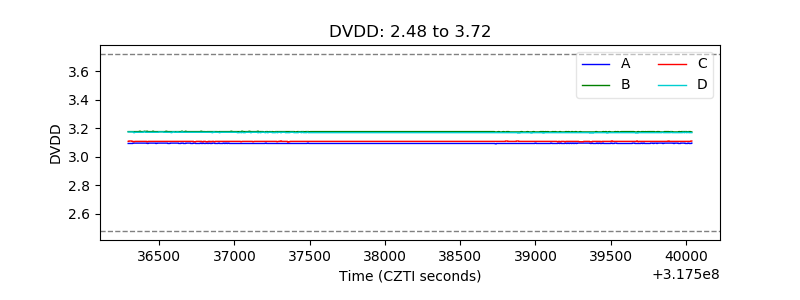 |
| Temperature 1 | 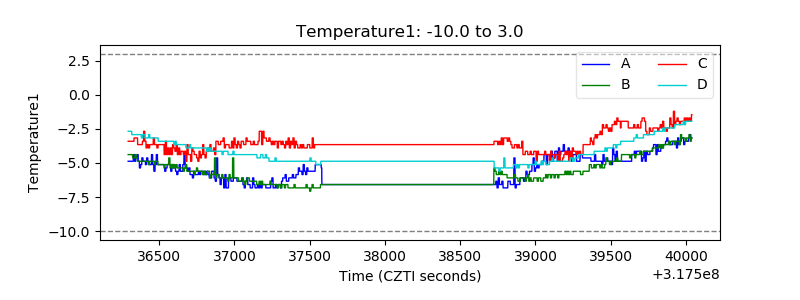 |
| Veto HV Monitor | 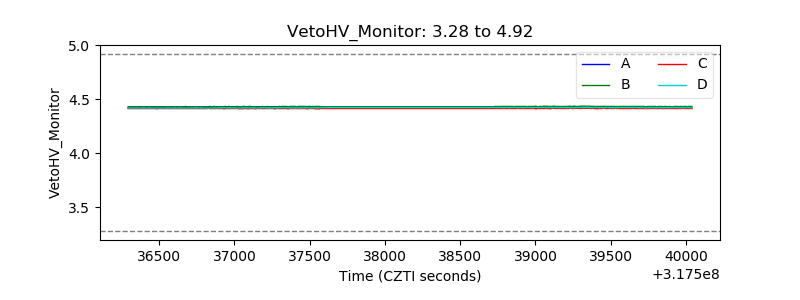 |
| Veto LLD | 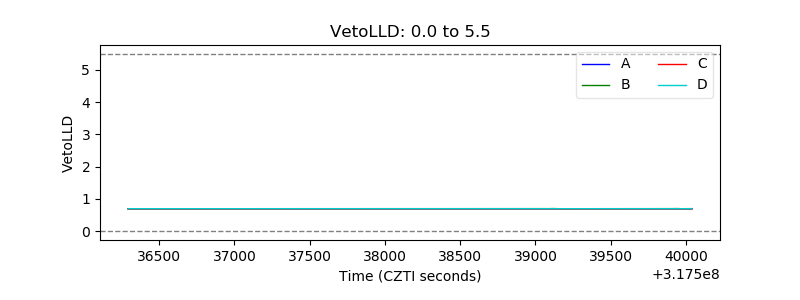 |
| Alpha Counter | 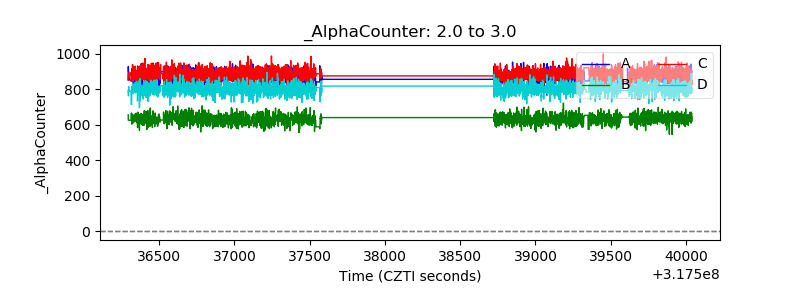 |
| _CPM_Rate | 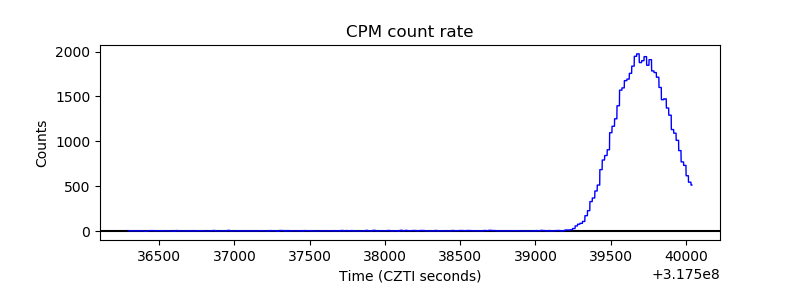 |
| CZT Counter | 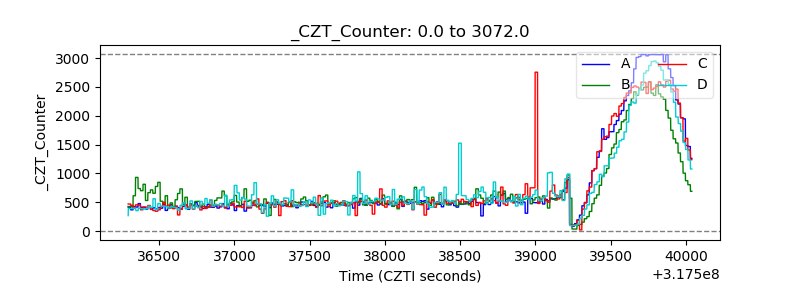 |
| +2.5 Volts monitor |  |
| +5 Volts monitor |  |
| _ROLL_ROT | 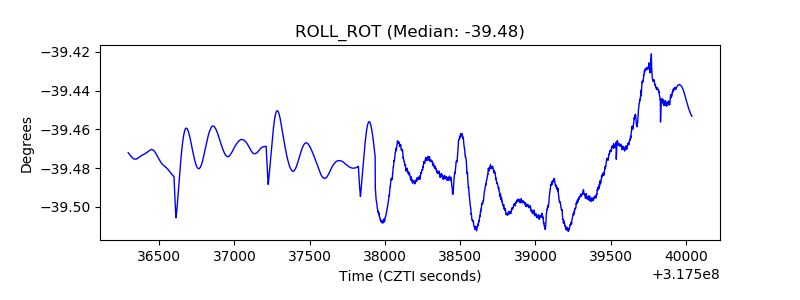 |
| _Roll_DEC | 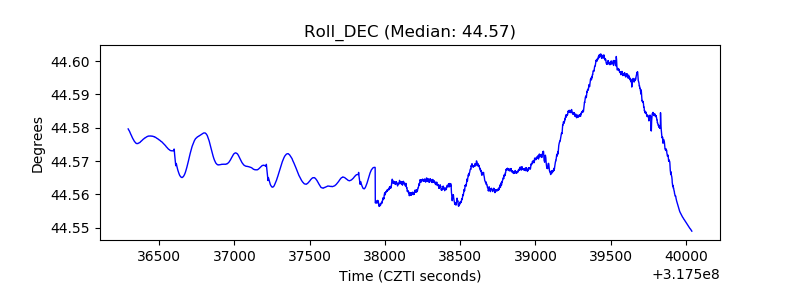 |
| _Roll_RA | 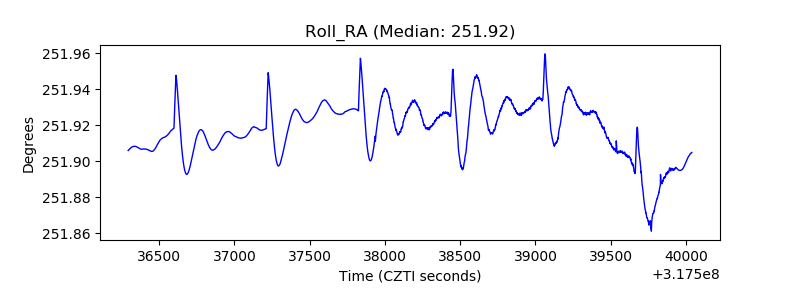 |
| Veto Counter | 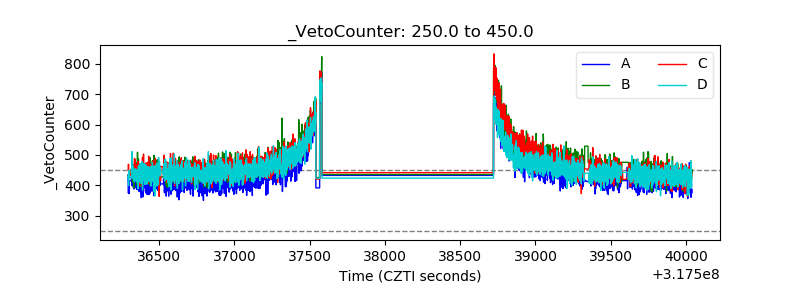 |