| Param | Original file | Final file |
|---|---|---|
| Filename | modeM0/AS1C05_002T04_9000003454_23363cztM0_level2.evt | modeM0/AS1C05_002T04_9000003454_23363cztM0_level2_quad_clean.evt |
| Size (bytes) | 340,240,320 | 52,450,560 |
| Size | 324.5 MB | 50.0 MB |
| Events in quadrant A | 2,166,593 | 329,748 |
| Events in quadrant B | 2,246,089 | 332,687 |
| Events in quadrant C | 3,085,809 | 319,090 |
| Events in quadrant D | 2,524,813 | 315,504 |
| Mode M9 | |||
|---|---|---|---|
| Quadrant | BADHDUFLAG | Total packets | Discarded packets |
| A | 1 | 140050077911944 | 46 |
| B | 1 | -1 | -1 |
| C | 1 | -1 | -1 |
| D | 1 | -1 | -1 |
| Mode SS | |||
|---|---|---|---|
| Quadrant | BADHDUFLAG | Total packets | Discarded packets |
| A | 0 | 82 | 0 |
| B | 0 | 82 | 0 |
| C | 0 | 82 | 0 |
| D | 0 | 82 | 0 |
| Mode M0 | |||
|---|---|---|---|
| Quadrant | BADHDUFLAG | Total packets | Discarded packets |
| A | 0 | 8951 | 1 |
| B | 0 | 9185 | 1 |
| C | 0 | 11949 | 1 |
| D | 0 | 10138 | 1 |
| Quadrant | Total seconds | Saturated seconds | Saturation percentage |
|---|---|---|---|
| A | 4127 | 9 | 0.218076% |
| B | 4127 | 13 | 0.314999% |
| C | 4127 | 95 | 2.301914% |
| D | 4127 | 60 | 1.453841% |
Noise dominated data is calculated using 1-second bins in cleaned event files. If a bin has >2000 counts, and if more than 50% of those come from <1% of pixels, then it is considered to be noise-dominated and hence unusable.
| Quadrant | # 1 sec bins | Bins with >0 counts | Bins with >2000 counts | High rate bins dominated by noise | Noise dominated (total time) | Noise dominated (detector-on time) | Marked lightcurve |
|---|---|---|---|---|---|---|---|
| A | 4127 | 4127 | 0 | 0 | 0.00% | 0.00% | 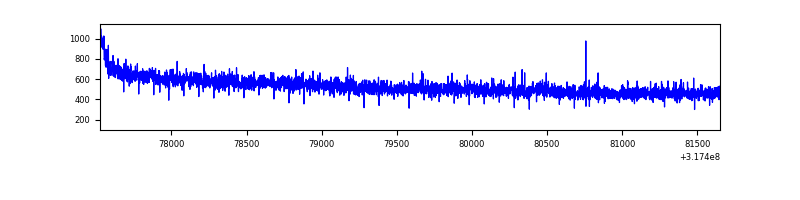 |
| B | 4127 | 4127 | 1 | 1 | 0.02% | 0.02% | 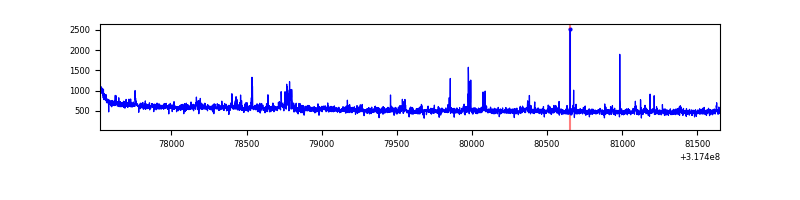 |
| C | 4127 | 4127 | 12 | 12 | 0.29% | 0.29% | 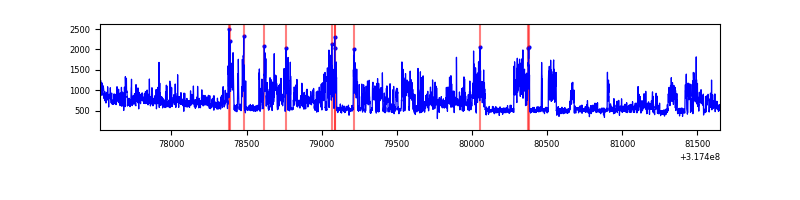 |
| D | 4127 | 4127 | 33 | 33 | 0.80% | 0.80% | 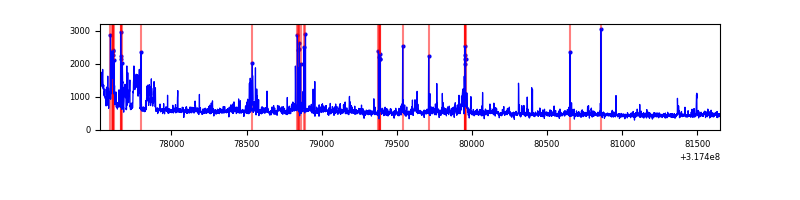 |
Top three noisy pixels from each quadrant. If the there are fewer than three noisy pixels in the level2.evt file, extra rows are filled as -1
| Pixel properties | Quadrant properties | ||||||
|---|---|---|---|---|---|---|---|
| Quadrant | DetID | PixID | Counts | Sigma | Mean | Median | Sigma |
| A | 13 | 254 | 6488 | 53.0 | 561 | 552 | 112.0 |
| A | 0 | 226 | 4978 | 39.52 | 561 | 552 | 112.0 |
| A | 12 | 194 | 4512 | 35.36 | 561 | 552 | 112.0 |
| B | 0 | 189 | 44471 | 425.31 | 552 | 540 | 103.3 |
| B | 0 | 190 | 27878 | 264.67 | 552 | 540 | 103.3 |
| B | 12 | 111 | 11377 | 104.92 | 552 | 540 | 103.3 |
| C | 0 | 239 | 877083 | 7103.21 | 539 | 544 | 123.4 |
| C | 14 | 238 | 88677 | 714.2 | 539 | 544 | 123.4 |
| C | 7 | 247 | 12209 | 94.53 | 539 | 544 | 123.4 |
| D | 1 | 52 | 277348 | 2057.74 | 551 | 536 | 134.5 |
| D | 6 | 112 | 64258 | 473.69 | 551 | 536 | 134.5 |
| D | 12 | 233 | 36173 | 264.92 | 551 | 536 | 134.5 |
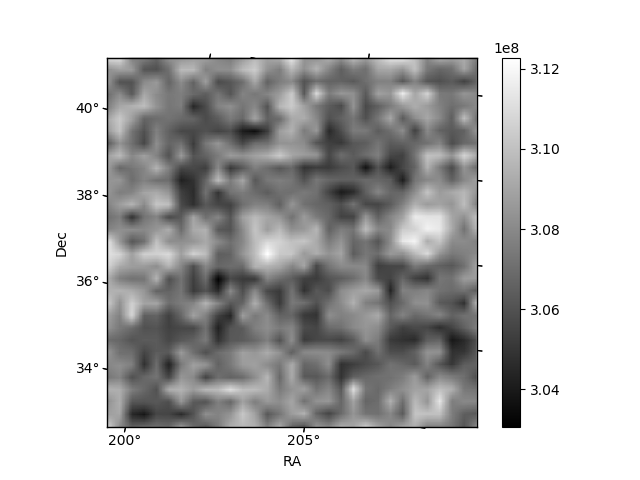
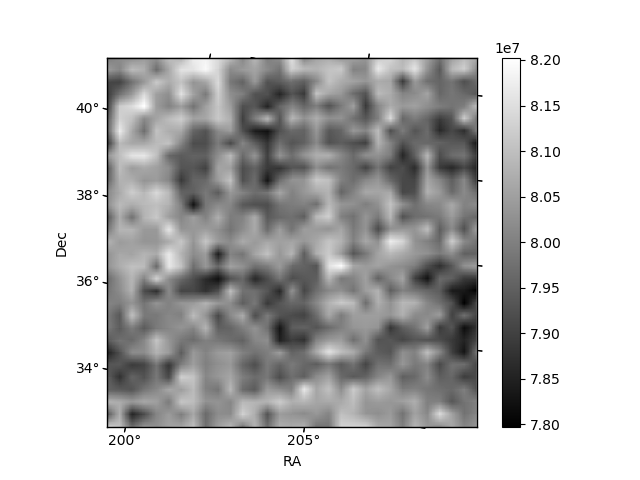
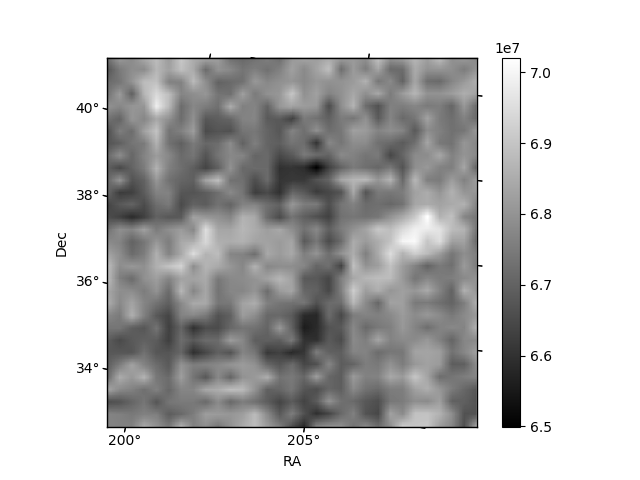
Histogram calculated using DETX and DETY for each event in the final _common_clean file
| Quadrant A | 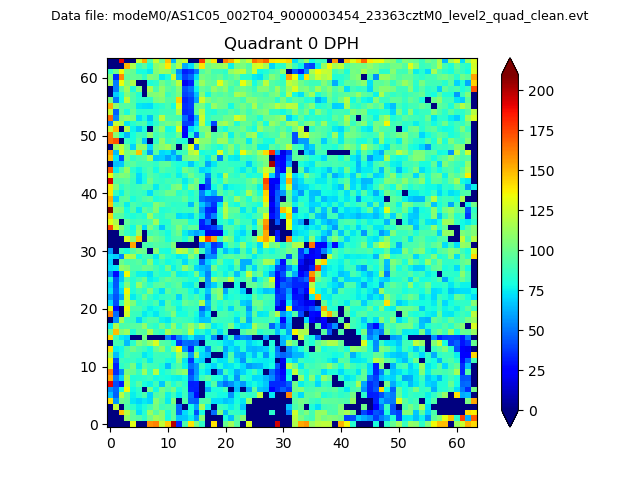 |
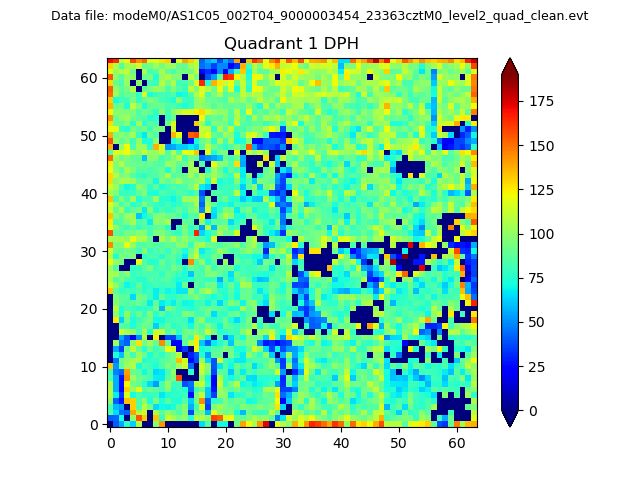 |
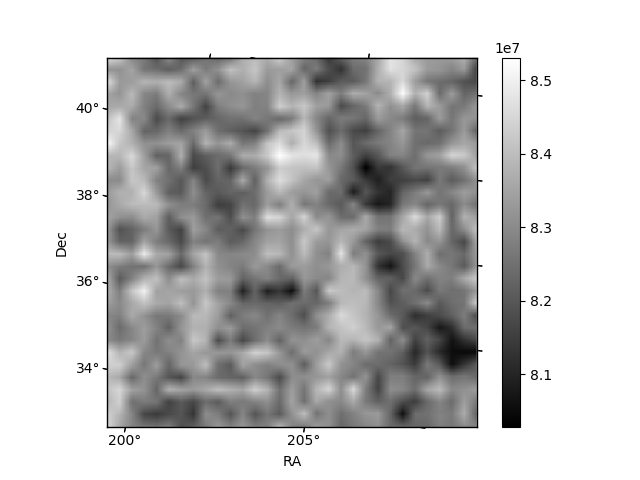
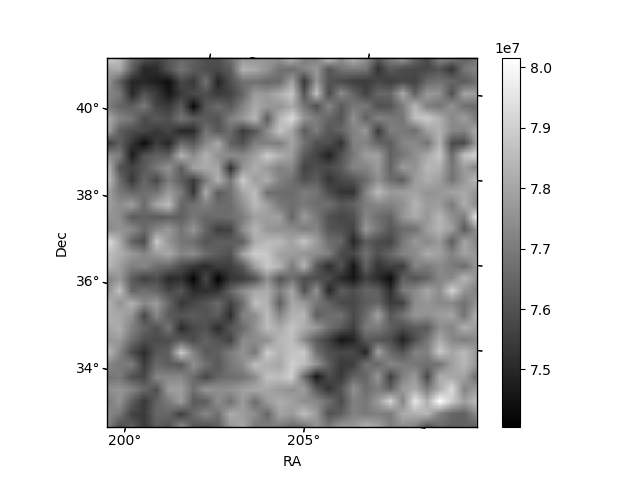
Quadrant B |
|---|---|---|---|
| Quadrant D | 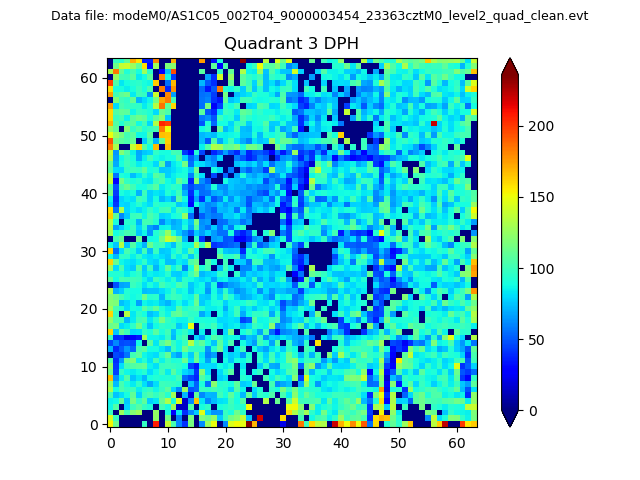 |
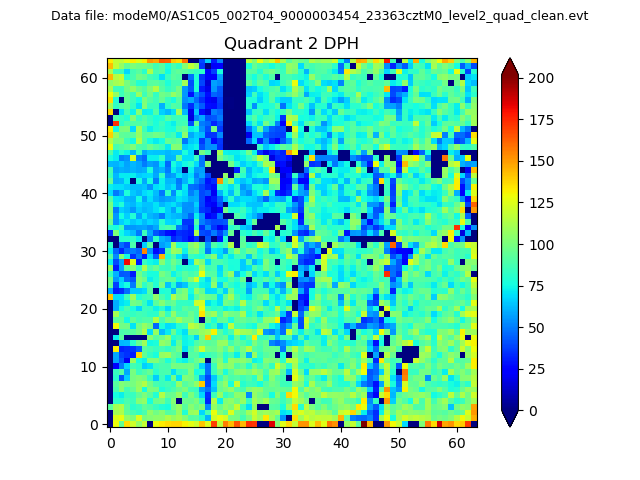 |
Quadrant C |
| Plot type | Count rate plots | Images |
|---|---|---|
| Comparison with Poisson distribution Blue bars denote a histogram of data divided into 1 sec bins. Red curve is a Poisson curve with rate = median count rate of data. |
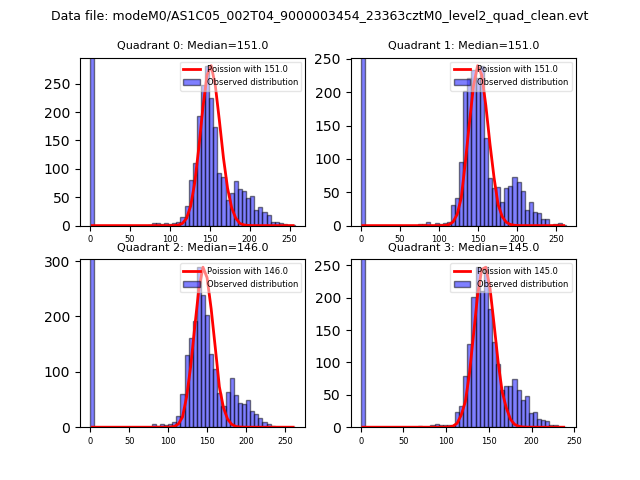 |
 |
| Quadrant-wise count rates Data is divided into 100 sec bins |
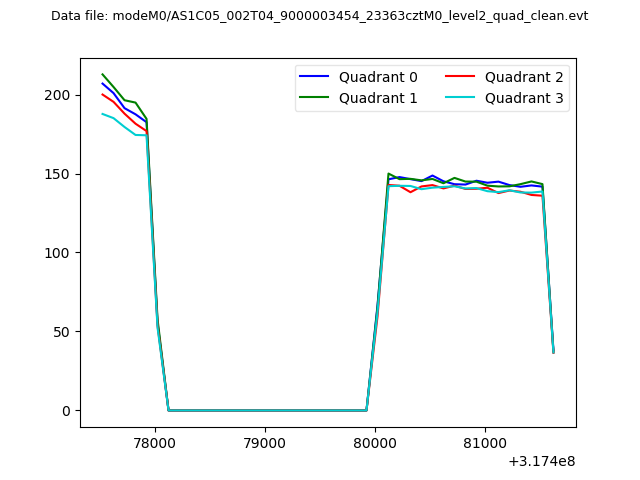 |
|
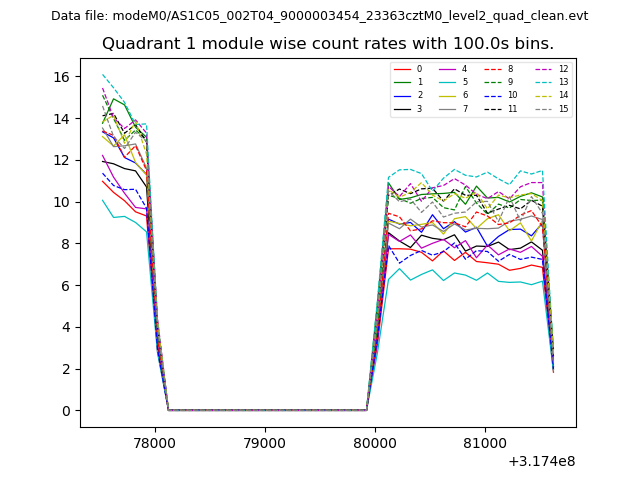
| Module-wise count rates for Quadrant A Data is divided into 100 sec bins |
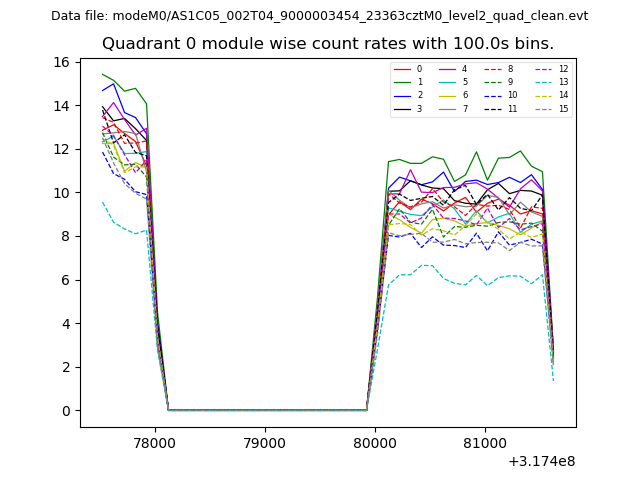 |
 |
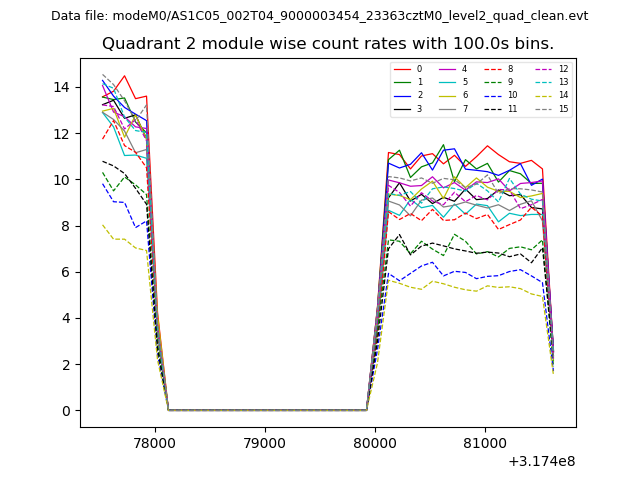
| Module-wise count rates for Quadrant B Data is divided into 100 sec bins |
 |
 |
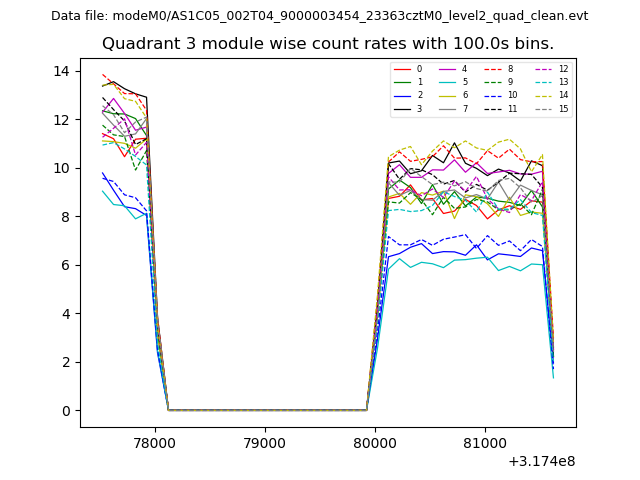
| Module-wise count rates for Quadrant C Data is divided into 100 sec bins |
 |
 |
| Module-wise count rates for Quadrant D Data is divided into 100 sec bins |
 |
 |
| Parameter | Plot |
|---|---|
| CZT HV Monitor | 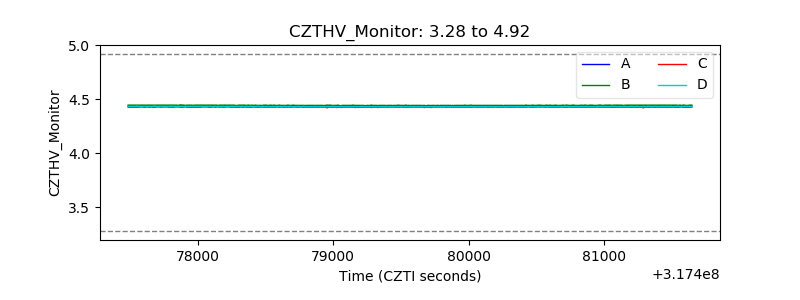 |
| D_VDD | 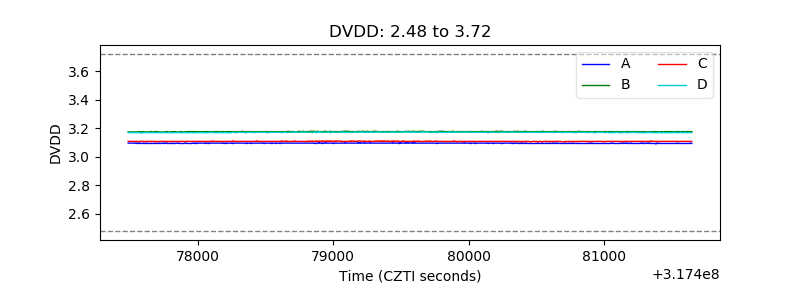 |
| Temperature 1 | 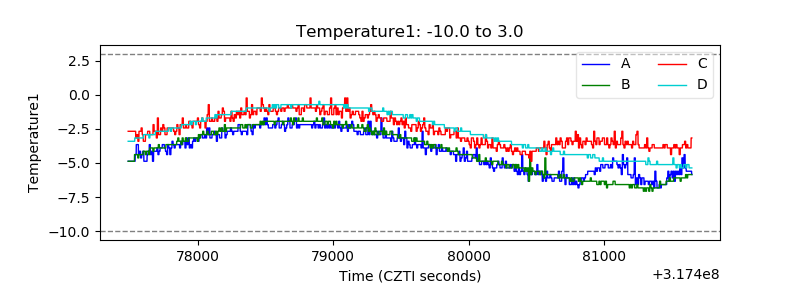 |
| Veto HV Monitor | 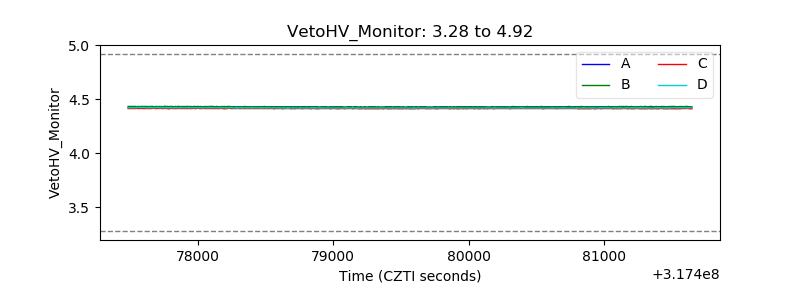 |
| Veto LLD | 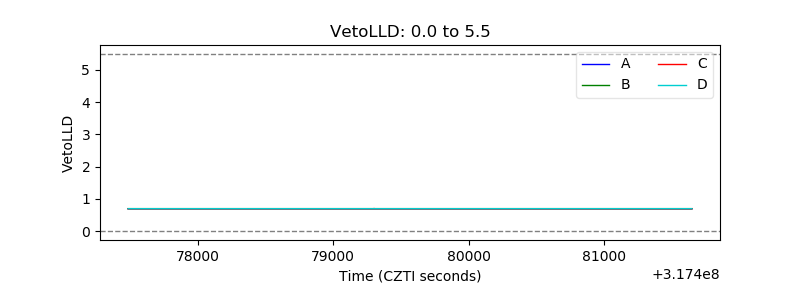 |
| Alpha Counter | 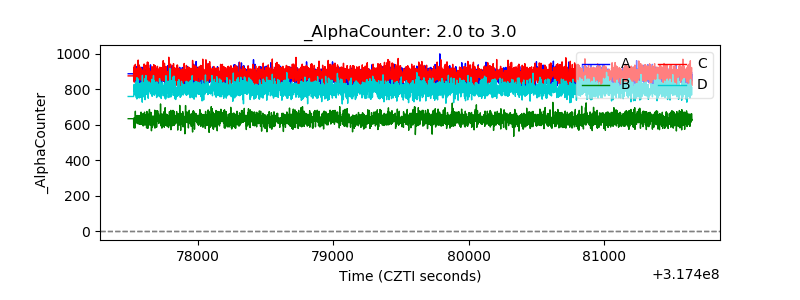 |
| _CPM_Rate | 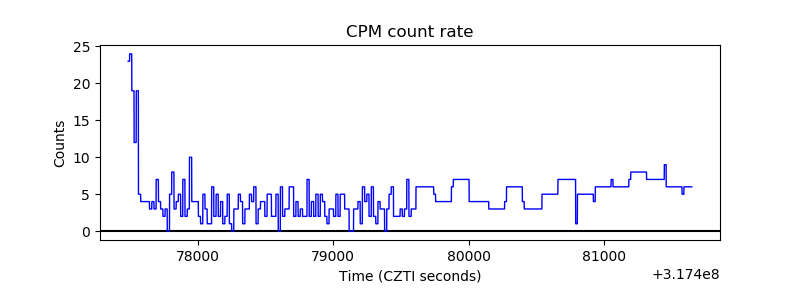 |
| CZT Counter | 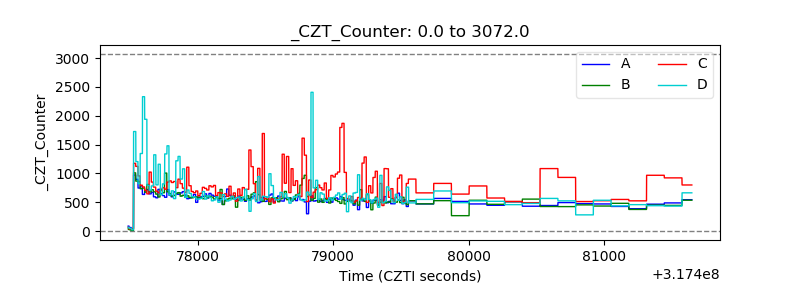 |
| +2.5 Volts monitor | 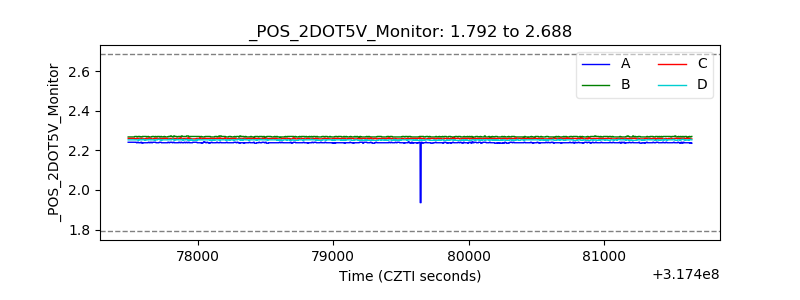 |
| +5 Volts monitor |  |
| _ROLL_ROT | 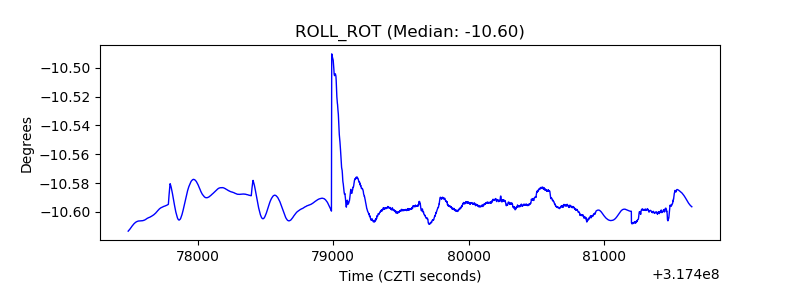 |
| _Roll_DEC | 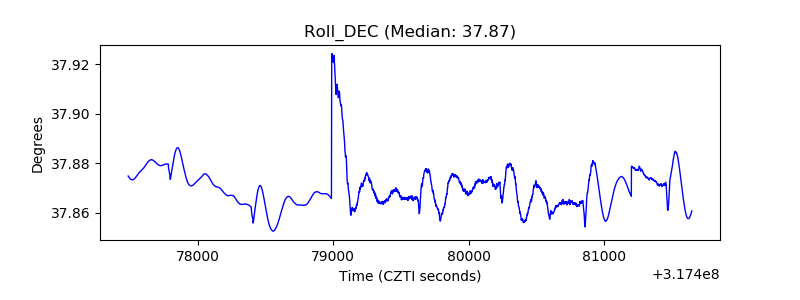 |
| _Roll_RA | 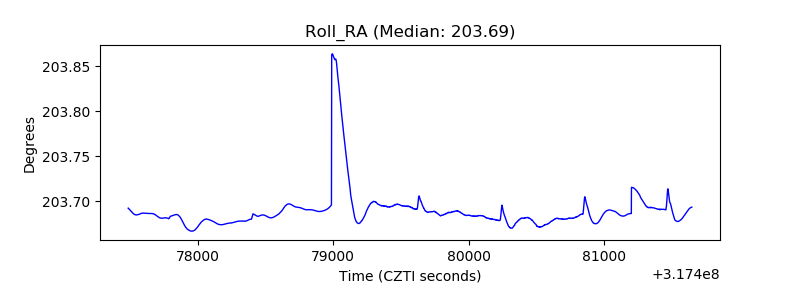 |
| Veto Counter | 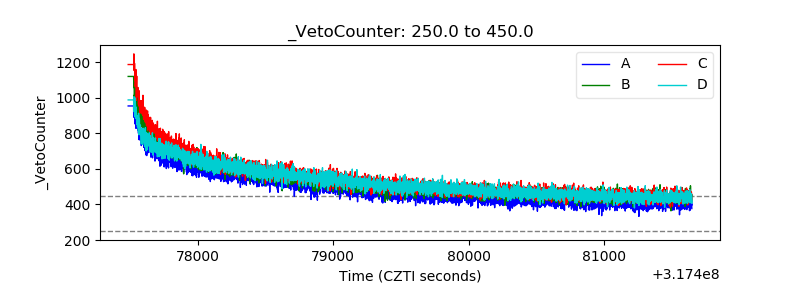 |