| Param | Original file | Final file |
|---|---|---|
| Filename | modeM0/AS1A07_127T02_9000003460cztM0_level2.fits | modeM0/AS1A07_127T02_9000003460cztM0_level2_quad_clean.evt |
| Size (bytes) | 1,336,115,520 | 1,108,465,920 |
| Size | 1.2 GB | 1.0 GB |
| Events in quadrant A | 8,437,954 | 6,612,081 |
| Events in quadrant B | 8,071,608 | 6,599,907 |
| Events in quadrant C | 8,073,150 | 6,188,427 |
| Events in quadrant D | 6,701,842 | 4,994,122 |
| Mode M9 | |||
|---|---|---|---|
| Quadrant | BADHDUFLAG | Total packets | Discarded packets |
| A | 0 | 215 | 0 |
| B | 0 | 215 | 0 |
| C | 0 | 215 | 0 |
| D | 0 | 215 | 0 |
| Mode M0 | |||
|---|---|---|---|
| Quadrant | BADHDUFLAG | Total packets | Discarded packets |
| A | 0 | 299481 | 0 |
| B | 0 | 288802 | 0 |
| C | 0 | 288895 | 0 |
| D | 0 | 415049 | 0 |
| Mode SS | |||
|---|---|---|---|
| Quadrant | BADHDUFLAG | Total packets | Discarded packets |
| A | 0 | 2724 | 0 |
| B | 0 | 2724 | 0 |
| C | 0 | 2726 | 0 |
| D | 0 | 2724 | 0 |
| Quadrant | Total seconds | Saturated seconds | Saturation percentage |
|---|---|---|---|
| A | 133876 | 2381 | 1.778511% |
| B | 133887 | 1862 | 1.390725% |
| C | 133880 | 2573 | 1.921870% |
| D | 133866 | 17125 | 12.792643% |
Noise dominated data is calculated using 1-second bins in cleaned event files. If a bin has >2000 counts, and if more than 50% of those come from <1% of pixels, then it is considered to be noise-dominated and hence unusable.
| Quadrant | # 1 sec bins | Bins with >0 counts | Bins with >2000 counts | High rate bins dominated by noise | Noise dominated (total time) | Noise dominated (detector-on time) | Marked lightcurve |
|---|---|---|---|---|---|---|---|
| A | 155493 | 133879 | 0 | 0 | 0.00% | 0.00% |  |
| B | 155493 | 133875 | 0 | 0 | 0.00% | 0.00% |  |
| C | 155493 | 133878 | 0 | 0 | 0.00% | 0.00% |  |
| D | 155493 | 133515 | 0 | 0 | 0.00% | 0.00% | 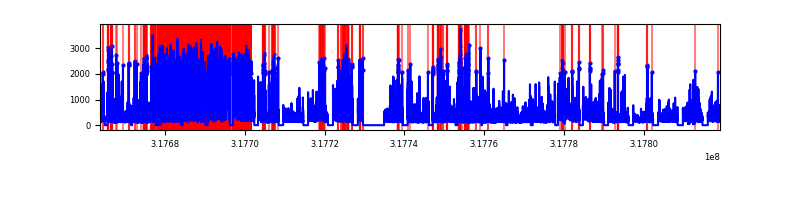 |
Top three noisy pixels from each quadrant. If the there are fewer than three noisy pixels in the level2.evt file, extra rows are filled as -1
| Pixel properties | Quadrant properties | ||||||
|---|---|---|---|---|---|---|---|
| Quadrant | DetID | PixID | Counts | Sigma | Mean | Median | Sigma |
| A | 0 | 29 | 8034 | 11.26 | 2195 | 2060 | 530.7 |
| A | 7 | 110 | 6696 | 8.74 | 2195 | 2060 | 530.7 |
| A | 9 | 19 | 6177 | 7.76 | 2195 | 2060 | 530.7 |
| B | 2 | 9 | 6435 | 10.56 | 2132 | 2038 | 416.3 |
| B | 3 | 80 | 5481 | 8.27 | 2132 | 2038 | 416.3 |
| B | 5 | 128 | 5321 | 7.89 | 2132 | 2038 | 416.3 |
| C | 1 | 81 | 6186 | 7.71 | 2132 | 1994 | 543.6 |
| C | 1 | 80 | 6186 | 7.71 | 2132 | 1994 | 543.6 |
| C | 12 | 241 | 5607 | 6.65 | 2132 | 1994 | 543.6 |
| D | 15 | 46 | 4729 | 5.89 | 1914 | 1747 | 505.9 |
| D | 6 | 231 | 4673 | 5.78 | 1914 | 1747 | 505.9 |
| D | 7 | 3 | 4601 | 5.64 | 1914 | 1747 | 505.9 |
Histogram calculated using DETX and DETY for each event in the final _common_clean file
| Quadrant A |  |
 |
Quadrant B |
|---|---|---|---|
| Quadrant D |  |
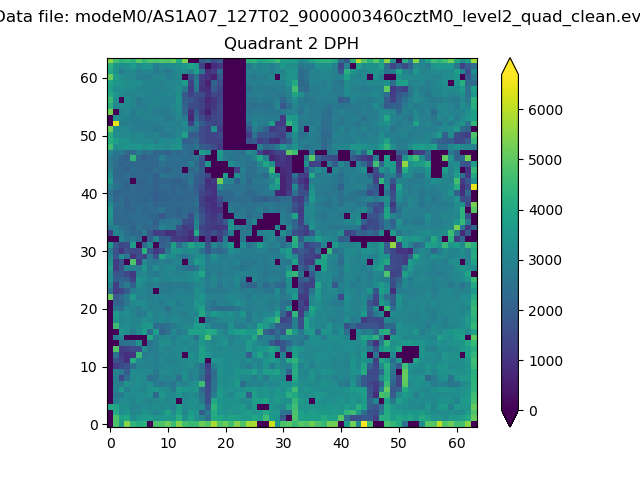 |
Quadrant C |
| Plot type | Count rate plots | Images |
|---|---|---|
| Comparison with Poisson distribution Blue bars denote a histogram of data divided into 1 sec bins. Red curve is a Poisson curve with rate = median count rate of data. |
 |
 |
| Quadrant-wise count rates Data is divided into 100 sec bins |
 |
|
| Module-wise count rates for Quadrant A Data is divided into 100 sec bins |
 |
 |
| Module-wise count rates for Quadrant B Data is divided into 100 sec bins |
 |
 |
| Module-wise count rates for Quadrant C Data is divided into 100 sec bins |
 |
 |
| Module-wise count rates for Quadrant D Data is divided into 100 sec bins |
 |
 |
| Parameter | Plot |
|---|---|
| CZT HV Monitor |  |
| D_VDD | 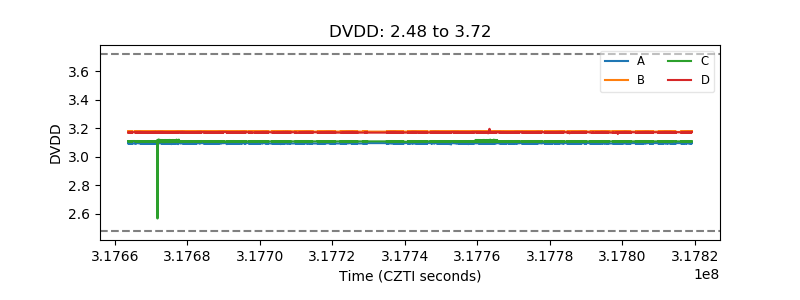 |
| Temperature 1 |  |
| Veto HV Monitor |  |
| Veto LLD |  |
| Alpha Counter |  |
| _CPM_Rate |  |
| CZT Counter |  |
| +2.5 Volts monitor |  |
| +5 Volts monitor |  |
| _ROLL_ROT |  |
| _Roll_DEC |  |
| _Roll_RA |  |
| Veto Counter |  |