| Param | Original file | Final file |
|---|---|---|
| Filename | modeM0/AS1A07_127T02_9000003460_23394cztM0_level2.evt | modeM0/AS1A07_127T02_9000003460_23394cztM0_level2_quad_clean.evt |
| Size (bytes) | 213,632,640 | 48,755,520 |
| Size | 203.7 MB | 46.5 MB |
| Events in quadrant A | 1,447,910 | 325,873 |
| Events in quadrant B | 1,508,799 | 328,328 |
| Events in quadrant C | 1,525,845 | 313,276 |
| Events in quadrant D | 1,794,282 | 307,727 |
| Mode M9 | |||
|---|---|---|---|
| Quadrant | BADHDUFLAG | Total packets | Discarded packets |
| A | 0 | 7 | 0 |
| B | 0 | 7 | 0 |
| C | 0 | 7 | 0 |
| D | 0 | 7 | 0 |
| Mode M0 | |||
|---|---|---|---|
| Quadrant | BADHDUFLAG | Total packets | Discarded packets |
| A | 0 | 6018 | 1 |
| B | 0 | 6208 | 2 |
| C | 0 | 6197 | 1 |
| D | 0 | 7242 | 1 |
| Mode SS | |||
|---|---|---|---|
| Quadrant | BADHDUFLAG | Total packets | Discarded packets |
| A | 0 | 56 | 0 |
| B | 0 | 56 | 0 |
| C | 0 | 56 | 0 |
| D | 0 | 56 | 0 |
| Quadrant | Total seconds | Saturated seconds | Saturation percentage |
|---|---|---|---|
| A | 2820 | 60 | 2.127660% |
| B | 2819 | 70 | 2.483150% |
| C | 2819 | 82 | 2.908833% |
| D | 2819 | 153 | 5.427457% |
Noise dominated data is calculated using 1-second bins in cleaned event files. If a bin has >2000 counts, and if more than 50% of those come from <1% of pixels, then it is considered to be noise-dominated and hence unusable.
| Quadrant | # 1 sec bins | Bins with >0 counts | Bins with >2000 counts | High rate bins dominated by noise | Noise dominated (total time) | Noise dominated (detector-on time) | Marked lightcurve |
|---|---|---|---|---|---|---|---|
| A | 3475 | 2821 | 0 | 0 | 0.00% | 0.00% | 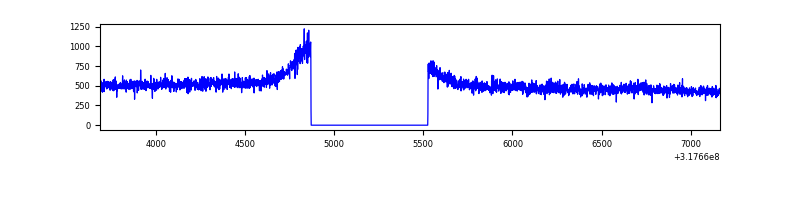 |
| B | 3474 | 2819 | 6 | 6 | 0.17% | 0.21% | 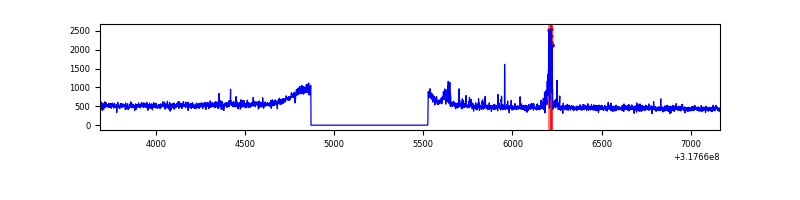 |
| C | 3474 | 2820 | 0 | 0 | 0.00% | 0.00% | 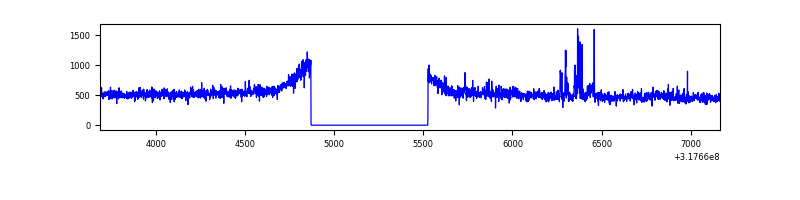 |
| D | 3474 | 2819 | 88 | 88 | 2.53% | 3.12% | 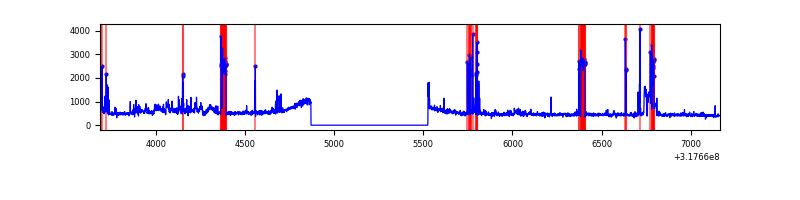 |
Top three noisy pixels from each quadrant. If the there are fewer than three noisy pixels in the level2.evt file, extra rows are filled as -1
| Pixel properties | Quadrant properties | ||||||
|---|---|---|---|---|---|---|---|
| Quadrant | DetID | PixID | Counts | Sigma | Mean | Median | Sigma |
| A | 6 | 16 | 4298 | 50.72 | 374 | 366 | 77.5 |
| A | 13 | 254 | 3907 | 45.67 | 374 | 366 | 77.5 |
| A | 3 | 137 | 3467 | 40.0 | 374 | 366 | 77.5 |
| B | 0 | 189 | 56632 | 765.55 | 368 | 358 | 73.5 |
| B | 0 | 190 | 9279 | 121.36 | 368 | 358 | 73.5 |
| B | 12 | 111 | 8809 | 114.97 | 368 | 358 | 73.5 |
| C | 10 | 9 | 84010 | 982.57 | 355 | 357 | 85.1 |
| C | 14 | 238 | 54533 | 636.34 | 355 | 357 | 85.1 |
| C | 13 | 61 | 2370 | 23.64 | 355 | 357 | 85.1 |
| D | 1 | 52 | 423917 | 4735.01 | 361 | 350 | 89.5 |
| D | 2 | 234 | 11870 | 128.78 | 361 | 350 | 89.5 |
| D | 14 | 226 | 3555 | 35.83 | 361 | 350 | 89.5 |
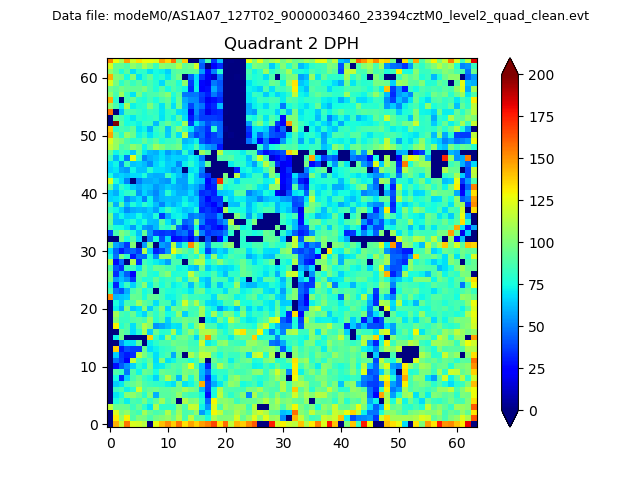
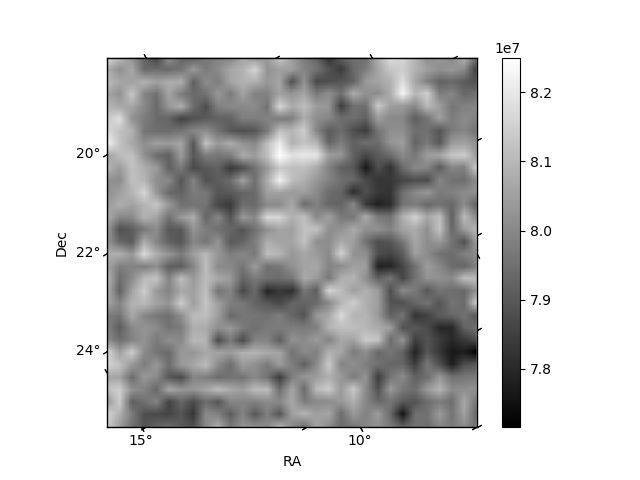
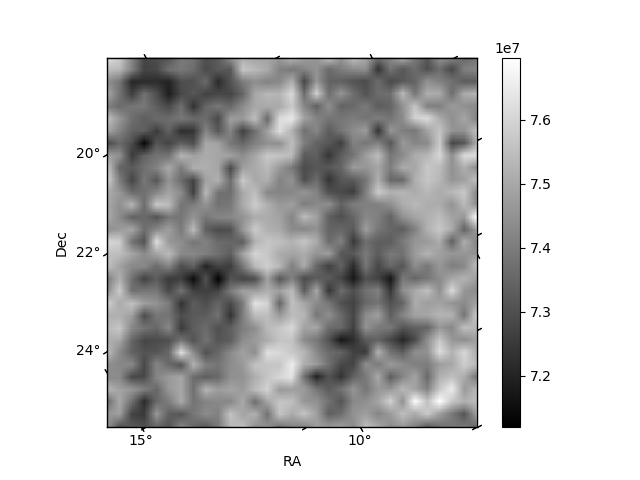
Histogram calculated using DETX and DETY for each event in the final _common_clean file
| Quadrant A | 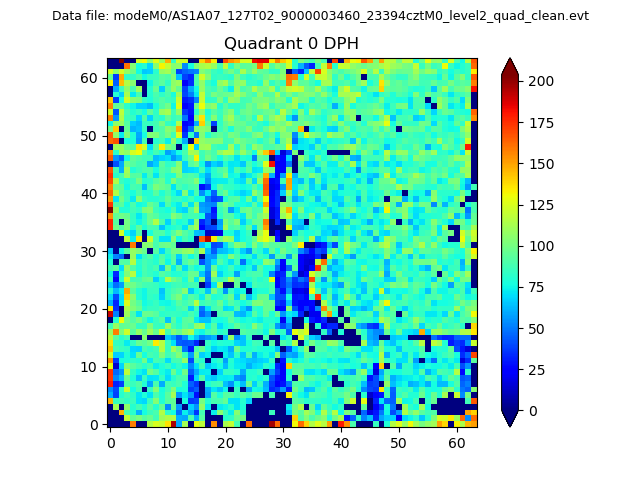 |
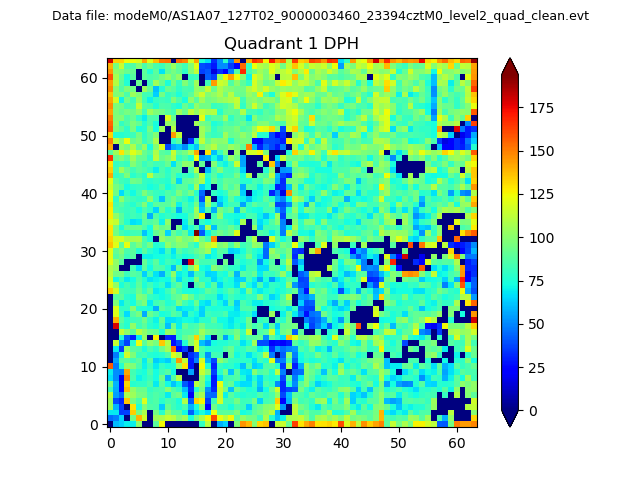 |
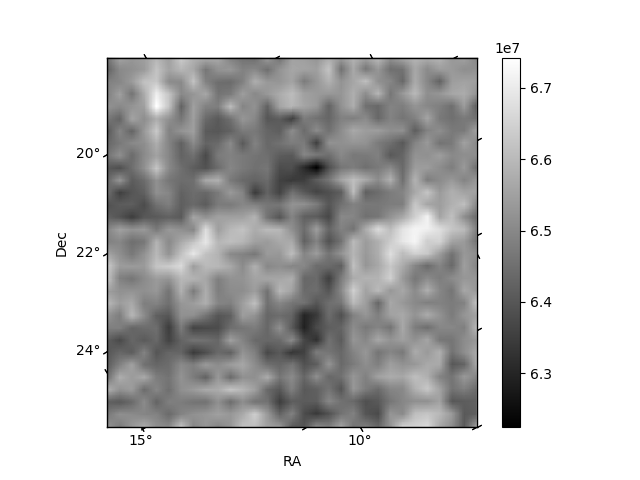
Quadrant B |
|---|---|---|---|
| Quadrant D | 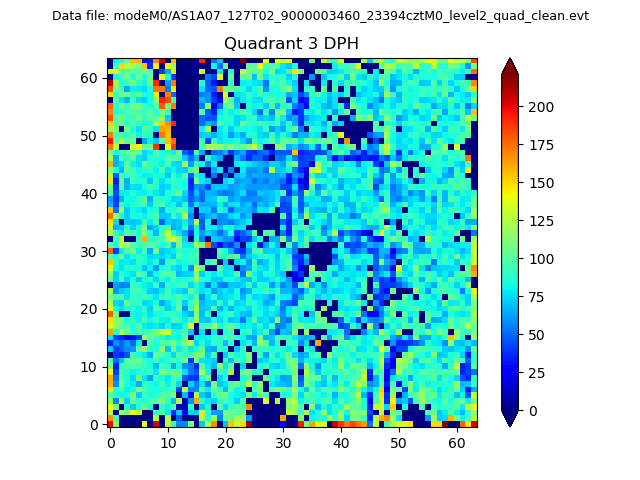 |
 |
Quadrant C |
| Plot type | Count rate plots | Images |
|---|---|---|
| Comparison with Poisson distribution Blue bars denote a histogram of data divided into 1 sec bins. Red curve is a Poisson curve with rate = median count rate of data. |
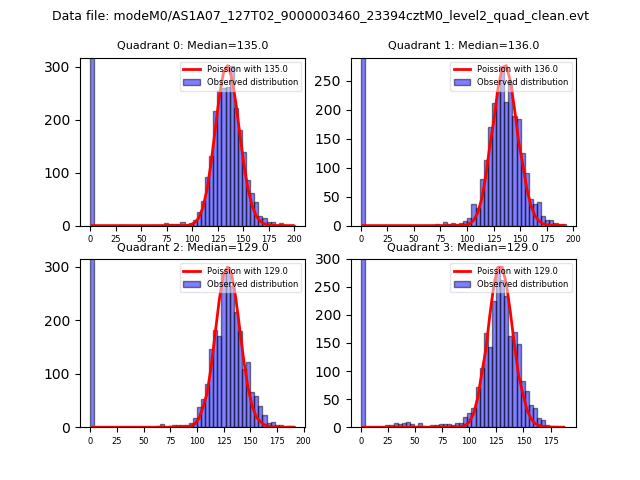 |
 |
| Quadrant-wise count rates Data is divided into 100 sec bins |
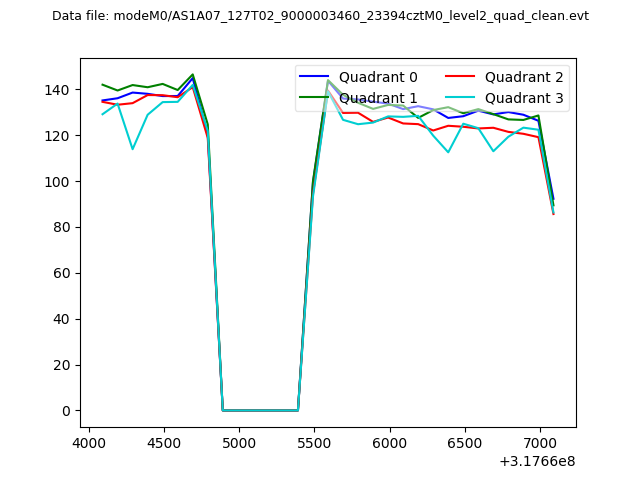 |
|
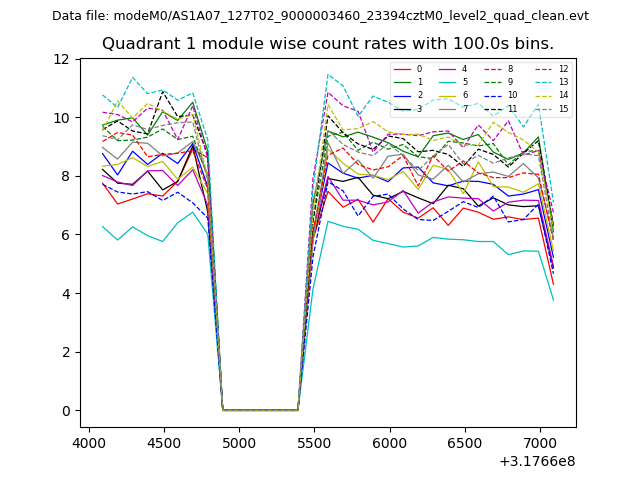
| Module-wise count rates for Quadrant A Data is divided into 100 sec bins |
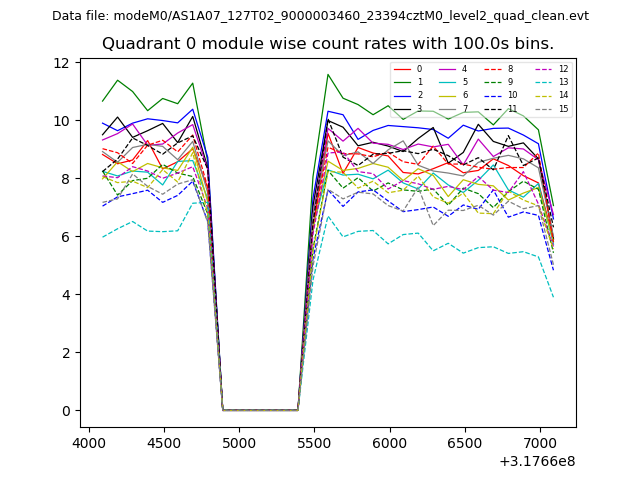 |
 |
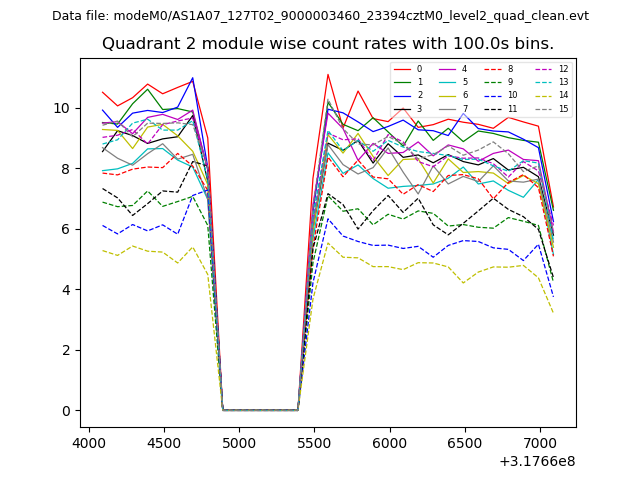
| Module-wise count rates for Quadrant B Data is divided into 100 sec bins |
 |
 |
| Module-wise count rates for Quadrant C Data is divided into 100 sec bins |
 |
 |
| Module-wise count rates for Quadrant D Data is divided into 100 sec bins |
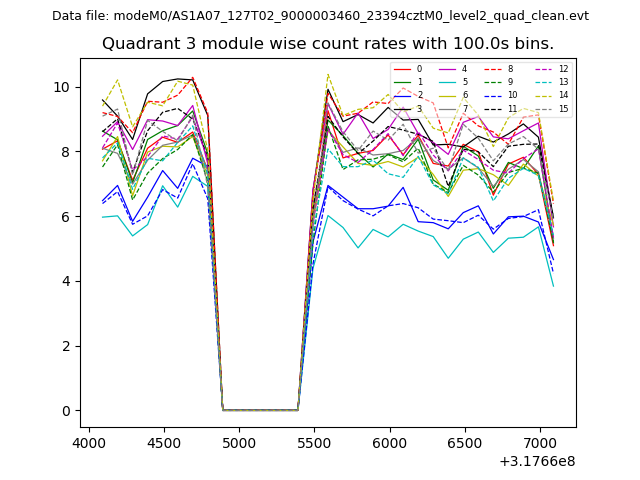 |
 |
| Parameter | Plot |
|---|---|
| CZT HV Monitor | 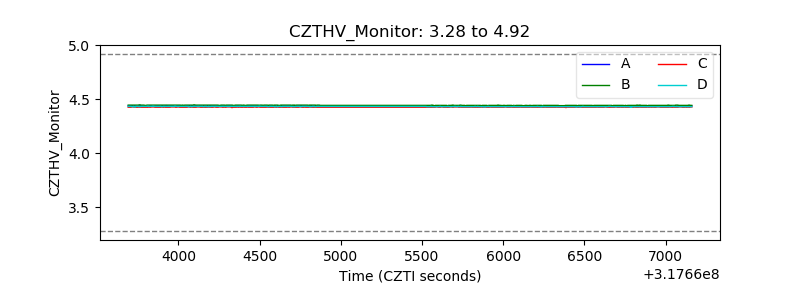 |
| D_VDD | 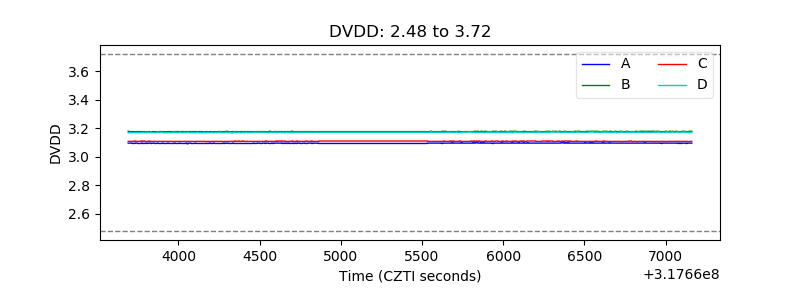 |
| Temperature 1 | 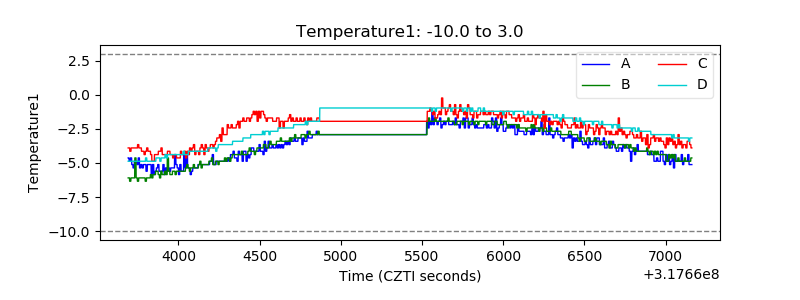 |
| Veto HV Monitor | 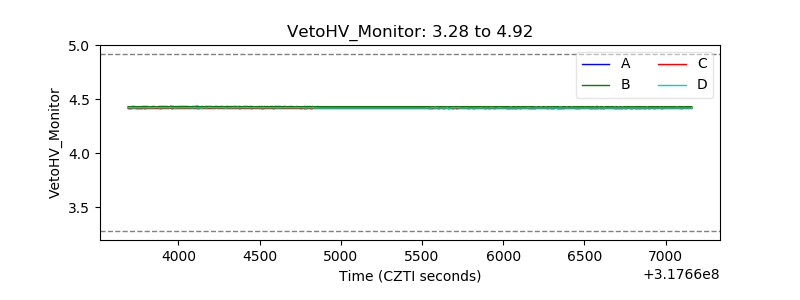 |
| Veto LLD | 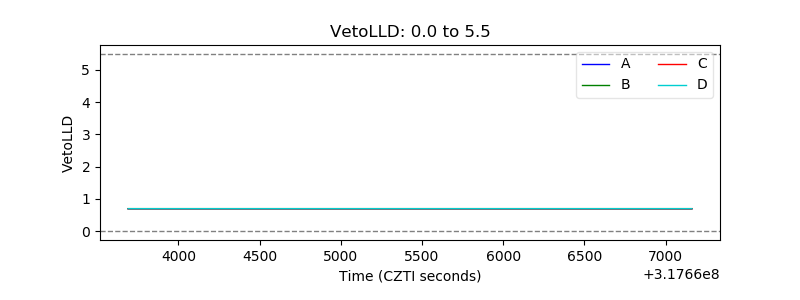 |
| Alpha Counter | 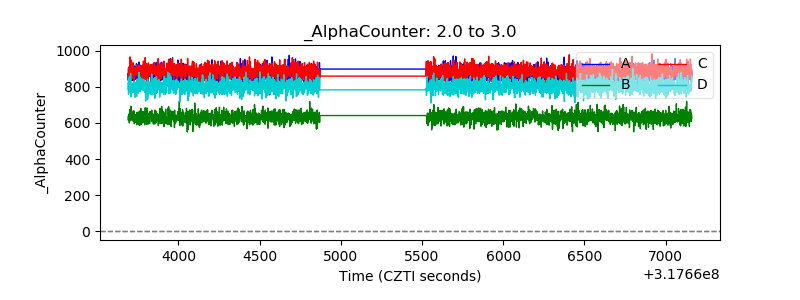 |
| _CPM_Rate | 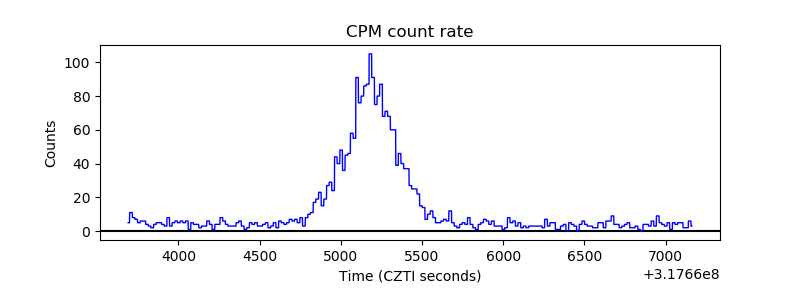 |
| CZT Counter |  |
| +2.5 Volts monitor |  |
| +5 Volts monitor |  |
| _ROLL_ROT |  |
| _Roll_DEC | 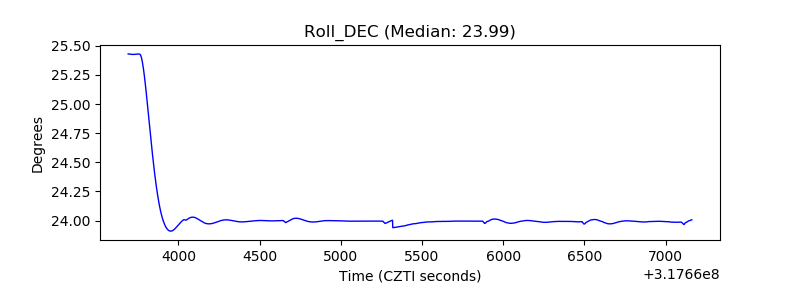 |
| _Roll_RA |  |
| Veto Counter |  |