| Param | Original file | Final file |
|---|---|---|
| Filename | modeM0/AS1A07_127T02_9000003460_23395cztM0_level2.evt | modeM0/AS1A07_127T02_9000003460_23395cztM0_level2_quad_clean.evt |
| Size (bytes) | 464,610,240 | 95,080,320 |
| Size | 443.1 MB | 90.7 MB |
| Events in quadrant A | 3,240,585 | 611,964 |
| Events in quadrant B | 3,401,431 | 615,255 |
| Events in quadrant C | 3,461,162 | 586,725 |
| Events in quadrant D | 3,496,461 | 582,526 |
| Mode M9 | |||
|---|---|---|---|
| Quadrant | BADHDUFLAG | Total packets | Discarded packets |
| A | 0 | 3 | 0 |
| B | 0 | 3 | 0 |
| C | 0 | 3 | 0 |
| D | 0 | 3 | 0 |
| Mode M0 | |||
|---|---|---|---|
| Quadrant | BADHDUFLAG | Total packets | Discarded packets |
| A | 0 | 14208 | 2 |
| B | 0 | 14555 | 1 |
| C | 0 | 14542 | 1 |
| D | 0 | 15137 | 1 |
| Mode SS | |||
|---|---|---|---|
| Quadrant | BADHDUFLAG | Total packets | Discarded packets |
| A | 0 | 140 | 0 |
| B | 0 | 140 | 0 |
| C | 0 | 140 | 0 |
| D | 0 | 140 | 0 |
| Quadrant | Total seconds | Saturated seconds | Saturation percentage |
|---|---|---|---|
| A | 6934 | 18 | 0.259590% |
| B | 6935 | 54 | 0.778659% |
| C | 6935 | 69 | 0.994953% |
| D | 6935 | 94 | 1.355443% |
Noise dominated data is calculated using 1-second bins in cleaned event files. If a bin has >2000 counts, and if more than 50% of those come from <1% of pixels, then it is considered to be noise-dominated and hence unusable.
| Quadrant | # 1 sec bins | Bins with >0 counts | Bins with >2000 counts | High rate bins dominated by noise | Noise dominated (total time) | Noise dominated (detector-on time) | Marked lightcurve |
|---|---|---|---|---|---|---|---|
| A | 7234 | 6935 | 0 | 0 | 0.00% | 0.00% | 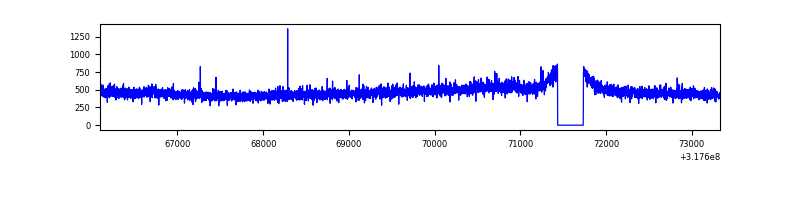 |
| B | 7235 | 6936 | 11 | 11 | 0.15% | 0.16% | 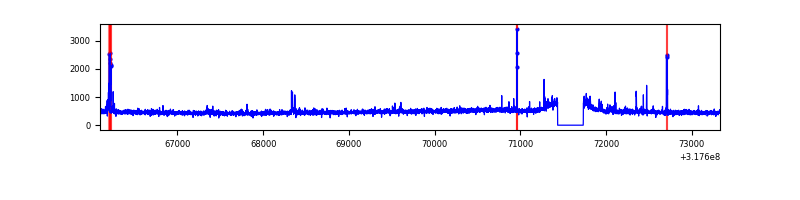 |
| C | 7235 | 6936 | 0 | 0 | 0.00% | 0.00% | 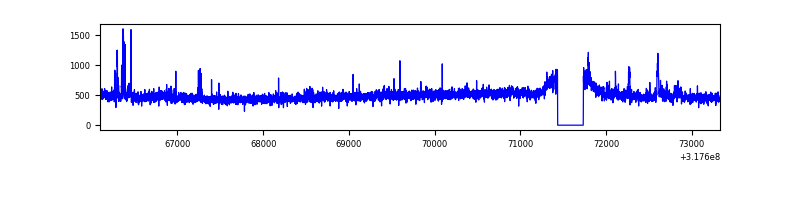 |
| D | 7235 | 6936 | 73 | 73 | 1.01% | 1.05% | 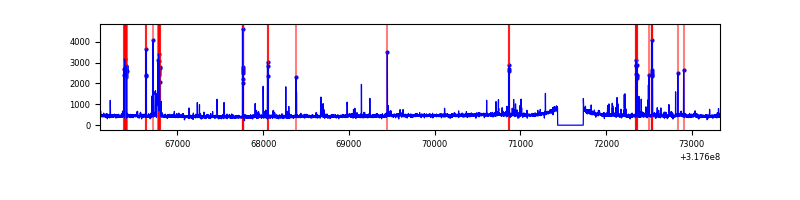 |
Top three noisy pixels from each quadrant. If the there are fewer than three noisy pixels in the level2.evt file, extra rows are filled as -1
| Pixel properties | Quadrant properties | ||||||
|---|---|---|---|---|---|---|---|
| Quadrant | DetID | PixID | Counts | Sigma | Mean | Median | Sigma |
| A | 13 | 254 | 9603 | 51.92 | 838 | 821 | 169.1 |
| A | 3 | 137 | 7411 | 38.96 | 838 | 821 | 169.1 |
| A | 0 | 226 | 7182 | 37.61 | 838 | 821 | 169.1 |
| B | 0 | 189 | 91594 | 568.31 | 833 | 812 | 159.7 |
| B | 0 | 229 | 19877 | 119.35 | 833 | 812 | 159.7 |
| B | 12 | 111 | 19223 | 115.26 | 833 | 812 | 159.7 |
| C | 10 | 9 | 180408 | 942.73 | 806 | 810 | 190.5 |
| C | 14 | 238 | 124082 | 647.07 | 806 | 810 | 190.5 |
| C | 0 | 207 | 5952 | 26.99 | 806 | 810 | 190.5 |
| D | 1 | 52 | 365133 | 1816.99 | 817 | 795 | 200.5 |
| D | 2 | 234 | 31472 | 152.99 | 817 | 795 | 200.5 |
| D | 2 | 120 | 29477 | 143.04 | 817 | 795 | 200.5 |
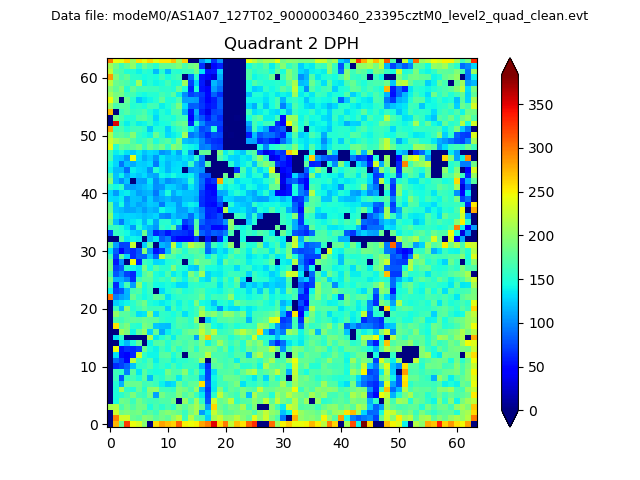
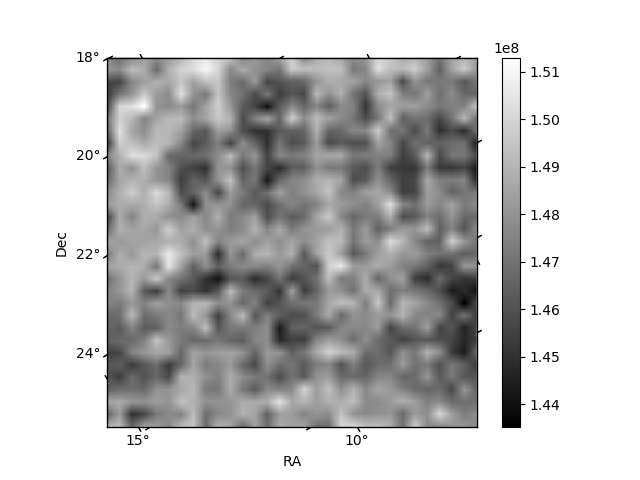
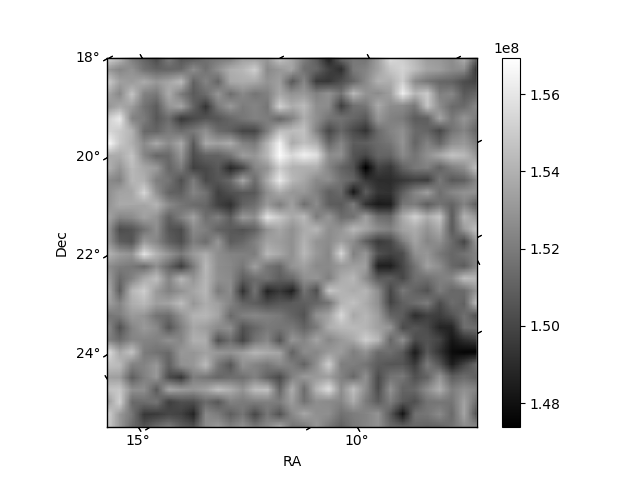
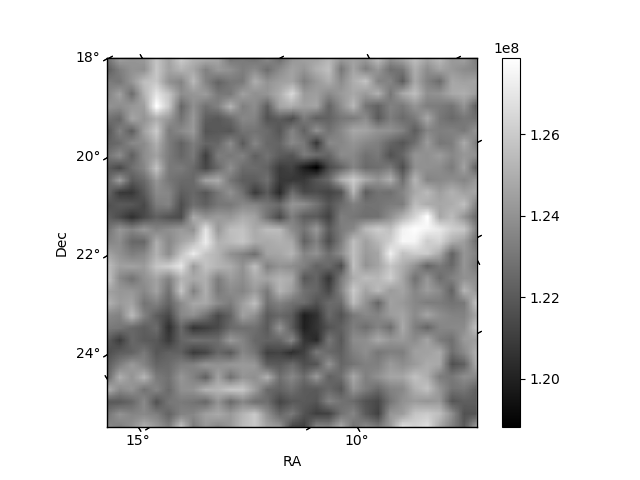
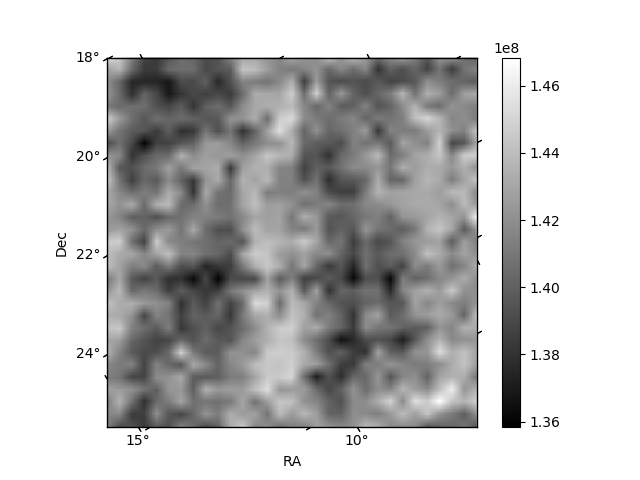
Histogram calculated using DETX and DETY for each event in the final _common_clean file
| Quadrant A | 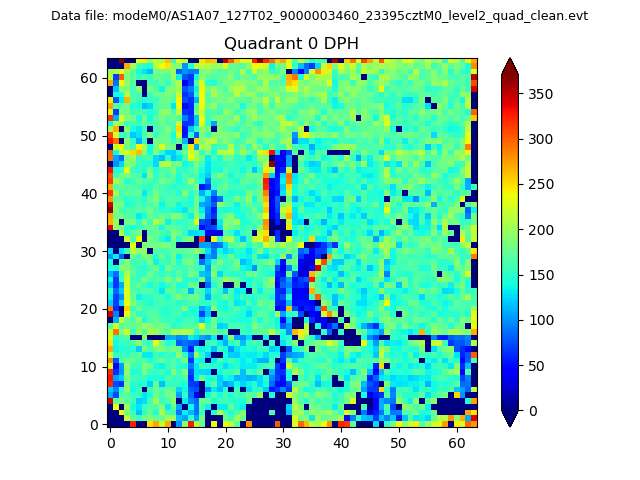 |
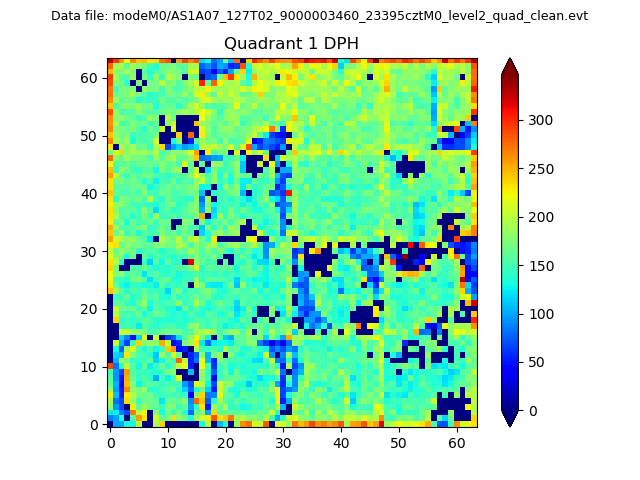 |
Quadrant B |
|---|---|---|---|
| Quadrant D | 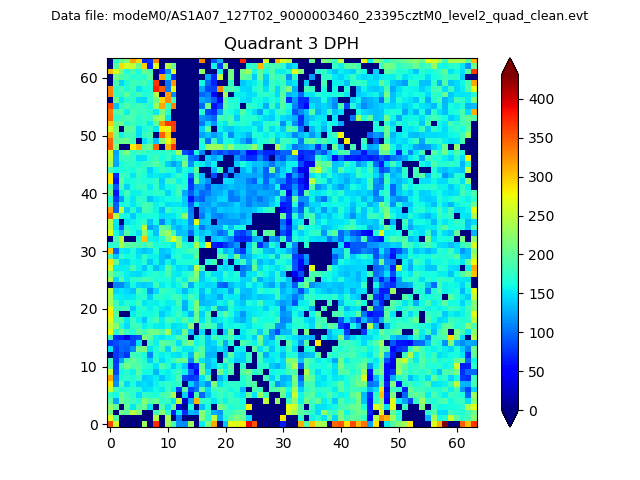 |
 |
Quadrant C |
| Plot type | Count rate plots | Images |
|---|---|---|
| Comparison with Poisson distribution Blue bars denote a histogram of data divided into 1 sec bins. Red curve is a Poisson curve with rate = median count rate of data. |
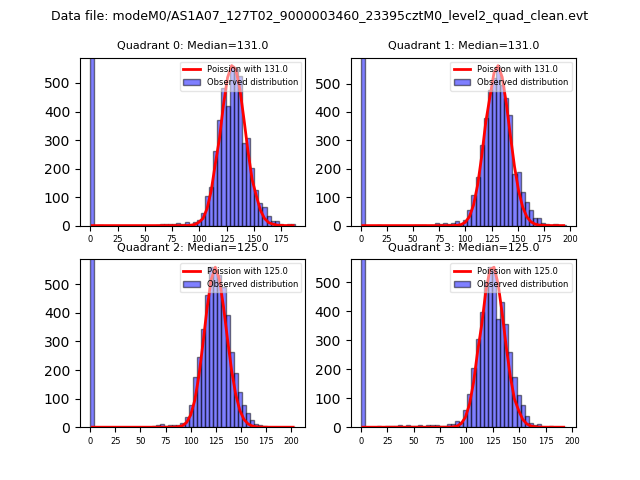 |
 |
| Quadrant-wise count rates Data is divided into 100 sec bins |
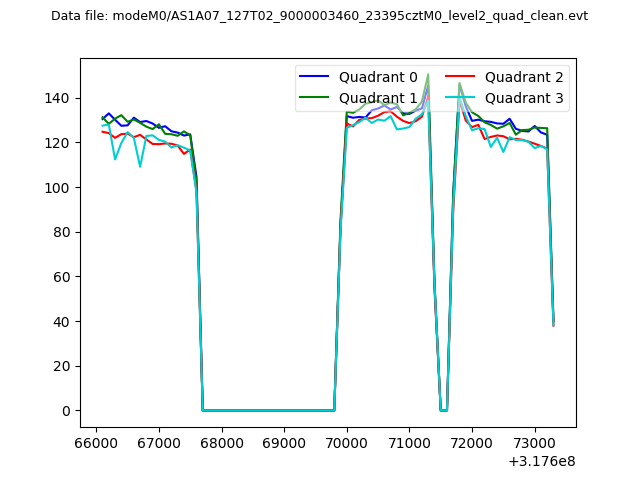 |
|
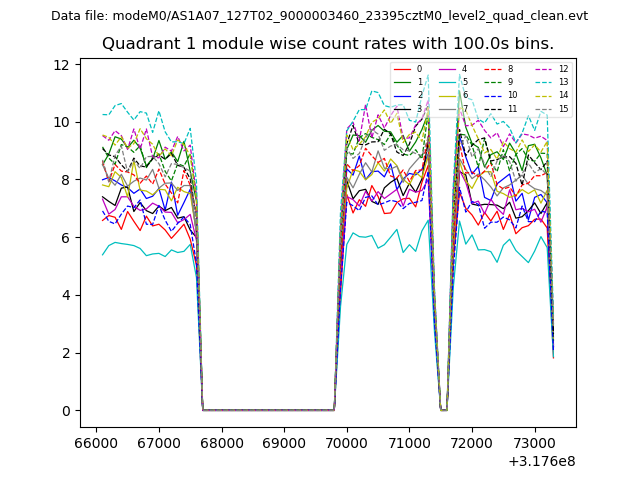
| Module-wise count rates for Quadrant A Data is divided into 100 sec bins |
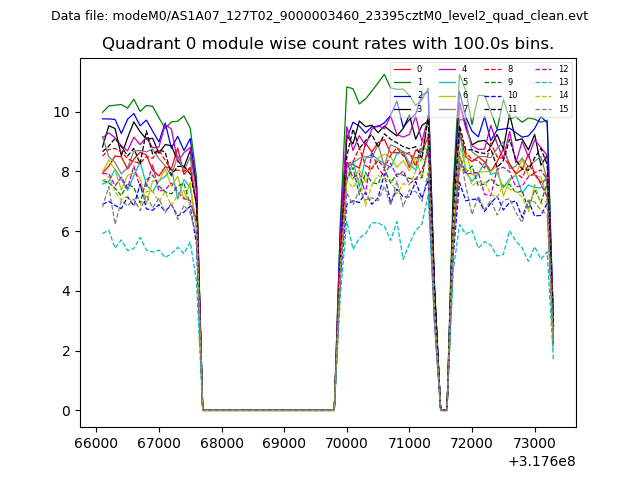 |
 |
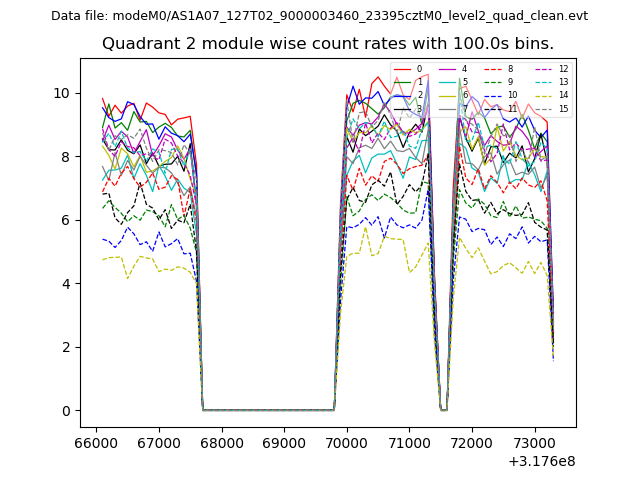
| Module-wise count rates for Quadrant B Data is divided into 100 sec bins |
 |
 |
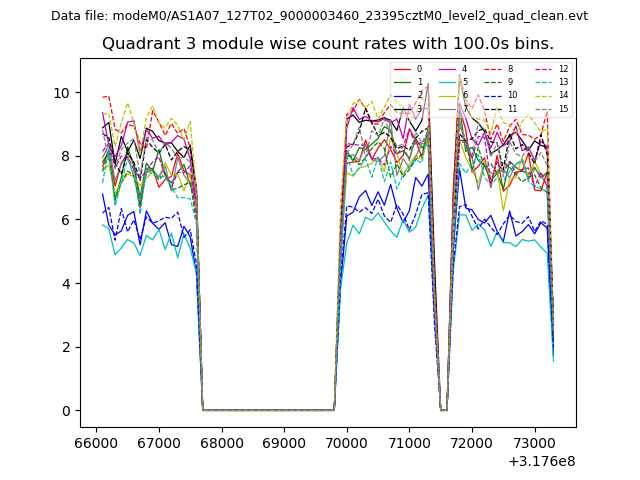
| Module-wise count rates for Quadrant C Data is divided into 100 sec bins |
 |
 |
| Module-wise count rates for Quadrant D Data is divided into 100 sec bins |
 |
 |
| Parameter | Plot |
|---|---|
| CZT HV Monitor | 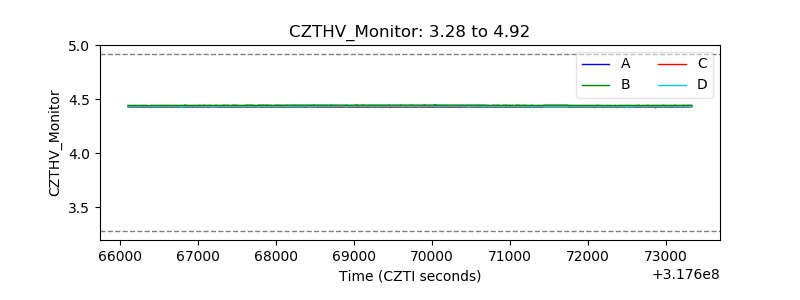 |
| D_VDD | 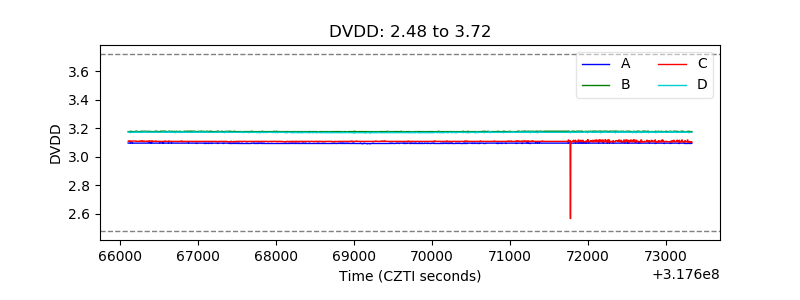 |
| Temperature 1 | 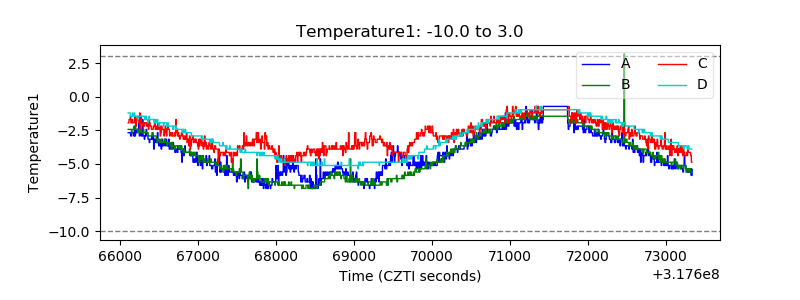 |
| Veto HV Monitor | 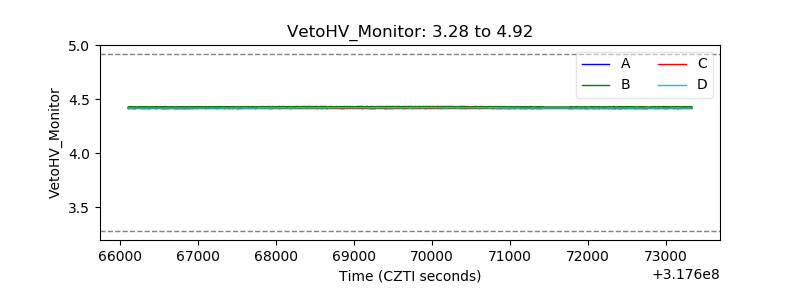 |
| Veto LLD | 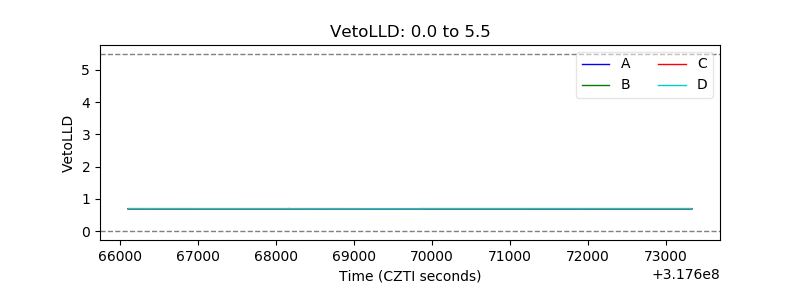 |
| Alpha Counter | 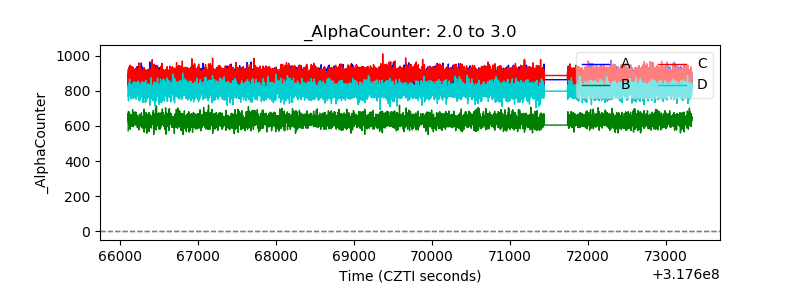 |
| _CPM_Rate | 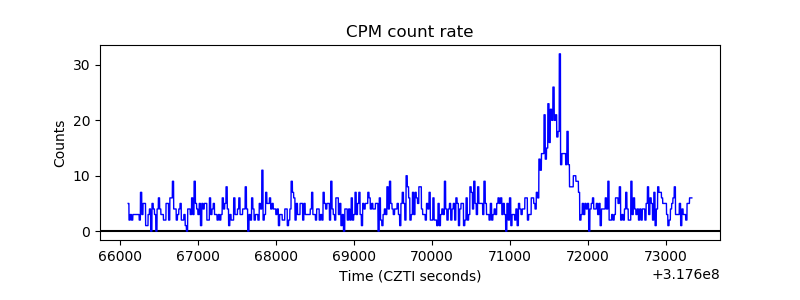 |
| CZT Counter |  |
| +2.5 Volts monitor | 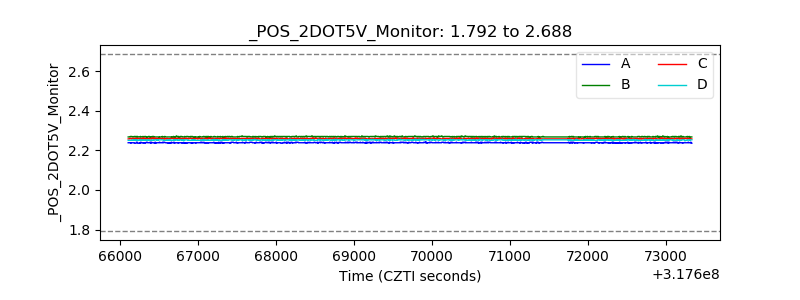 |
| +5 Volts monitor |  |
| _ROLL_ROT | 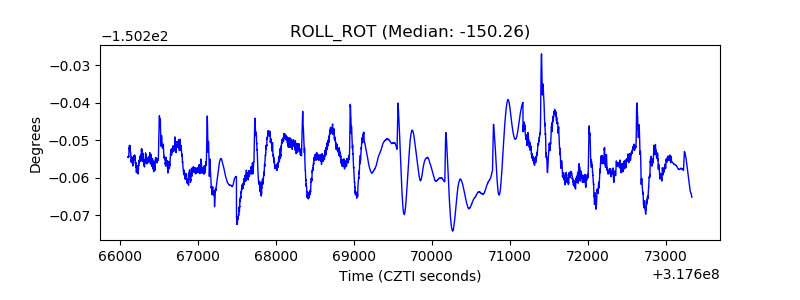 |
| _Roll_DEC | 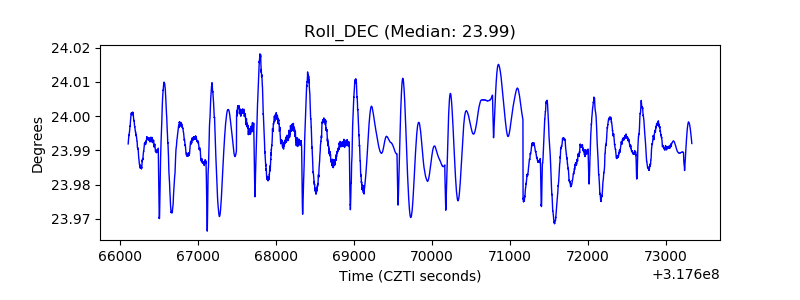 |
| _Roll_RA |  |
| Veto Counter | 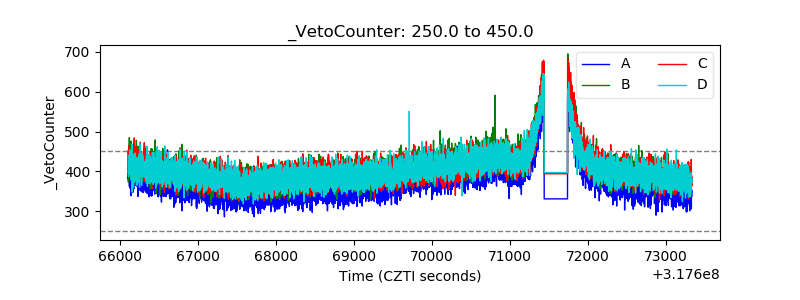 |