| Param | Original file | Final file |
|---|---|---|
| Filename | modeM0/AS1A07_127T02_9000003460_23396cztM0_level2.evt | modeM0/AS1A07_127T02_9000003460_23396cztM0_level2_quad_clean.evt |
| Size (bytes) | 590,472,000 | 101,759,040 |
| Size | 563.1 MB | 97.0 MB |
| Events in quadrant A | 3,589,888 | 658,842 |
| Events in quadrant B | 3,891,250 | 654,658 |
| Events in quadrant C | 3,801,799 | 635,134 |
| Events in quadrant D | 6,077,819 | 597,932 |
| Mode M9 | |||
|---|---|---|---|
| Quadrant | BADHDUFLAG | Total packets | Discarded packets |
| A | 0 | 2 | 0 |
| B | 0 | 2 | 0 |
| C | 0 | 2 | 0 |
| D | 0 | 2 | 0 |
| Mode M0 | |||
|---|---|---|---|
| Quadrant | BADHDUFLAG | Total packets | Discarded packets |
| A | 0 | 15749 | 2 |
| B | 0 | 16527 | 2 |
| C | 0 | 16097 | 2 |
| D | 0 | 23241 | 2 |
| Mode SS | |||
|---|---|---|---|
| Quadrant | BADHDUFLAG | Total packets | Discarded packets |
| A | 0 | 154 | 0 |
| B | 0 | 156 | 0 |
| C | 0 | 156 | 0 |
| D | 0 | 156 | 0 |
| Quadrant | Total seconds | Saturated seconds | Saturation percentage |
|---|---|---|---|
| A | 7689 | 88 | 1.144492% |
| B | 7690 | 191 | 2.483745% |
| C | 7690 | 144 | 1.872562% |
| D | 7690 | 906 | 11.781534% |
Noise dominated data is calculated using 1-second bins in cleaned event files. If a bin has >2000 counts, and if more than 50% of those come from <1% of pixels, then it is considered to be noise-dominated and hence unusable.
| Quadrant | # 1 sec bins | Bins with >0 counts | Bins with >2000 counts | High rate bins dominated by noise | Noise dominated (total time) | Noise dominated (detector-on time) | Marked lightcurve |
|---|---|---|---|---|---|---|---|
| A | 7864 | 7691 | 0 | 0 | 0.00% | 0.00% | 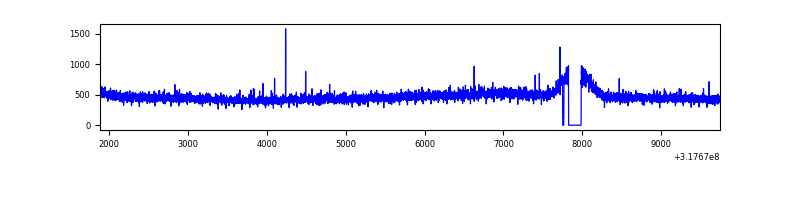 |
| B | 7865 | 7691 | 49 | 49 | 0.62% | 0.64% | 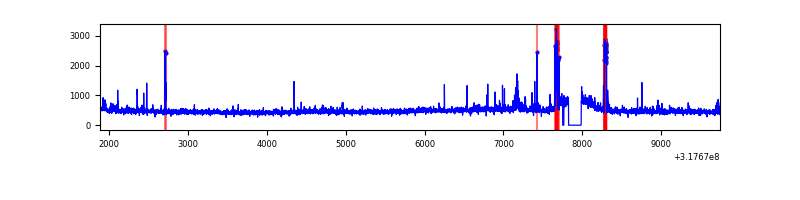 |
| C | 7865 | 7692 | 2 | 2 | 0.03% | 0.03% | 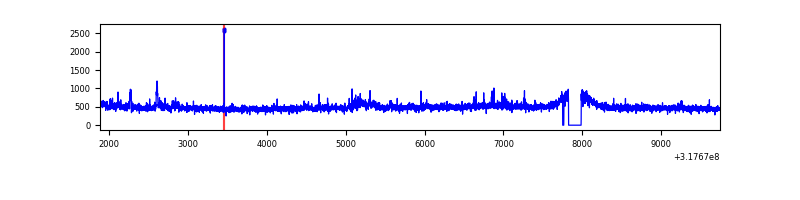 |
| D | 7865 | 7692 | 812 | 812 | 10.32% | 10.56% | 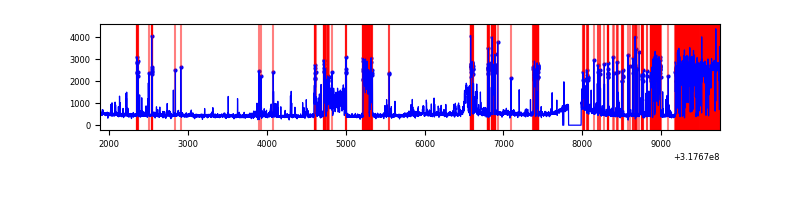 |
Top three noisy pixels from each quadrant. If the there are fewer than three noisy pixels in the level2.evt file, extra rows are filled as -1
| Pixel properties | Quadrant properties | ||||||
|---|---|---|---|---|---|---|---|
| Quadrant | DetID | PixID | Counts | Sigma | Mean | Median | Sigma |
| A | 13 | 254 | 12154 | 59.28 | 930 | 907 | 189.7 |
| A | 3 | 137 | 8254 | 38.73 | 930 | 907 | 189.7 |
| A | 0 | 226 | 8098 | 37.9 | 930 | 907 | 189.7 |
| B | 0 | 189 | 126227 | 709.01 | 919 | 896 | 176.8 |
| B | 5 | 172 | 115894 | 650.55 | 919 | 896 | 176.8 |
| B | 12 | 111 | 21377 | 115.86 | 919 | 896 | 176.8 |
| C | 10 | 9 | 138427 | 657.07 | 893 | 897 | 209.3 |
| C | 14 | 238 | 138337 | 656.64 | 893 | 897 | 209.3 |
| C | 0 | 207 | 13617 | 60.77 | 893 | 897 | 209.3 |
| D | 1 | 52 | 2729186 | 12832.38 | 868 | 844 | 212.6 |
| D | 2 | 234 | 33943 | 155.68 | 868 | 844 | 212.6 |
| D | 2 | 120 | 28276 | 129.02 | 868 | 844 | 212.6 |
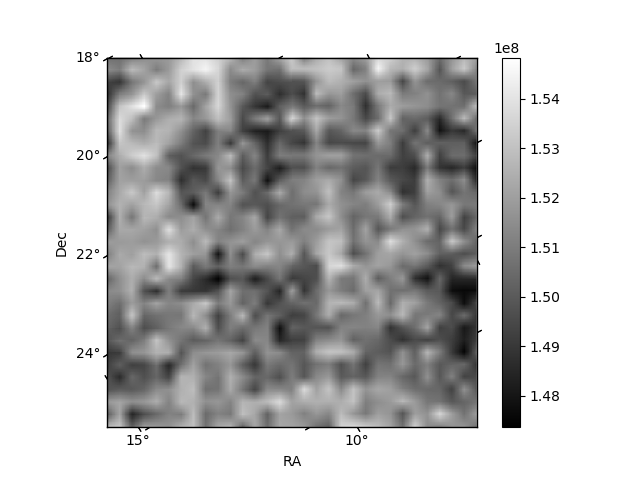
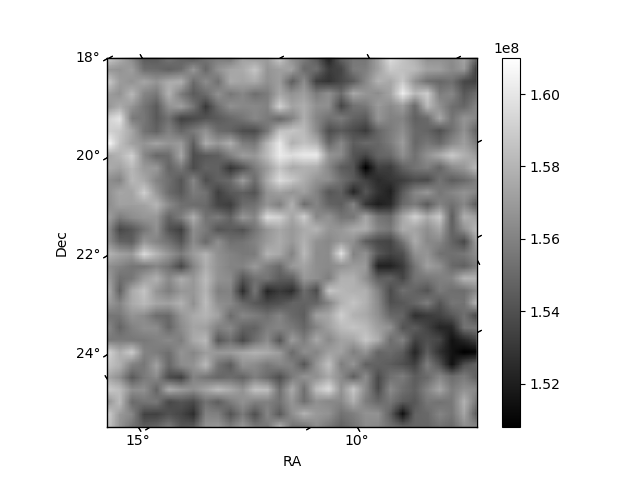
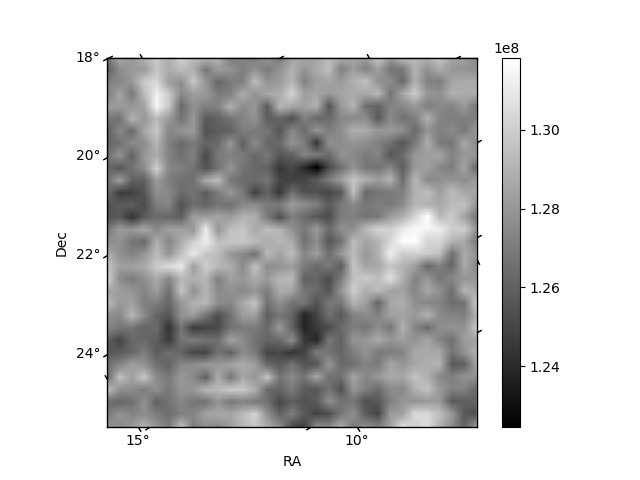
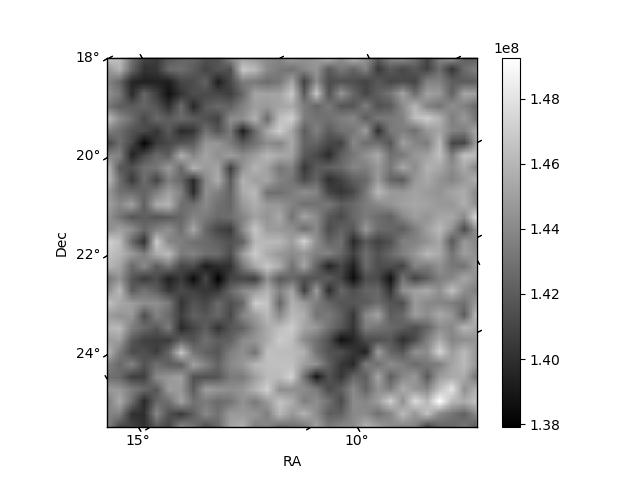
Histogram calculated using DETX and DETY for each event in the final _common_clean file
| Quadrant A | 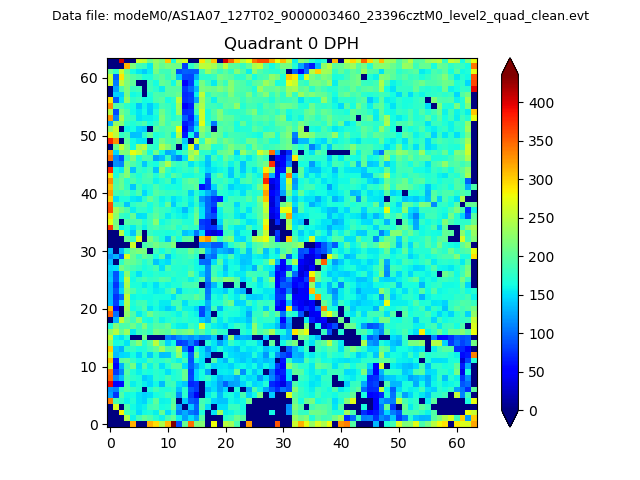 |
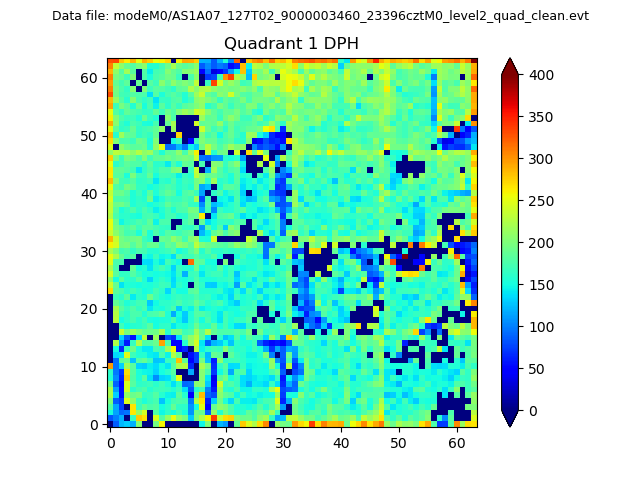 |
Quadrant B |
|---|---|---|---|
| Quadrant D | 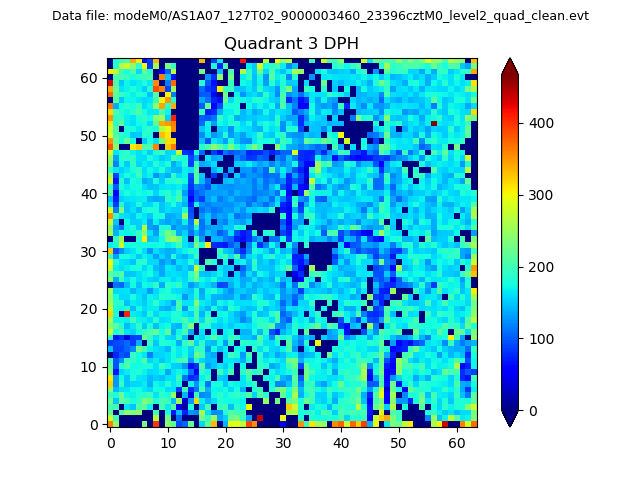 |
 |
Quadrant C |
| Plot type | Count rate plots | Images |
|---|---|---|
| Comparison with Poisson distribution Blue bars denote a histogram of data divided into 1 sec bins. Red curve is a Poisson curve with rate = median count rate of data. |
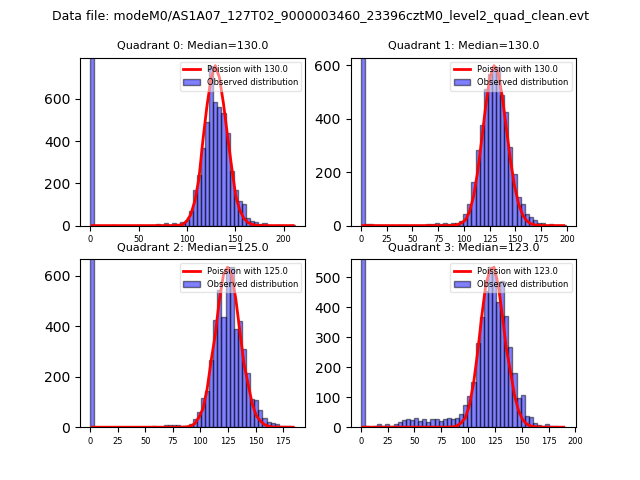 |
 |
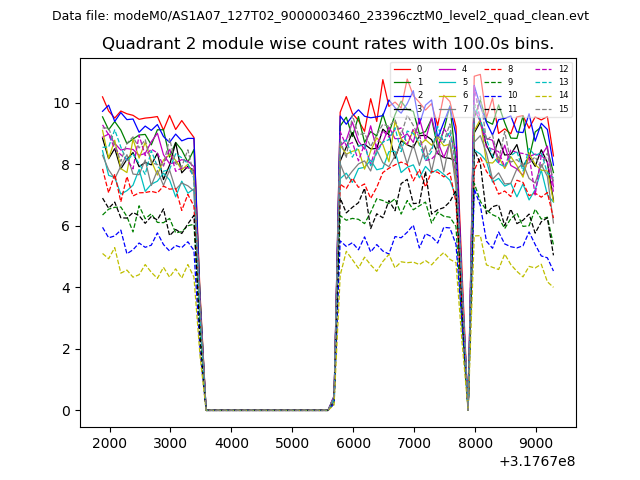
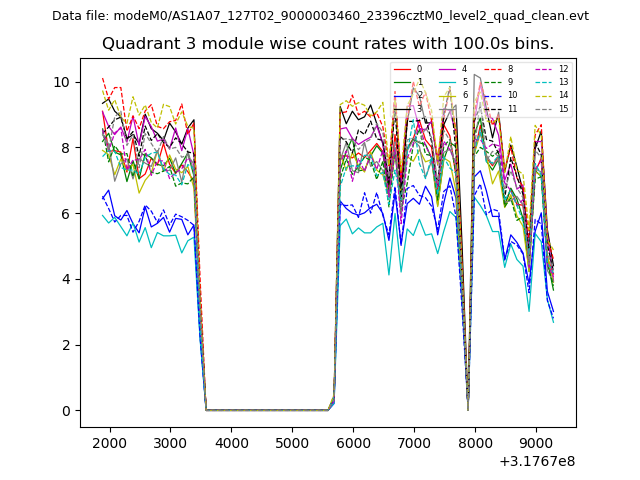
| Quadrant-wise count rates Data is divided into 100 sec bins |
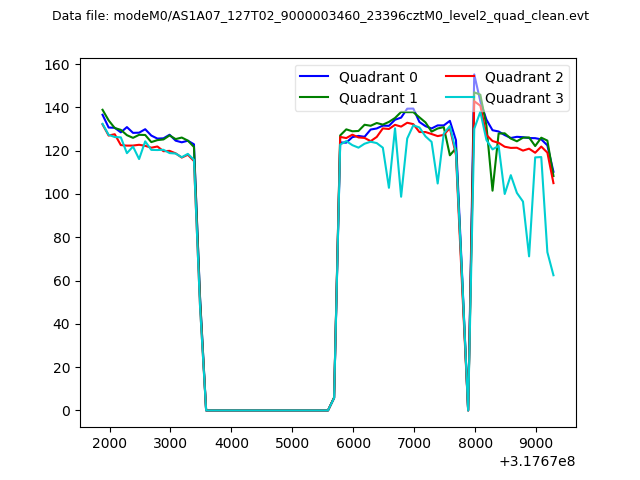 |
|
| Module-wise count rates for Quadrant A Data is divided into 100 sec bins |
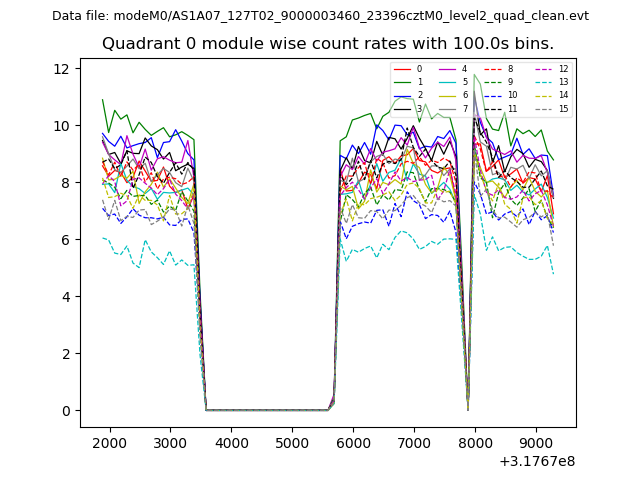 |
 |
| Module-wise count rates for Quadrant B Data is divided into 100 sec bins |
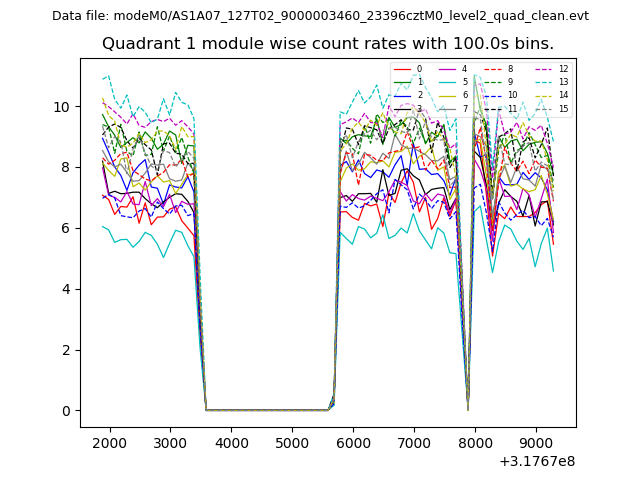 |
 |
| Module-wise count rates for Quadrant C Data is divided into 100 sec bins |
 |
 |
| Module-wise count rates for Quadrant D Data is divided into 100 sec bins |
 |
 |
| Parameter | Plot |
|---|---|
| CZT HV Monitor | 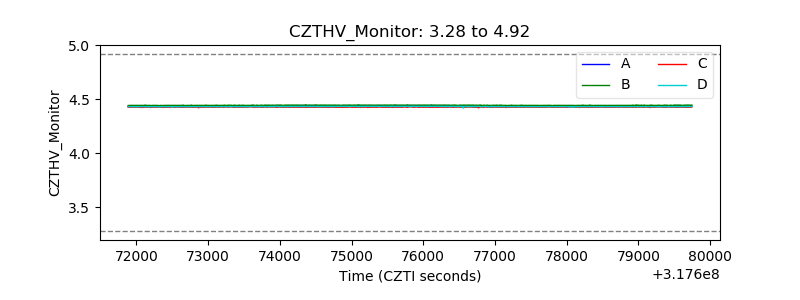 |
| D_VDD | 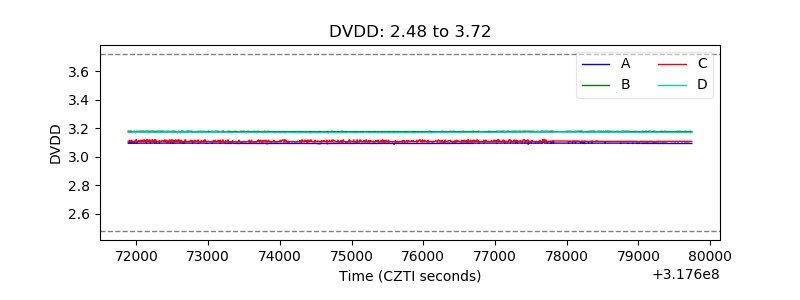 |
| Temperature 1 | 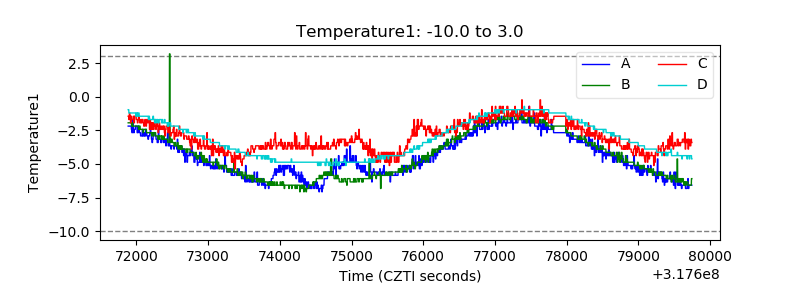 |
| Veto HV Monitor | 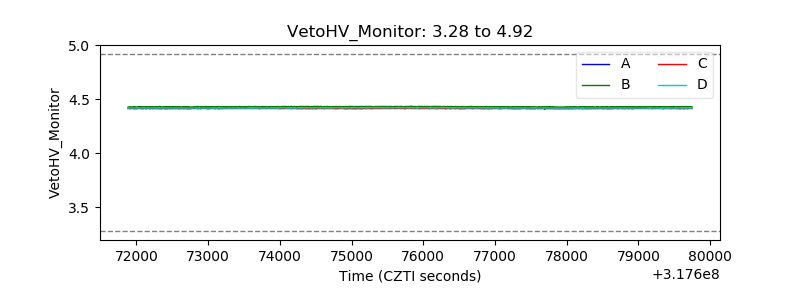 |
| Veto LLD | 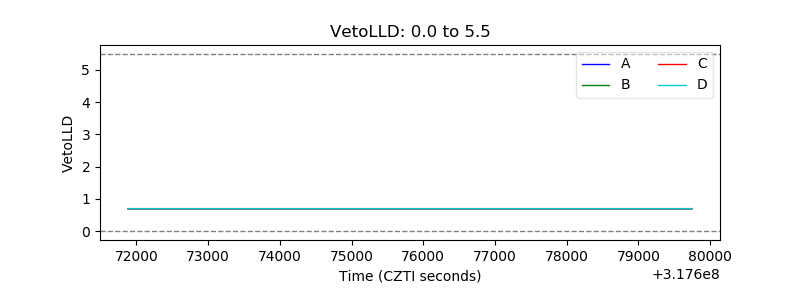 |
| Alpha Counter | 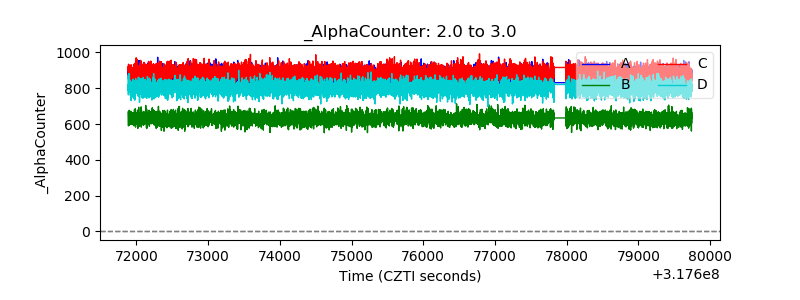 |
| _CPM_Rate | 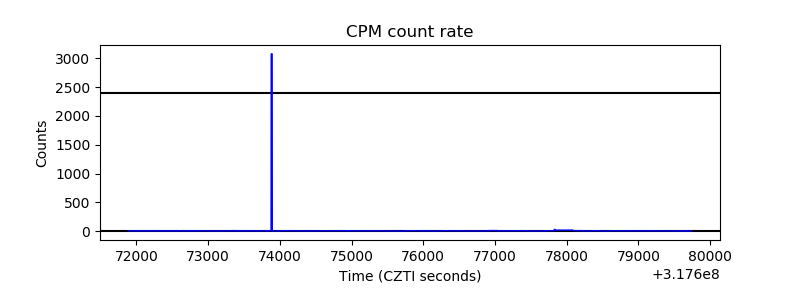 |
| CZT Counter |  |
| +2.5 Volts monitor |  |
| +5 Volts monitor |  |
| _ROLL_ROT |  |
| _Roll_DEC | 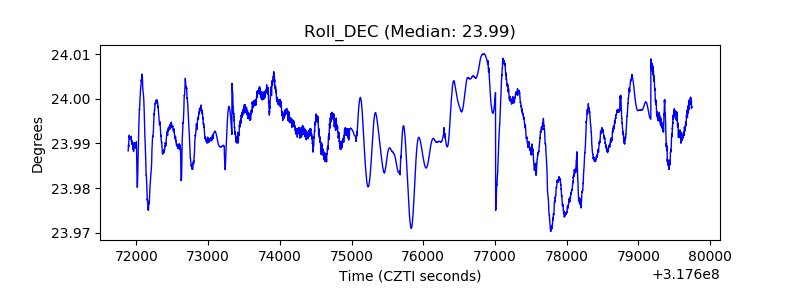 |
| _Roll_RA |  |
| Veto Counter | 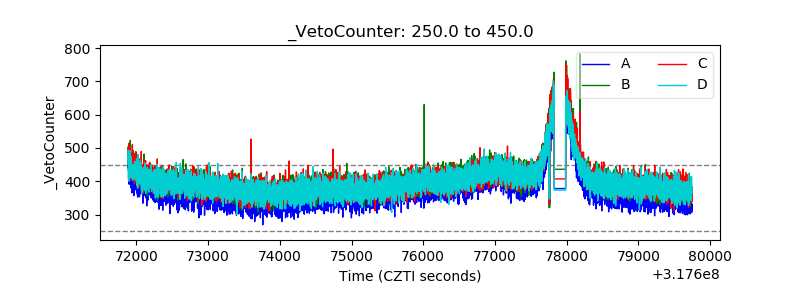 |