| Param | Original file | Final file |
|---|---|---|
| Filename | modeM0/AS1A07_127T02_9000003460_23397cztM0_level2.evt | modeM0/AS1A07_127T02_9000003460_23397cztM0_level2_quad_clean.evt |
| Size (bytes) | 752,526,720 | 76,492,800 |
| Size | 717.7 MB | 72.9 MB |
| Events in quadrant A | 3,222,645 | 511,619 |
| Events in quadrant B | 3,329,676 | 516,177 |
| Events in quadrant C | 3,427,901 | 494,884 |
| Events in quadrant D | 12,337,872 | 306,518 |
| Mode M9 | |||
|---|---|---|---|
| Quadrant | BADHDUFLAG | Total packets | Discarded packets |
| A | 0 | 5 | 0 |
| B | 0 | 5 | 0 |
| C | 0 | 5 | 0 |
| D | 0 | 5 | 0 |
| Mode M0 | |||
|---|---|---|---|
| Quadrant | BADHDUFLAG | Total packets | Discarded packets |
| A | 0 | 14193 | 1 |
| B | 0 | 14340 | 1 |
| C | 0 | 14616 | 1 |
| D | 0 | 41396 | 1 |
| Mode SS | |||
|---|---|---|---|
| Quadrant | BADHDUFLAG | Total packets | Discarded packets |
| A | 0 | 140 | 0 |
| B | 0 | 140 | 0 |
| C | 0 | 140 | 0 |
| D | 0 | 140 | 0 |
| Quadrant | Total seconds | Saturated seconds | Saturation percentage |
|---|---|---|---|
| A | 6979 | 28 | 0.401204% |
| B | 6980 | 38 | 0.544413% |
| C | 6980 | 61 | 0.873926% |
| D | 6979 | 3660 | 52.443043% |
Noise dominated data is calculated using 1-second bins in cleaned event files. If a bin has >2000 counts, and if more than 50% of those come from <1% of pixels, then it is considered to be noise-dominated and hence unusable.
| Quadrant | # 1 sec bins | Bins with >0 counts | Bins with >2000 counts | High rate bins dominated by noise | Noise dominated (total time) | Noise dominated (detector-on time) | Marked lightcurve |
|---|---|---|---|---|---|---|---|
| A | 7429 | 6980 | 2 | 2 | 0.03% | 0.03% | 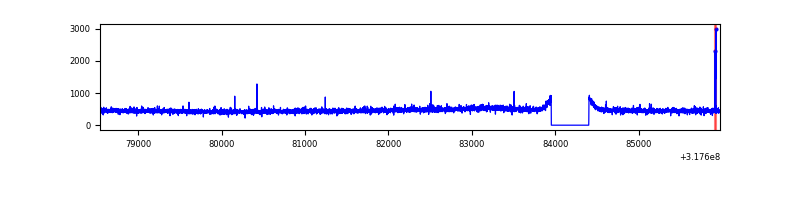 |
| B | 7430 | 6981 | 2 | 2 | 0.03% | 0.03% | 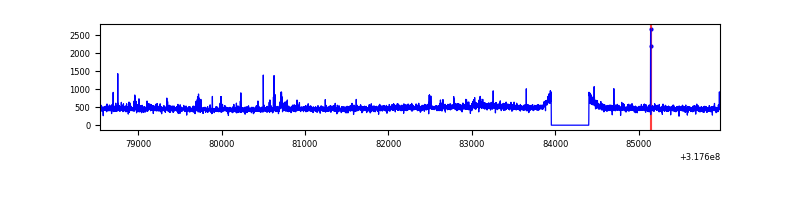 |
| C | 7430 | 6981 | 4 | 4 | 0.05% | 0.06% | 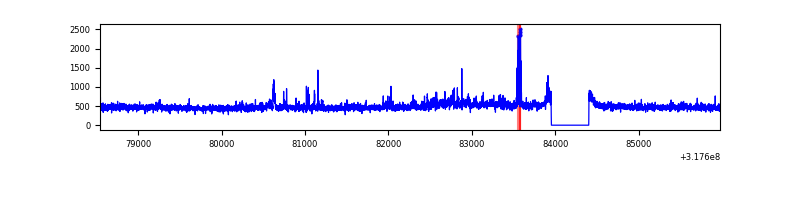 |
| D | 7428 | 6978 | 3559 | 3559 | 47.91% | 51.00% | 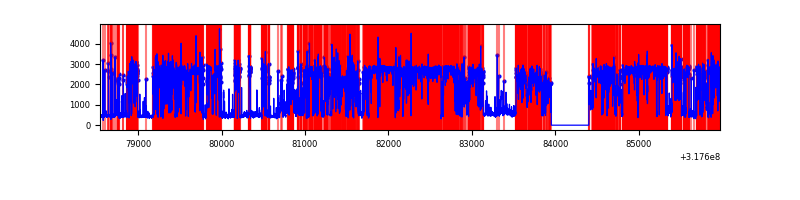 |
Top three noisy pixels from each quadrant. If the there are fewer than three noisy pixels in the level2.evt file, extra rows are filled as -1
| Pixel properties | Quadrant properties | ||||||
|---|---|---|---|---|---|---|---|
| Quadrant | DetID | PixID | Counts | Sigma | Mean | Median | Sigma |
| A | 13 | 254 | 11412 | 62.67 | 832 | 811 | 169.2 |
| A | 6 | 16 | 10962 | 60.01 | 832 | 811 | 169.2 |
| A | 3 | 137 | 7516 | 39.64 | 832 | 811 | 169.2 |
| B | 0 | 189 | 34221 | 206.74 | 831 | 809 | 161.6 |
| B | 12 | 111 | 19846 | 117.79 | 831 | 809 | 161.6 |
| B | 11 | 111 | 17430 | 102.84 | 831 | 809 | 161.6 |
| C | 10 | 9 | 158966 | 835.92 | 802 | 807 | 189.2 |
| C | 14 | 238 | 125535 | 659.23 | 802 | 807 | 189.2 |
| C | 8 | 208 | 5935 | 27.1 | 802 | 807 | 189.2 |
| D | 1 | 52 | 10095936 | 70481.67 | 585 | 569 | 143.2 |
| D | 2 | 234 | 23037 | 156.86 | 585 | 569 | 143.2 |
| D | 7 | 55 | 10303 | 67.96 | 585 | 569 | 143.2 |
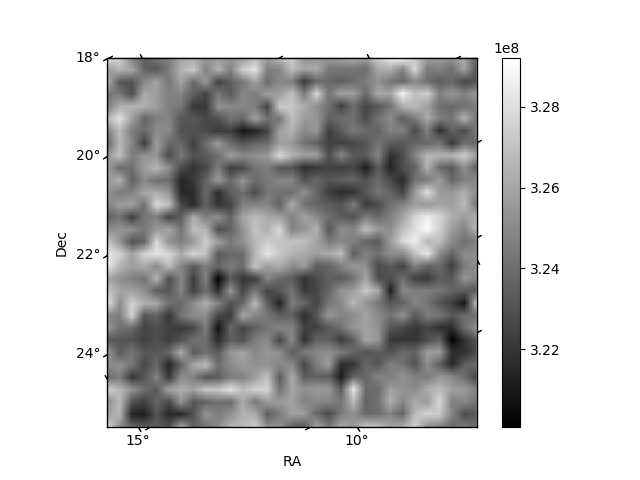
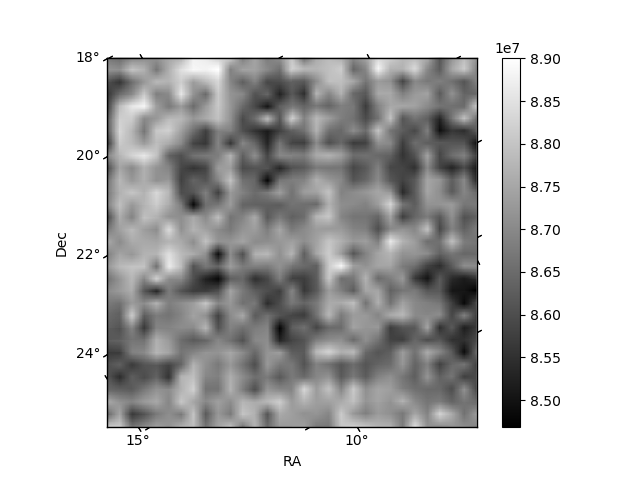
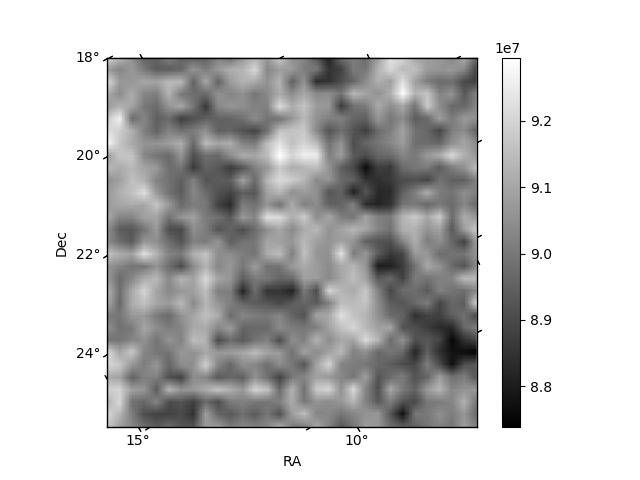
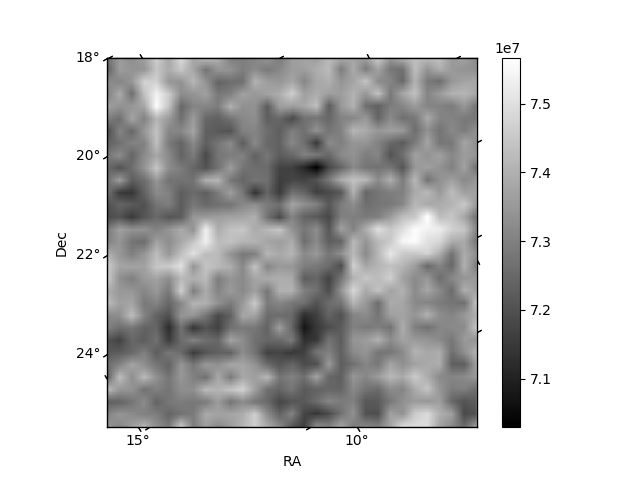
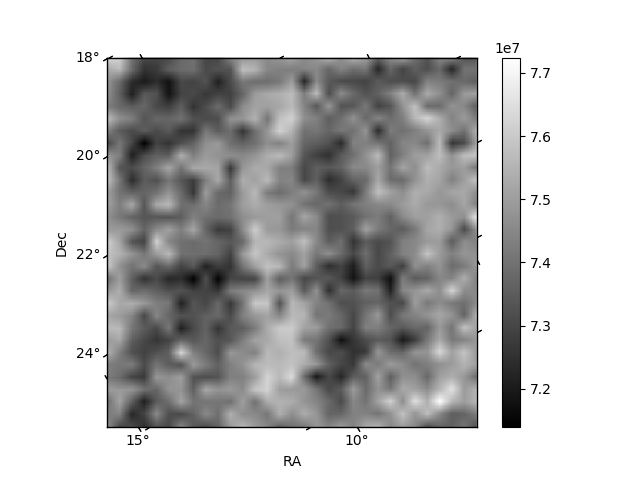
Histogram calculated using DETX and DETY for each event in the final _common_clean file
| Quadrant A |  |
 |
Quadrant B |
|---|---|---|---|
| Quadrant D |  |
 |
Quadrant C |
| Plot type | Count rate plots | Images |
|---|---|---|
| Comparison with Poisson distribution Blue bars denote a histogram of data divided into 1 sec bins. Red curve is a Poisson curve with rate = median count rate of data. |
 |
 |
| Quadrant-wise count rates Data is divided into 100 sec bins |
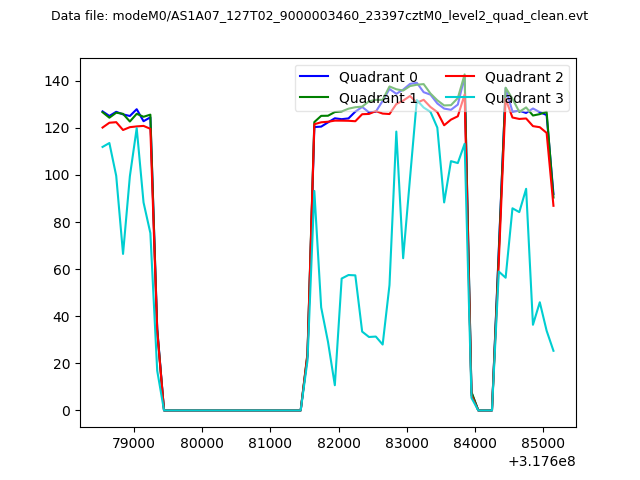 |
|
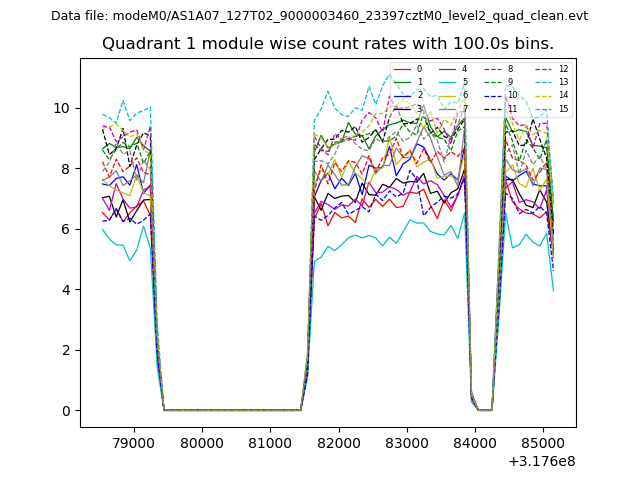
| Module-wise count rates for Quadrant A Data is divided into 100 sec bins |
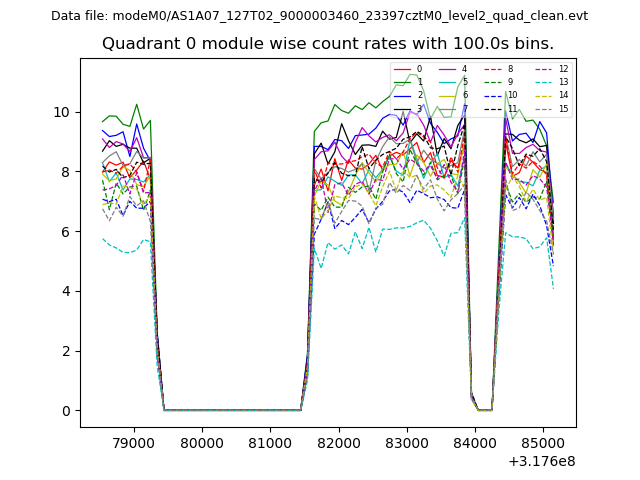 |
 |
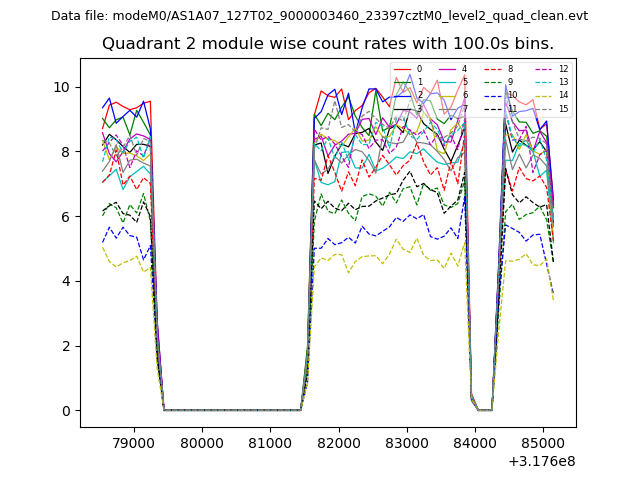
| Module-wise count rates for Quadrant B Data is divided into 100 sec bins |
 |
 |
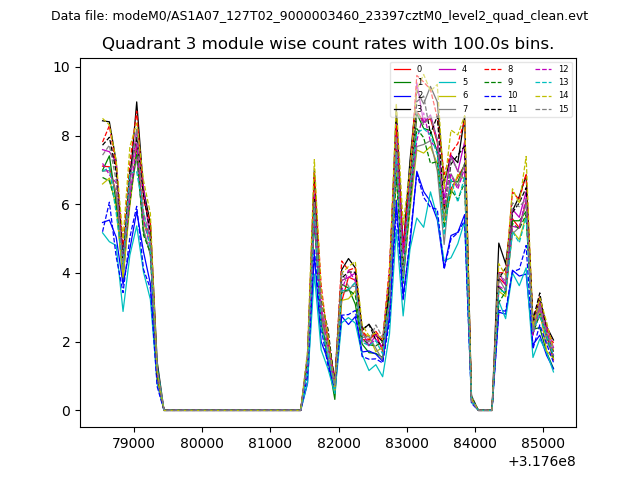
| Module-wise count rates for Quadrant C Data is divided into 100 sec bins |
 |
 |
| Module-wise count rates for Quadrant D Data is divided into 100 sec bins |
 |
 |
| Parameter | Plot |
|---|---|
| CZT HV Monitor | 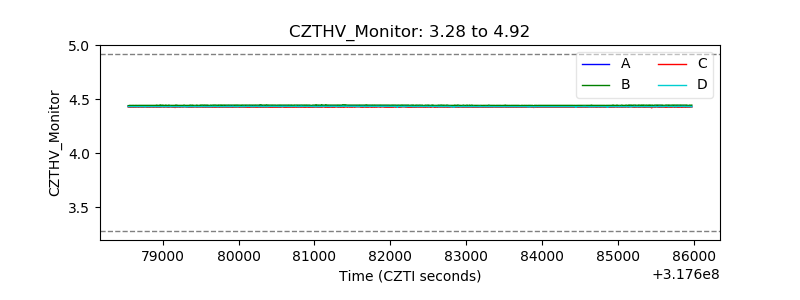 |
| D_VDD | 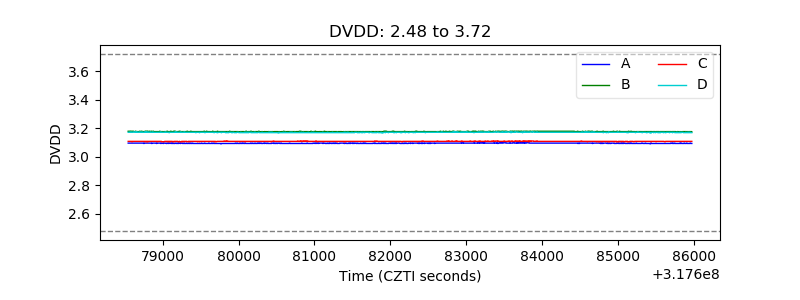 |
| Temperature 1 | 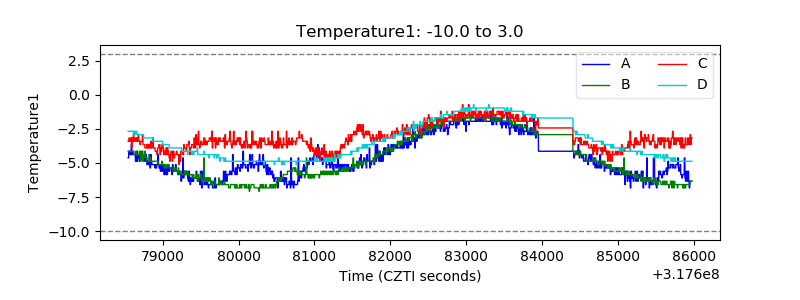 |
| Veto HV Monitor |  |
| Veto LLD | 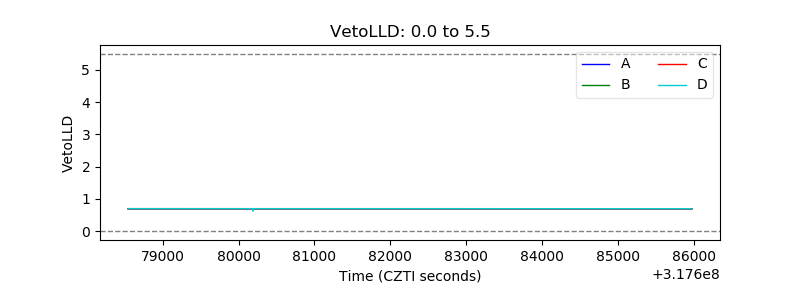 |
| Alpha Counter | 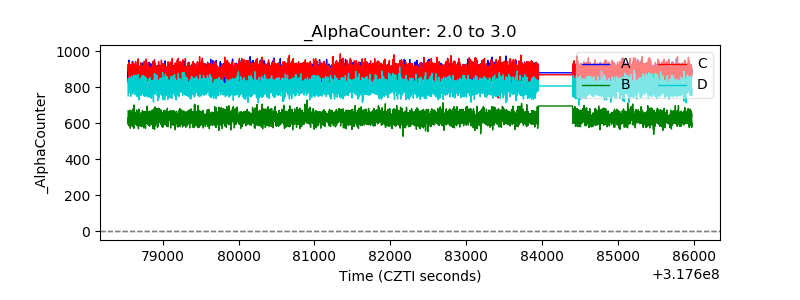 |
| _CPM_Rate | 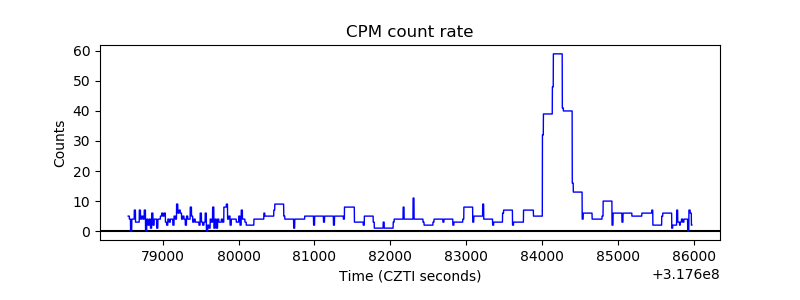 |
| CZT Counter | 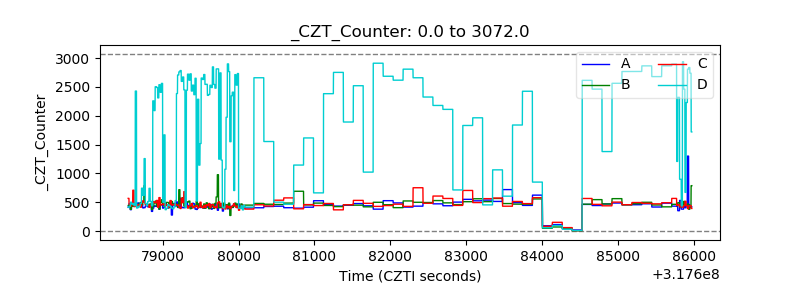 |
| +2.5 Volts monitor |  |
| +5 Volts monitor | 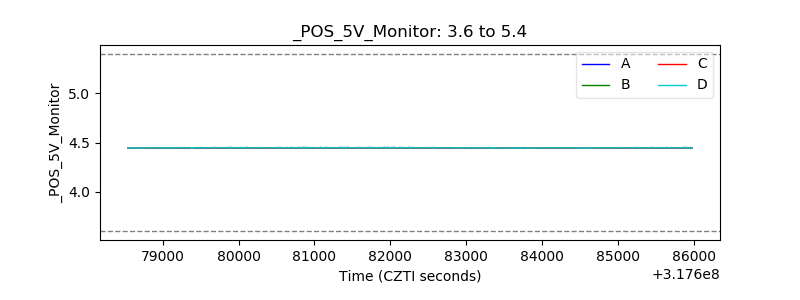 |
| _ROLL_ROT | 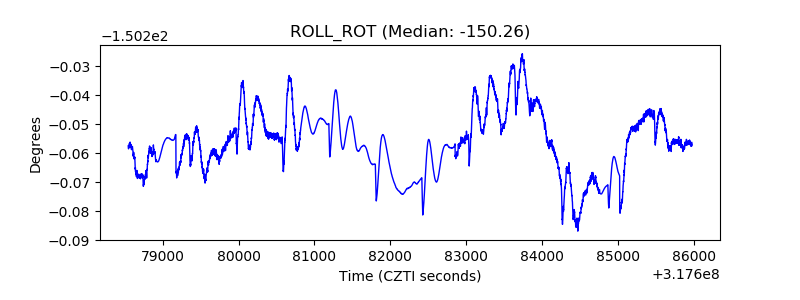 |
| _Roll_DEC |  |
| _Roll_RA | 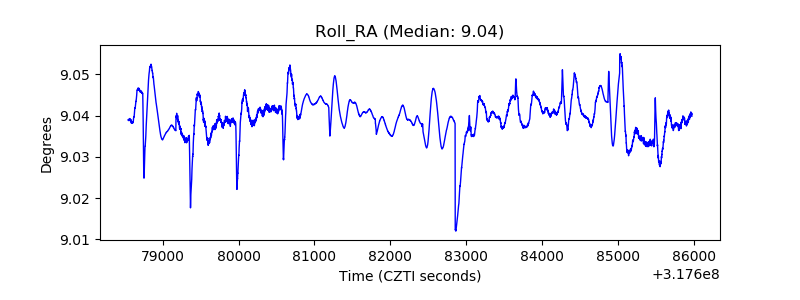 |
| Veto Counter | 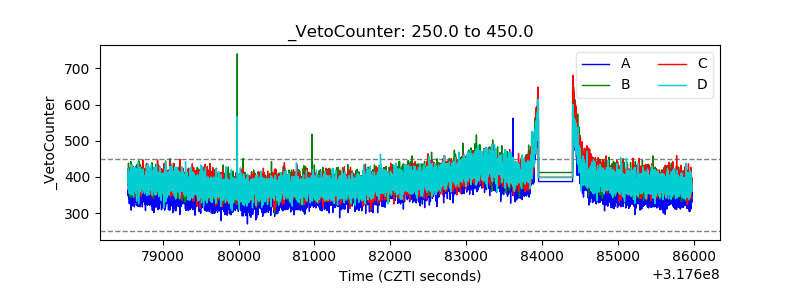 |