| Param | Original file | Final file |
|---|---|---|
| Filename | modeM0/AS1A07_127T02_9000003460_23399cztM0_level2.evt | modeM0/AS1A07_127T02_9000003460_23399cztM0_level2_quad_clean.evt |
| Size (bytes) | 1,587,096,000 | 119,543,040 |
| Size | 1.5 GB | 114.0 MB |
| Events in quadrant A | 6,572,033 | 808,860 |
| Events in quadrant B | 6,067,470 | 820,637 |
| Events in quadrant C | 6,257,017 | 780,547 |
| Events in quadrant D | 28,334,853 | 351,654 |
| Mode M9 | |||
|---|---|---|---|
| Quadrant | BADHDUFLAG | Total packets | Discarded packets |
| A | 0 | 14 | 0 |
| B | 0 | 14 | 0 |
| C | 0 | 14 | 0 |
| D | 0 | 14 | 0 |
| Mode M0 | |||
|---|---|---|---|
| Quadrant | BADHDUFLAG | Total packets | Discarded packets |
| A | 0 | 27543 | 2 |
| B | 0 | 25791 | 2 |
| C | 0 | 26335 | 2 |
| D | 0 | 92641 | 2 |
| Mode SS | |||
|---|---|---|---|
| Quadrant | BADHDUFLAG | Total packets | Discarded packets |
| A | 0 | 252 | 0 |
| B | 0 | 252 | 0 |
| C | 0 | 252 | 0 |
| D | 0 | 252 | 0 |
| Quadrant | Total seconds | Saturated seconds | Saturation percentage |
|---|---|---|---|
| A | 12375 | 81 | 0.654545% |
| B | 12376 | 79 | 0.638332% |
| C | 12376 | 229 | 1.850356% |
| D | 12376 | 9839 | 79.500646% |
Noise dominated data is calculated using 1-second bins in cleaned event files. If a bin has >2000 counts, and if more than 50% of those come from <1% of pixels, then it is considered to be noise-dominated and hence unusable.
| Quadrant | # 1 sec bins | Bins with >0 counts | Bins with >2000 counts | High rate bins dominated by noise | Noise dominated (total time) | Noise dominated (detector-on time) | Marked lightcurve |
|---|---|---|---|---|---|---|---|
| A | 13800 | 12375 | 18 | 18 | 0.13% | 0.15% | 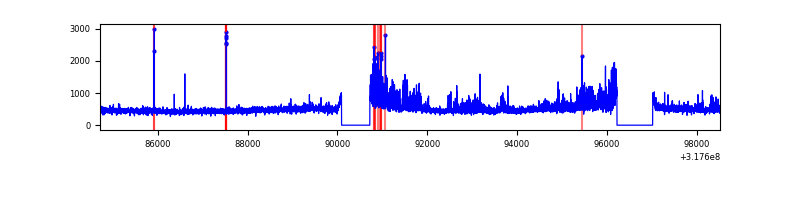 |
| B | 13801 | 12377 | 14 | 14 | 0.10% | 0.11% | 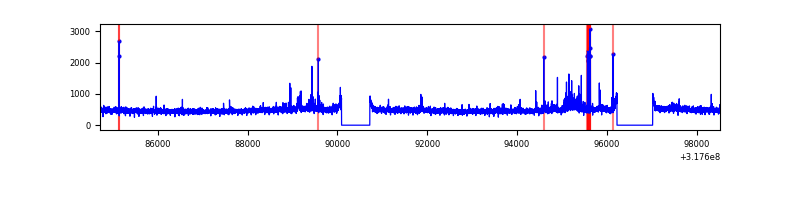 |
| C | 13801 | 12376 | 112 | 112 | 0.81% | 0.90% | 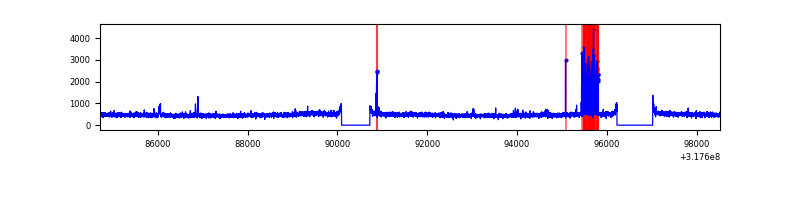 |
| D | 13801 | 12376 | 9711 | 9711 | 70.36% | 78.47% | 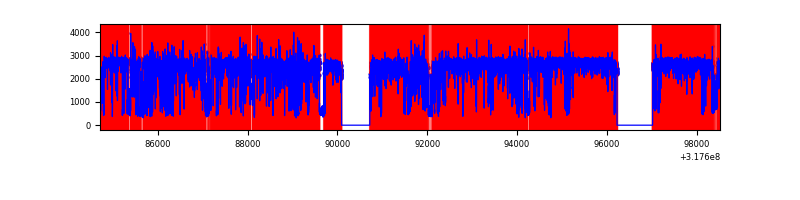 |
Top three noisy pixels from each quadrant. If the there are fewer than three noisy pixels in the level2.evt file, extra rows are filled as -1
| Pixel properties | Quadrant properties | ||||||
|---|---|---|---|---|---|---|---|
| Quadrant | DetID | PixID | Counts | Sigma | Mean | Median | Sigma |
| A | 6 | 16 | 836101 | 2785.91 | 1488 | 1457 | 299.6 |
| A | 13 | 254 | 18896 | 58.21 | 1488 | 1457 | 299.6 |
| A | 3 | 137 | 13304 | 39.54 | 1488 | 1457 | 299.6 |
| B | 0 | 189 | 122009 | 418.69 | 1484 | 1442 | 288.0 |
| B | 0 | 190 | 97912 | 335.01 | 1484 | 1442 | 288.0 |
| B | 0 | 229 | 37475 | 125.13 | 1484 | 1442 | 288.0 |
| C | 10 | 9 | 381067 | 1136.63 | 1425 | 1436 | 334.0 |
| C | 14 | 238 | 224566 | 668.06 | 1425 | 1436 | 334.0 |
| C | 0 | 207 | 52227 | 152.07 | 1425 | 1436 | 334.0 |
| D | 1 | 52 | 25075700 | 122621.69 | 842 | 816 | 204.5 |
| D | 2 | 234 | 28756 | 136.63 | 842 | 816 | 204.5 |
| D | 12 | 227 | 23081 | 108.88 | 842 | 816 | 204.5 |
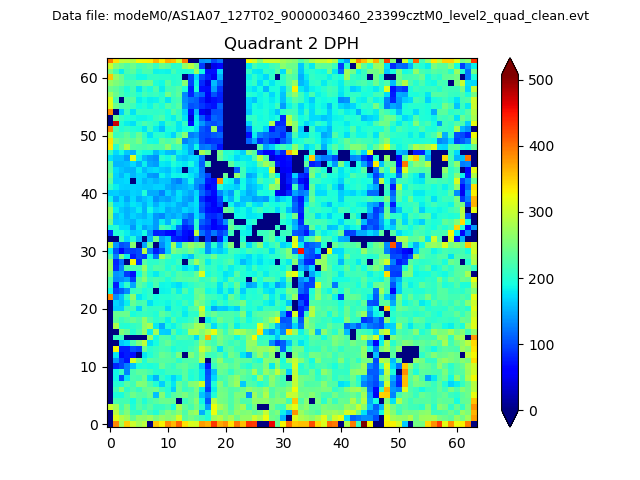
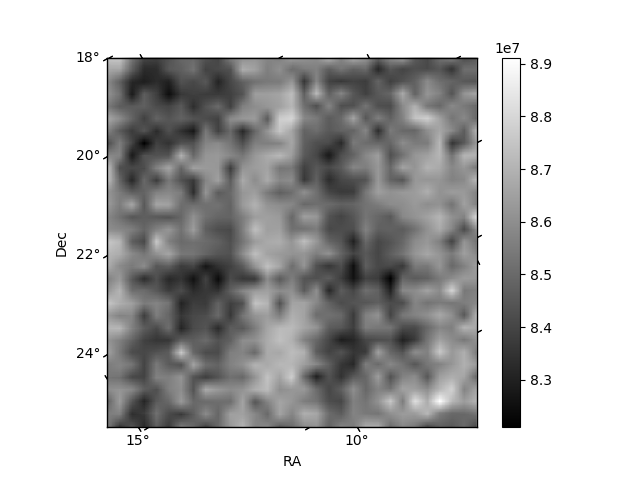
Histogram calculated using DETX and DETY for each event in the final _common_clean file
| Quadrant A | 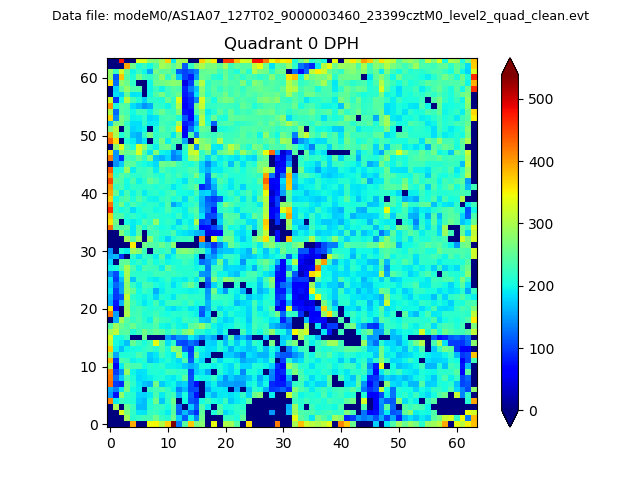 |
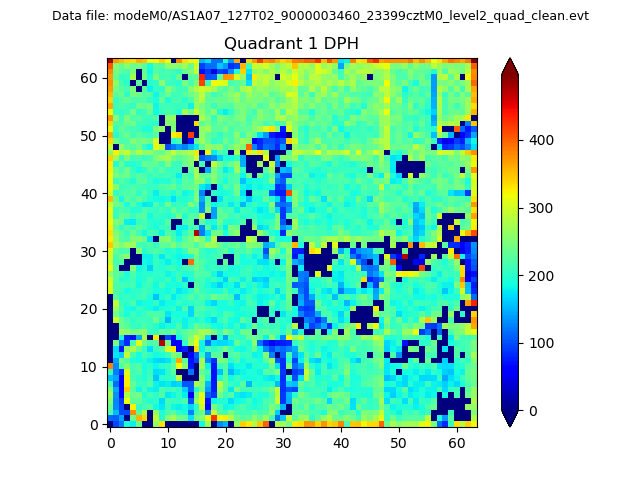 |
Quadrant B |
|---|---|---|---|
| Quadrant D | 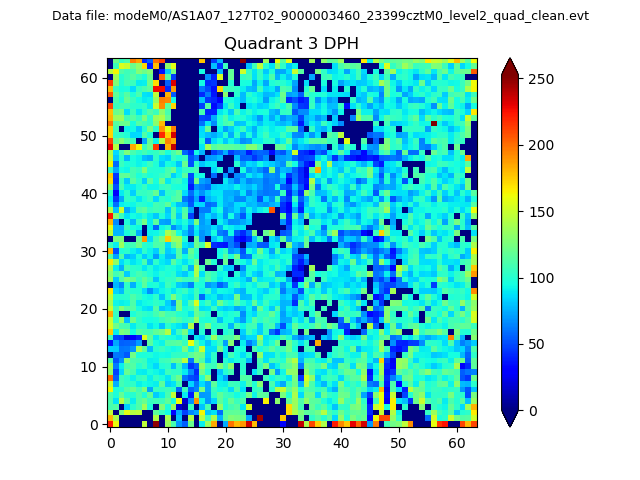 |
 |
Quadrant C |
| Plot type | Count rate plots | Images |
|---|---|---|
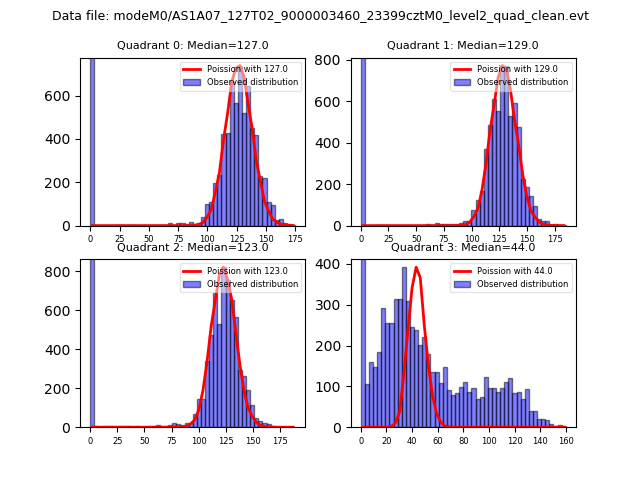
| Comparison with Poisson distribution Blue bars denote a histogram of data divided into 1 sec bins. Red curve is a Poisson curve with rate = median count rate of data. |
 |
 |
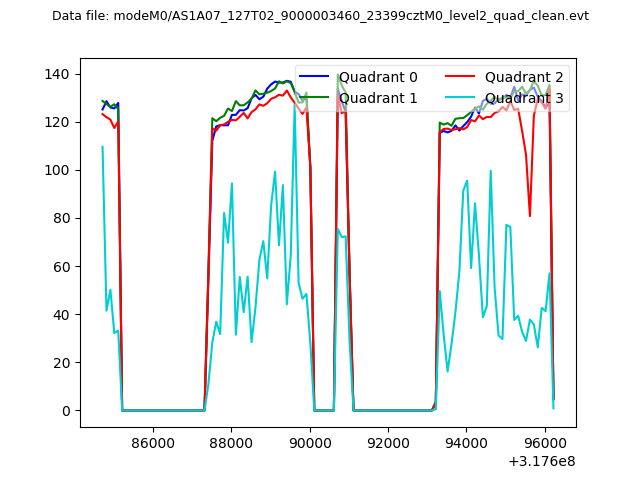
| Quadrant-wise count rates Data is divided into 100 sec bins |
 |
|
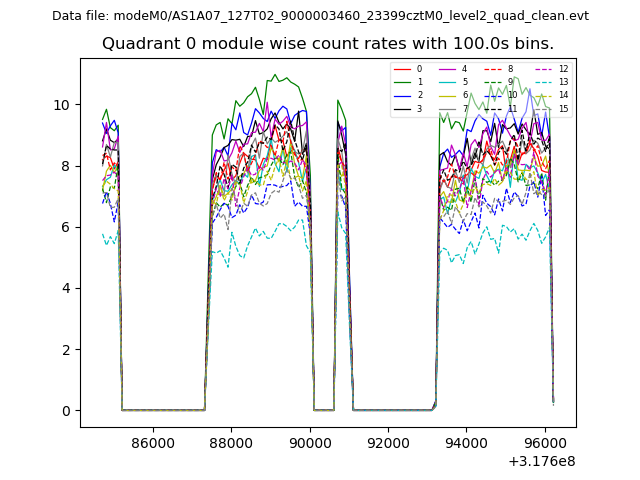
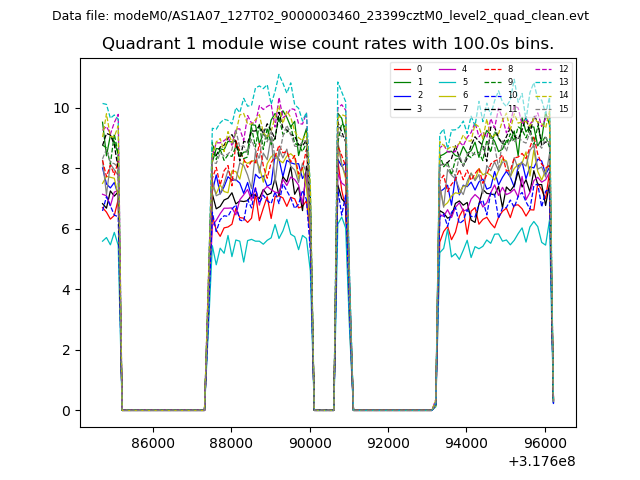
| Module-wise count rates for Quadrant A Data is divided into 100 sec bins |
 |
 |
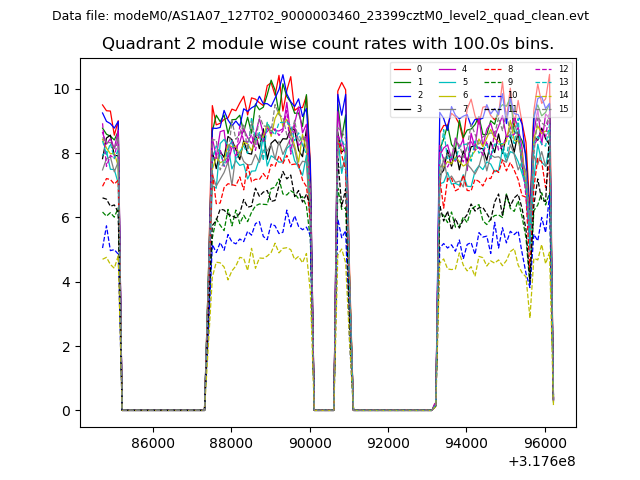
| Module-wise count rates for Quadrant B Data is divided into 100 sec bins |
 |
 |
| Module-wise count rates for Quadrant C Data is divided into 100 sec bins |
 |
 |
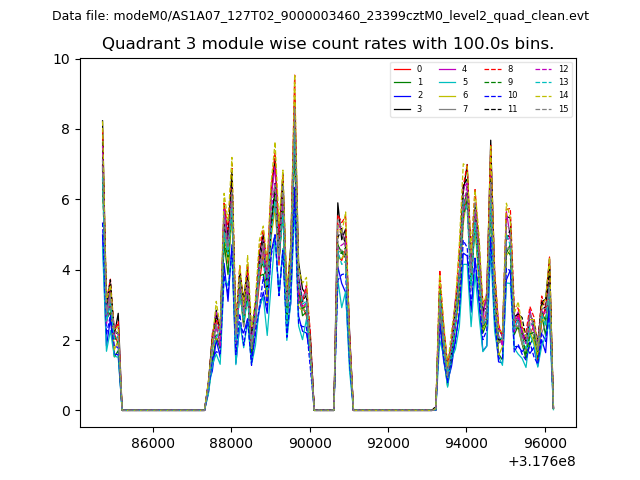
| Module-wise count rates for Quadrant D Data is divided into 100 sec bins |
 |
 |
| Parameter | Plot |
|---|---|
| CZT HV Monitor | 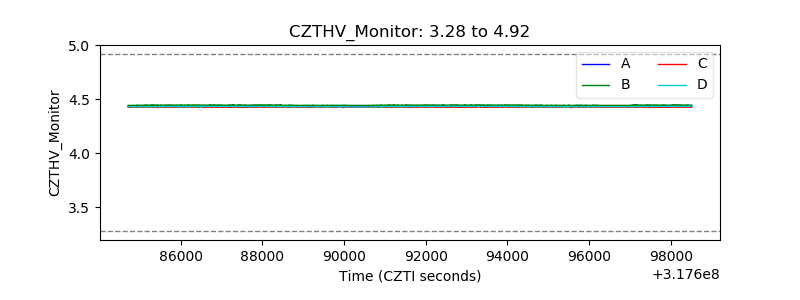 |
| D_VDD | 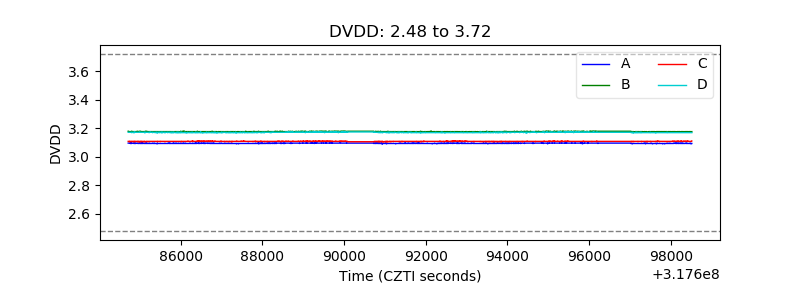 |
| Temperature 1 | 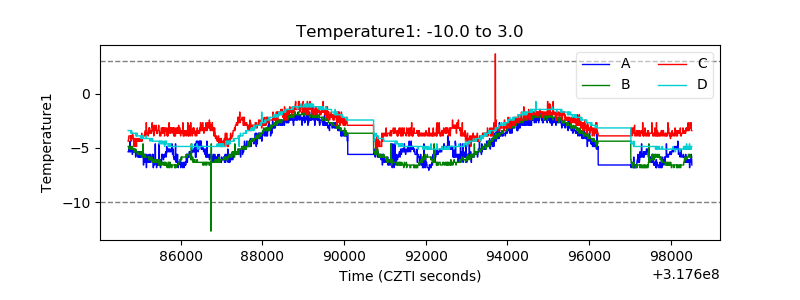 |
| Veto HV Monitor | 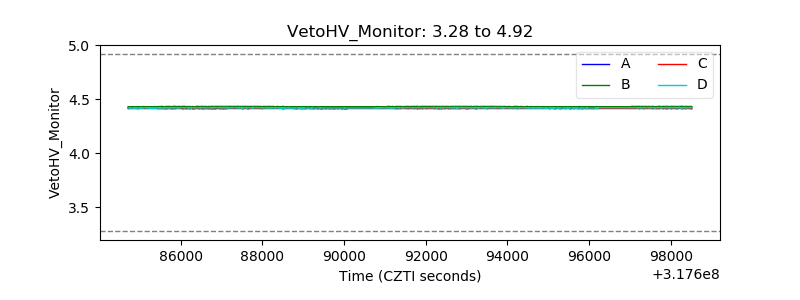 |
| Veto LLD | 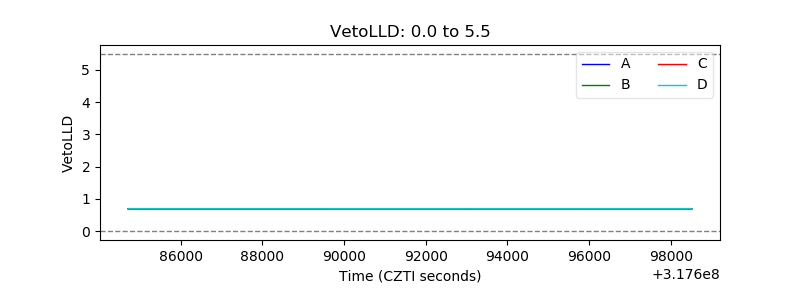 |
| Alpha Counter | 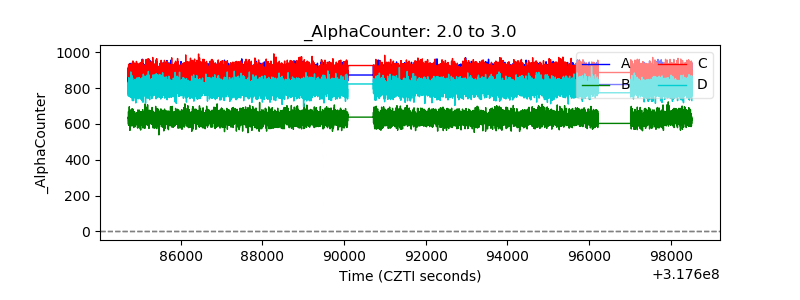 |
| _CPM_Rate | 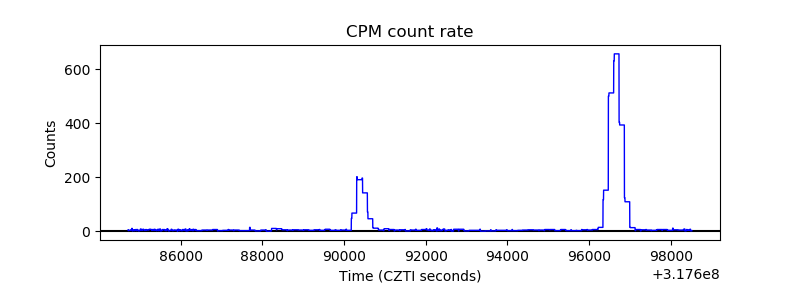 |
| CZT Counter | 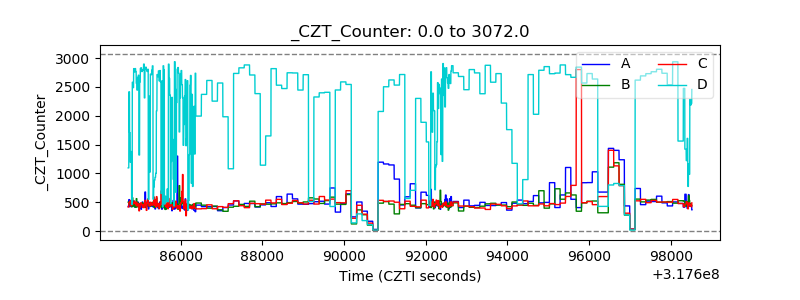 |
| +2.5 Volts monitor | 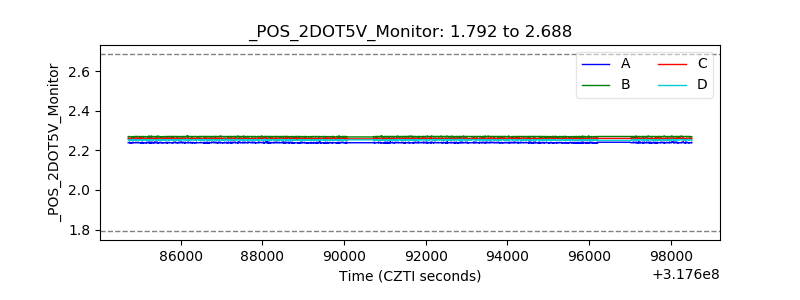 |
| +5 Volts monitor | 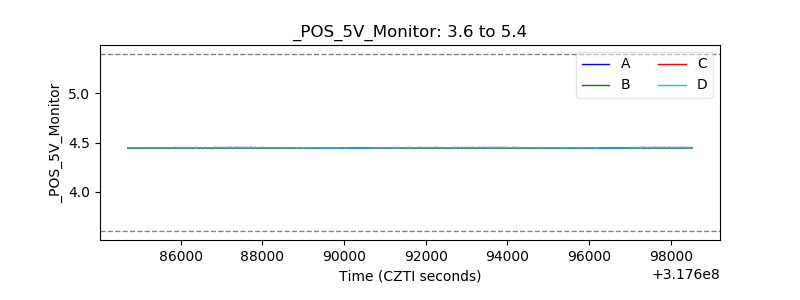 |
| _ROLL_ROT | 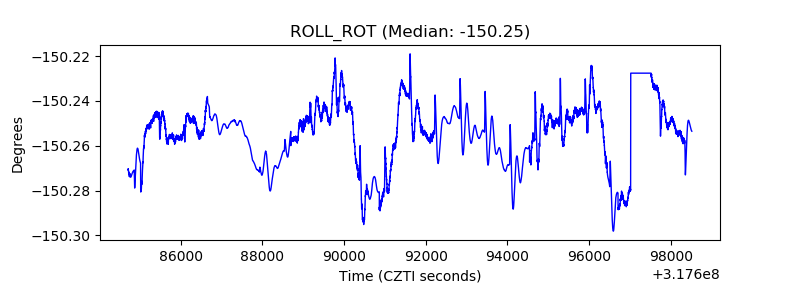 |
| _Roll_DEC | 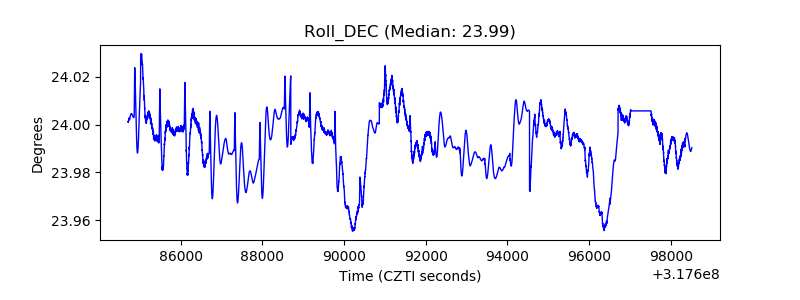 |
| _Roll_RA | 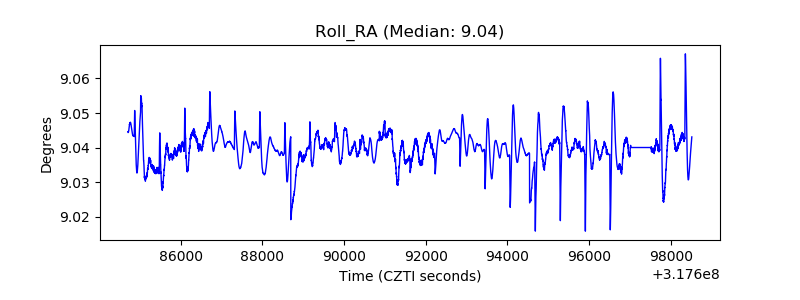 |
| Veto Counter | 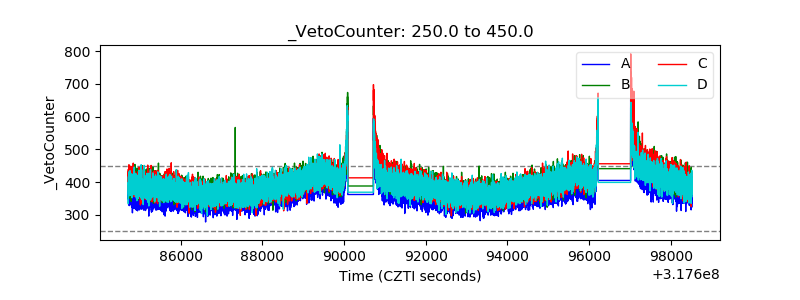 |