| Param | Original file | Final file |
|---|---|---|
| Filename | modeM0/AS1A07_127T02_9000003460_23401cztM0_level2.evt | modeM0/AS1A07_127T02_9000003460_23401cztM0_level2_quad_clean.evt |
| Size (bytes) | 449,847,360 | 74,324,160 |
| Size | 429.0 MB | 70.9 MB |
| Events in quadrant A | 3,361,765 | 461,395 |
| Events in quadrant B | 3,195,911 | 470,655 |
| Events in quadrant C | 3,093,866 | 446,535 |
| Events in quadrant D | 3,553,389 | 441,547 |
| Mode M9 | |||
|---|---|---|---|
| Quadrant | BADHDUFLAG | Total packets | Discarded packets |
| A | 0 | 11 | 0 |
| B | 0 | 11 | 0 |
| C | 0 | 11 | 0 |
| D | 0 | 11 | 0 |
| Mode M0 | |||
|---|---|---|---|
| Quadrant | BADHDUFLAG | Total packets | Discarded packets |
| A | 0 | 13786 | 1 |
| B | 0 | 13285 | 1 |
| C | 0 | 13071 | 1 |
| D | 0 | 14601 | 1 |
| Mode SS | |||
|---|---|---|---|
| Quadrant | BADHDUFLAG | Total packets | Discarded packets |
| A | 0 | 126 | 0 |
| B | 0 | 126 | 0 |
| C | 0 | 126 | 0 |
| D | 0 | 126 | 0 |
| Quadrant | Total seconds | Saturated seconds | Saturation percentage |
|---|---|---|---|
| A | 6163 | 46 | 0.746390% |
| B | 6164 | 54 | 0.876055% |
| C | 6164 | 82 | 1.330305% |
| D | 6164 | 104 | 1.687216% |
Noise dominated data is calculated using 1-second bins in cleaned event files. If a bin has >2000 counts, and if more than 50% of those come from <1% of pixels, then it is considered to be noise-dominated and hence unusable.
| Quadrant | # 1 sec bins | Bins with >0 counts | Bins with >2000 counts | High rate bins dominated by noise | Noise dominated (total time) | Noise dominated (detector-on time) | Marked lightcurve |
|---|---|---|---|---|---|---|---|
| A | 7278 | 6163 | 0 | 0 | 0.00% | 0.00% | 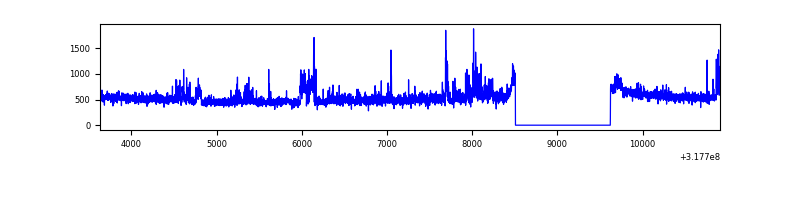 |
| B | 7279 | 6164 | 3 | 3 | 0.04% | 0.05% | 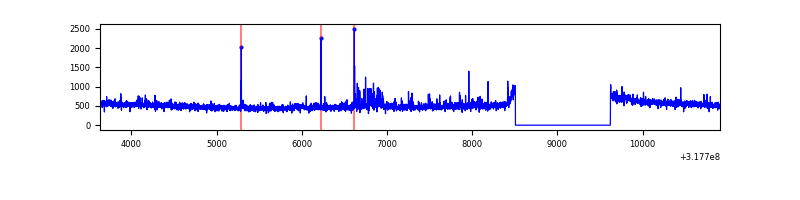 |
| C | 7279 | 6164 | 1 | 1 | 0.01% | 0.02% | 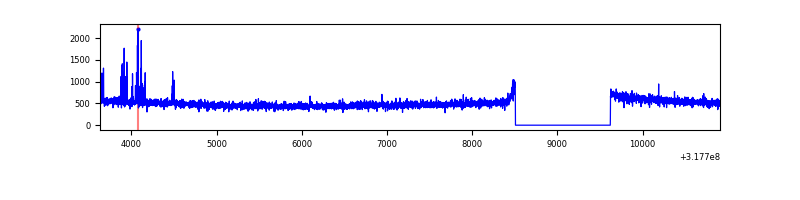 |
| D | 7279 | 6164 | 82 | 82 | 1.13% | 1.33% | 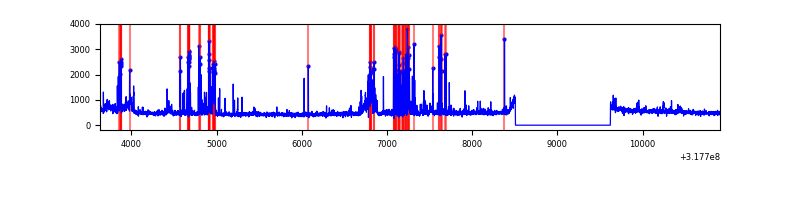 |
Top three noisy pixels from each quadrant. If the there are fewer than three noisy pixels in the level2.evt file, extra rows are filled as -1
| Pixel properties | Quadrant properties | ||||||
|---|---|---|---|---|---|---|---|
| Quadrant | DetID | PixID | Counts | Sigma | Mean | Median | Sigma |
| A | 6 | 16 | 319181 | 2020.93 | 790 | 775 | 157.6 |
| A | 13 | 254 | 9560 | 55.76 | 790 | 775 | 157.6 |
| A | 3 | 137 | 6848 | 38.55 | 790 | 775 | 157.6 |
| B | 0 | 189 | 52784 | 349.29 | 786 | 766 | 148.9 |
| B | 0 | 190 | 39385 | 259.32 | 786 | 766 | 148.9 |
| B | 12 | 111 | 18128 | 116.58 | 786 | 766 | 148.9 |
| C | 14 | 238 | 119957 | 682.61 | 750 | 756 | 174.6 |
| C | 2 | 16 | 37382 | 209.74 | 750 | 756 | 174.6 |
| C | 10 | 22 | 5847 | 29.15 | 750 | 756 | 174.6 |
| D | 1 | 52 | 644348 | 3478.32 | 759 | 735 | 185.0 |
| D | 7 | 238 | 24417 | 127.98 | 759 | 735 | 185.0 |
| D | 2 | 234 | 22701 | 118.71 | 759 | 735 | 185.0 |
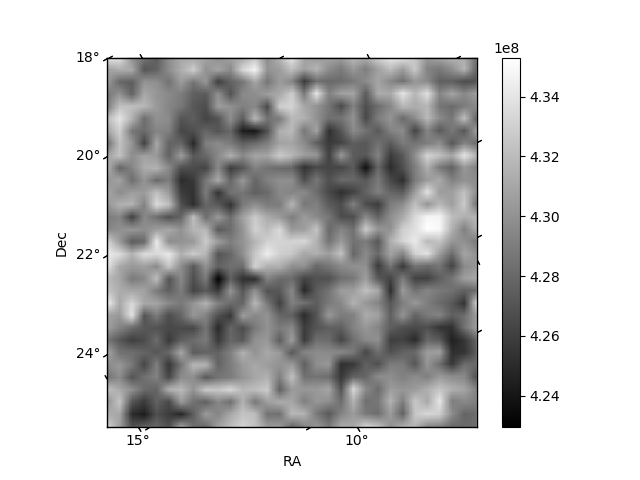
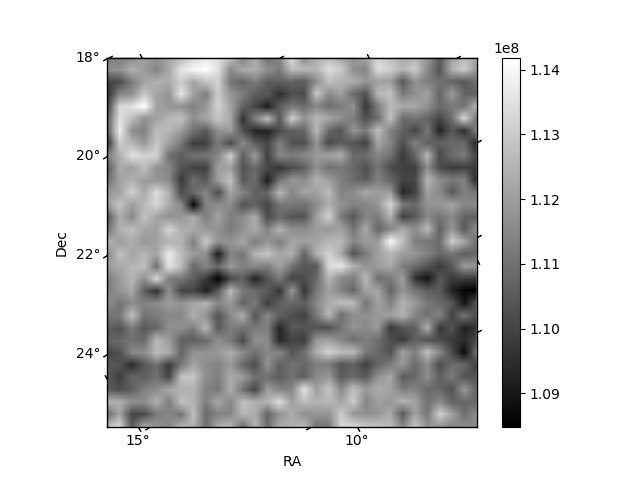
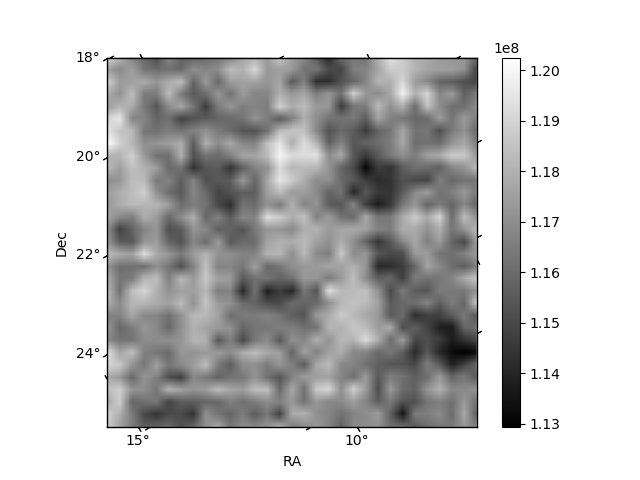
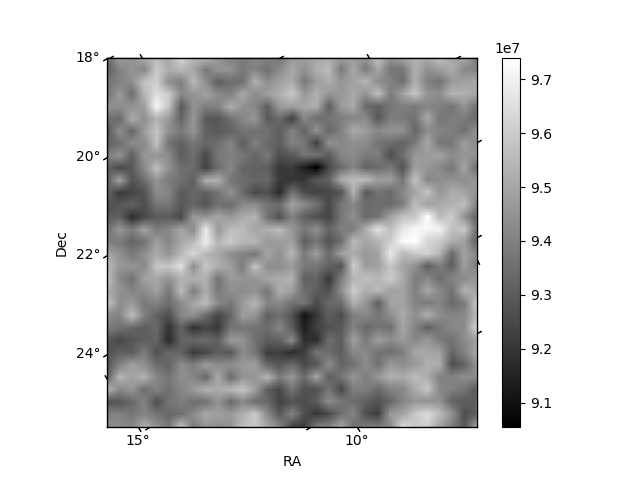
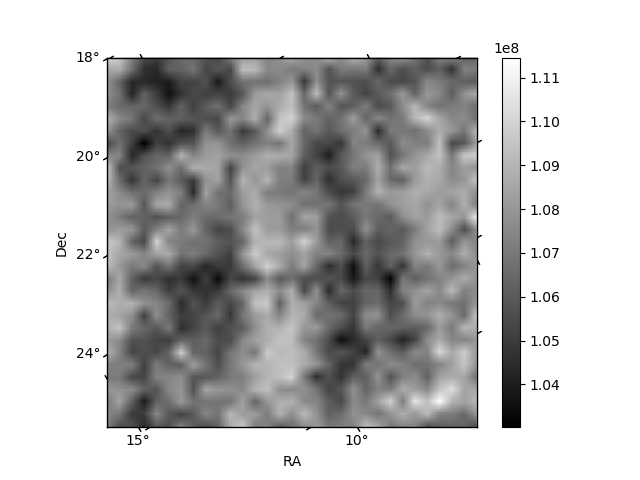
Histogram calculated using DETX and DETY for each event in the final _common_clean file
| Quadrant A | 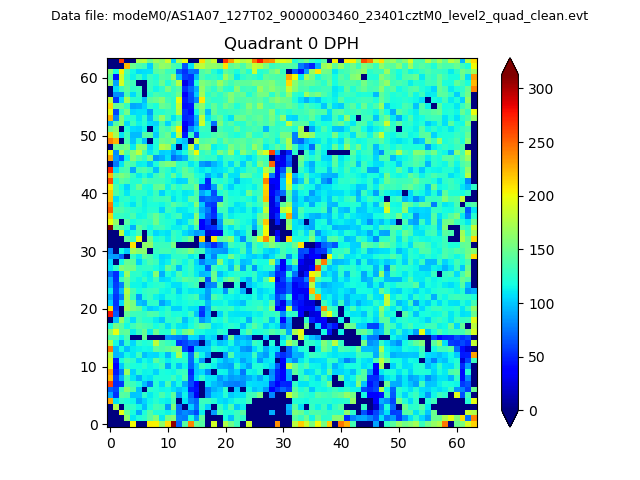 |
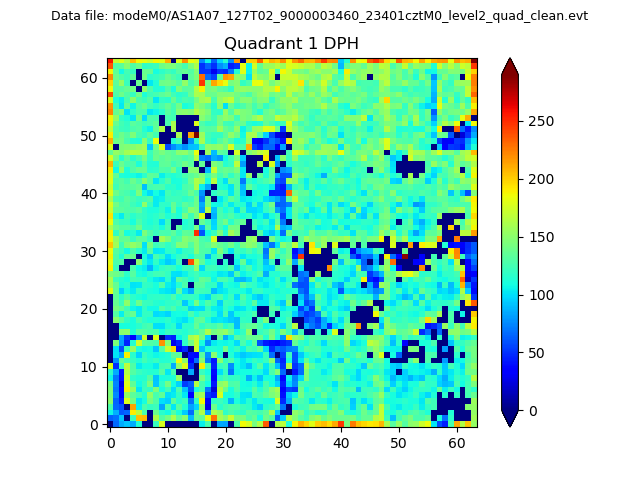 |
Quadrant B |
|---|---|---|---|
| Quadrant D | 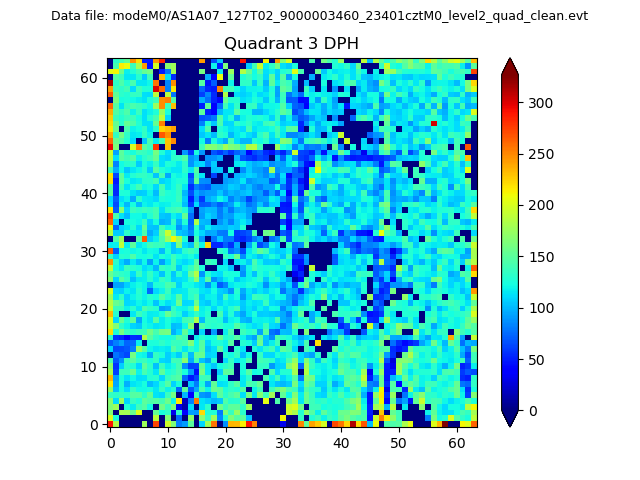 |
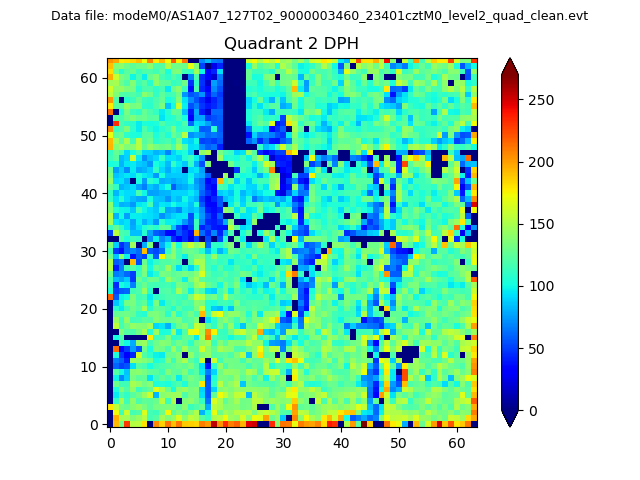 |
Quadrant C |
| Plot type | Count rate plots | Images |
|---|---|---|
| Comparison with Poisson distribution Blue bars denote a histogram of data divided into 1 sec bins. Red curve is a Poisson curve with rate = median count rate of data. |
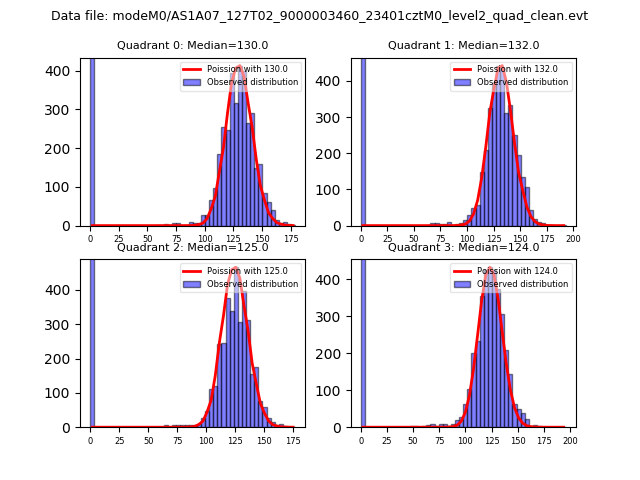 |
 |
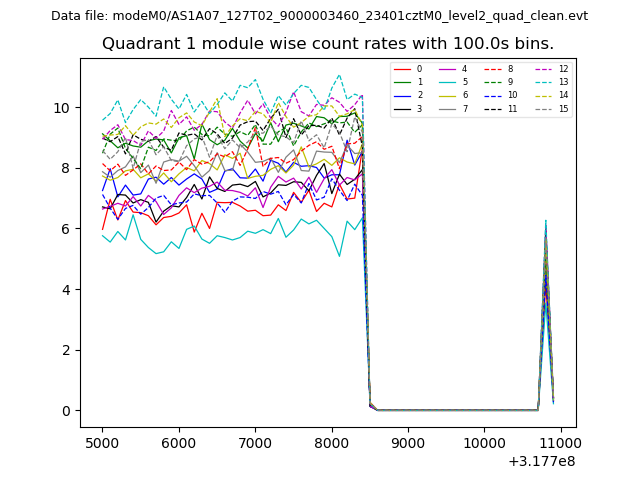
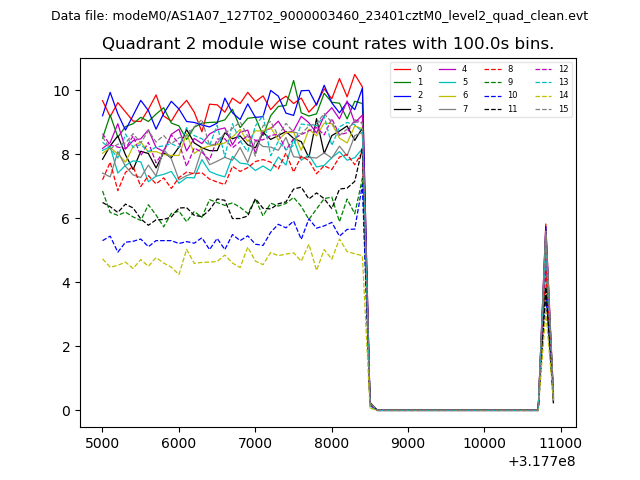
| Quadrant-wise count rates Data is divided into 100 sec bins |
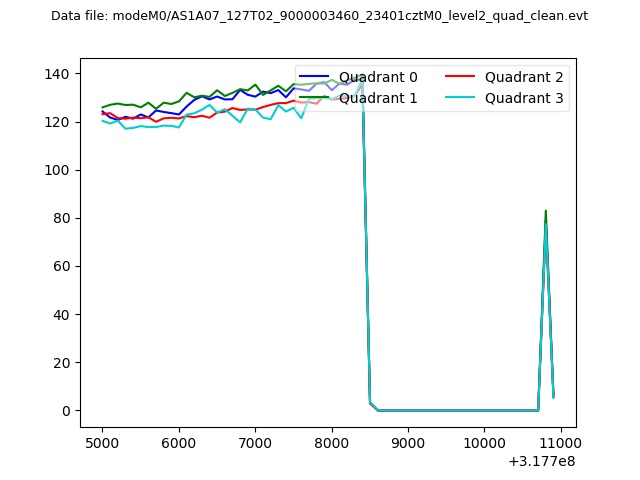 |
|
| Module-wise count rates for Quadrant A Data is divided into 100 sec bins |
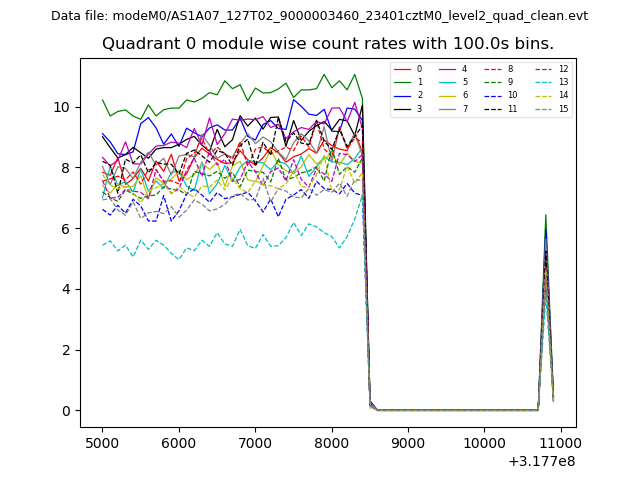 |
 |
| Module-wise count rates for Quadrant B Data is divided into 100 sec bins |
 |
 |
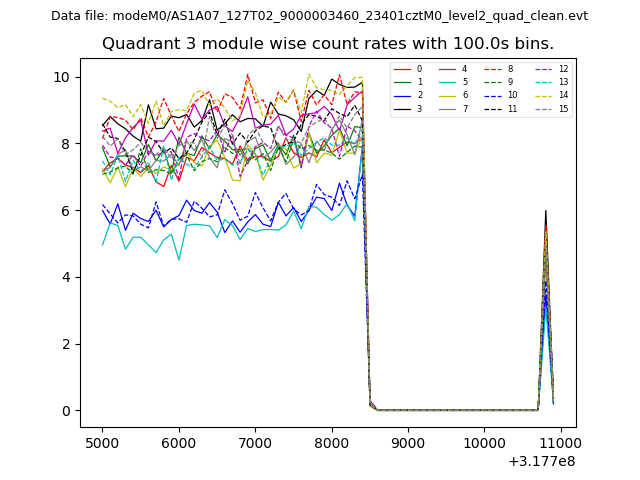
| Module-wise count rates for Quadrant C Data is divided into 100 sec bins |
 |
 |
| Module-wise count rates for Quadrant D Data is divided into 100 sec bins |
 |
 |
| Parameter | Plot |
|---|---|
| CZT HV Monitor | 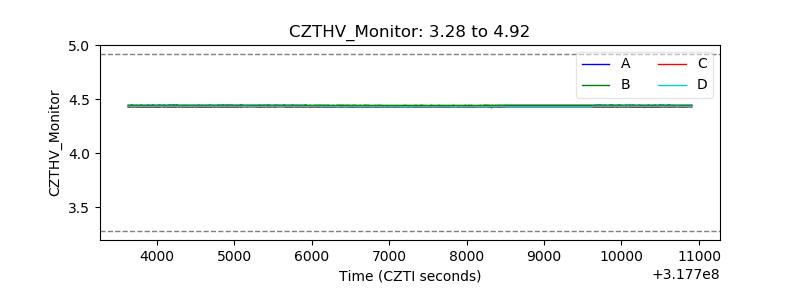 |
| D_VDD | 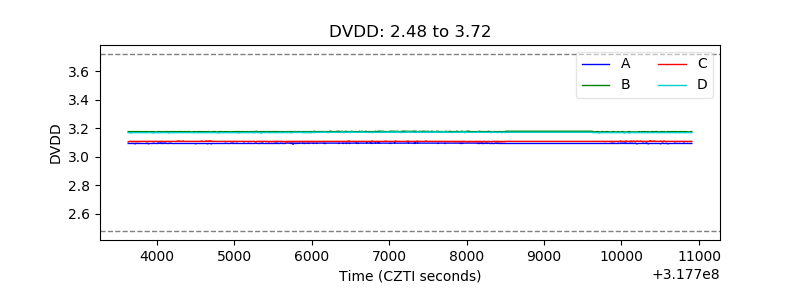 |
| Temperature 1 | 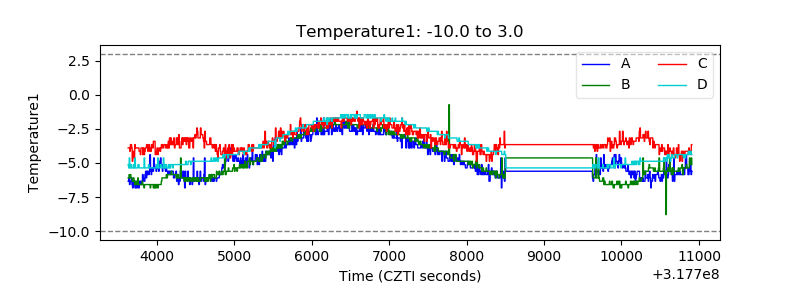 |
| Veto HV Monitor | 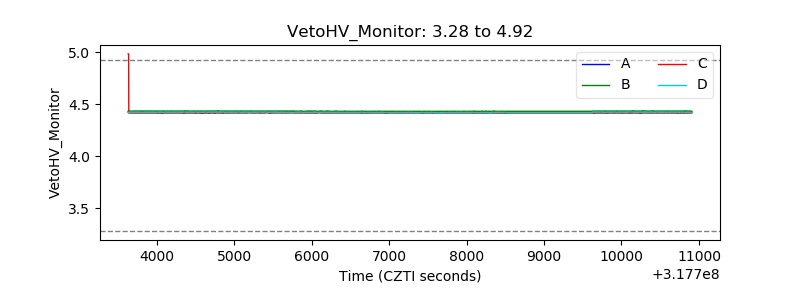 |
| Veto LLD | 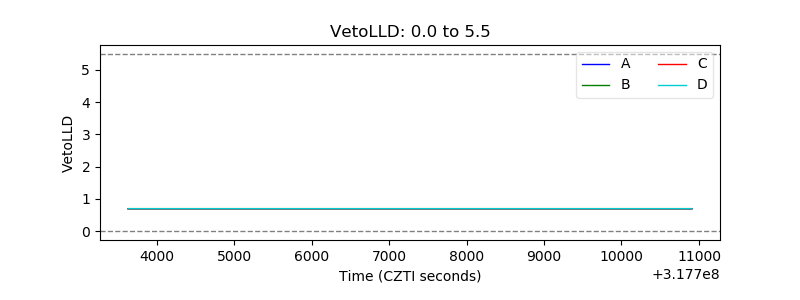 |
| Alpha Counter | 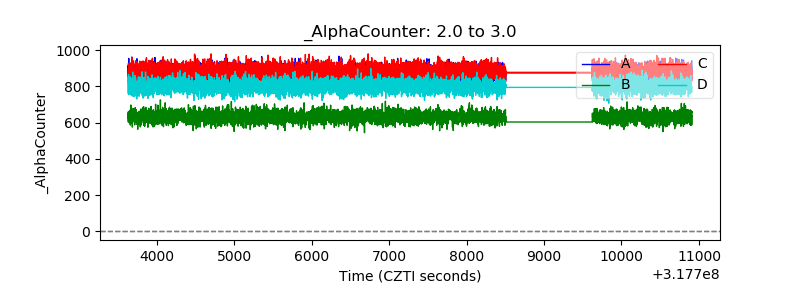 |
| _CPM_Rate | 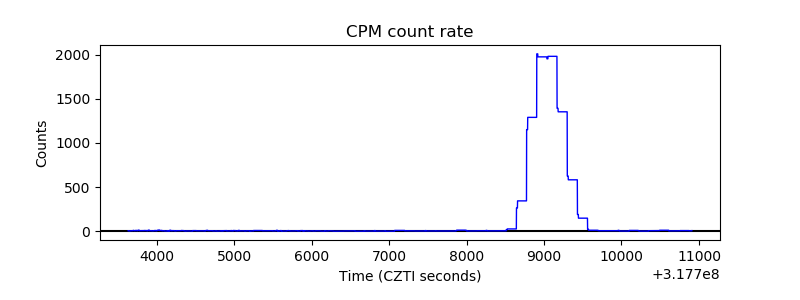 |
| CZT Counter | 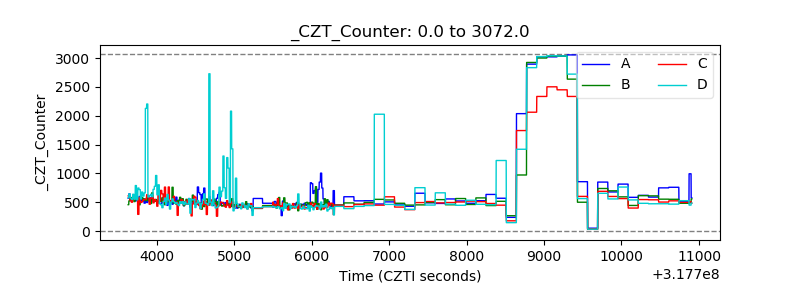 |
| +2.5 Volts monitor |  |
| +5 Volts monitor |  |
| _ROLL_ROT | 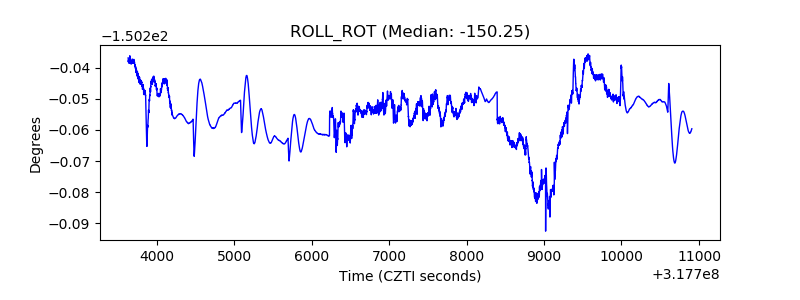 |
| _Roll_DEC | 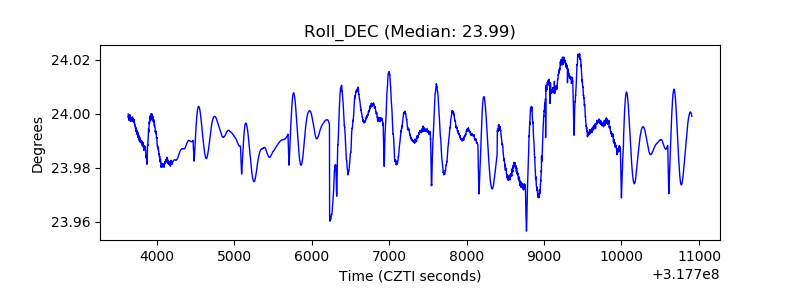 |
| _Roll_RA | 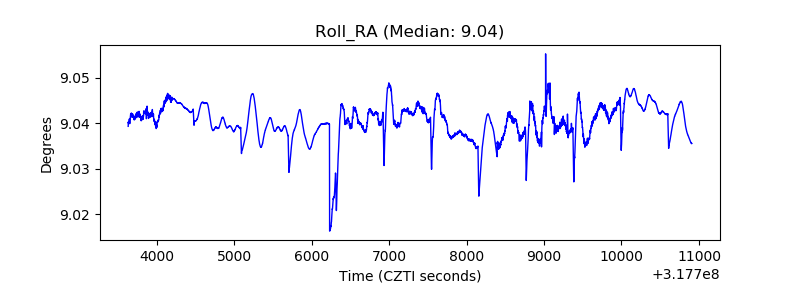 |
| Veto Counter | 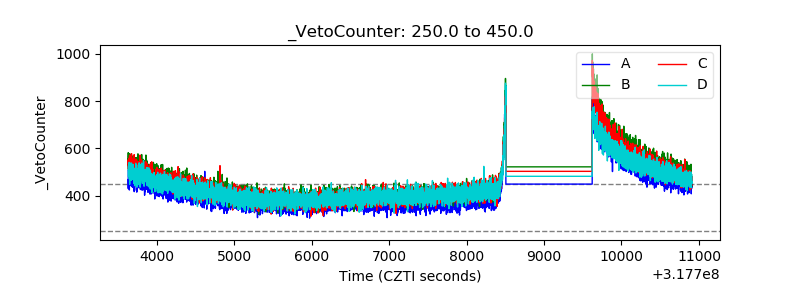 |