| Param | Original file | Final file |
|---|---|---|
| Filename | modeM0/AS1A07_127T02_9000003460_23403cztM0_level2.evt | modeM0/AS1A07_127T02_9000003460_23403cztM0_level2_quad_clean.evt |
| Size (bytes) | 477,397,440 | 88,344,000 |
| Size | 455.3 MB | 84.3 MB |
| Events in quadrant A | 3,790,867 | 569,424 |
| Events in quadrant B | 3,509,773 | 577,692 |
| Events in quadrant C | 3,315,502 | 546,374 |
| Events in quadrant D | 3,411,508 | 539,439 |
| Mode M9 | |||
|---|---|---|---|
| Quadrant | BADHDUFLAG | Total packets | Discarded packets |
| A | 0 | 12 | 0 |
| B | 0 | 13 | 0 |
| C | 0 | 13 | 0 |
| D | 0 | 13 | 0 |
| Mode M0 | |||
|---|---|---|---|
| Quadrant | BADHDUFLAG | Total packets | Discarded packets |
| A | 0 | 15432 | 2 |
| B | 0 | 14492 | 2 |
| C | 0 | 13902 | 2 |
| D | 0 | 14297 | 2 |
| Mode SS | |||
|---|---|---|---|
| Quadrant | BADHDUFLAG | Total packets | Discarded packets |
| A | 0 | 128 | 0 |
| B | 0 | 128 | 0 |
| C | 0 | 128 | 0 |
| D | 0 | 128 | 0 |
| Quadrant | Total seconds | Saturated seconds | Saturation percentage |
|---|---|---|---|
| A | 6342 | 80 | 1.261432% |
| B | 6342 | 91 | 1.434879% |
| C | 6342 | 102 | 1.608325% |
| D | 6342 | 55 | 0.867234% |
Noise dominated data is calculated using 1-second bins in cleaned event files. If a bin has >2000 counts, and if more than 50% of those come from <1% of pixels, then it is considered to be noise-dominated and hence unusable.
| Quadrant | # 1 sec bins | Bins with >0 counts | Bins with >2000 counts | High rate bins dominated by noise | Noise dominated (total time) | Noise dominated (detector-on time) | Marked lightcurve |
|---|---|---|---|---|---|---|---|
| A | 7547 | 6342 | 6 | 6 | 0.08% | 0.09% | 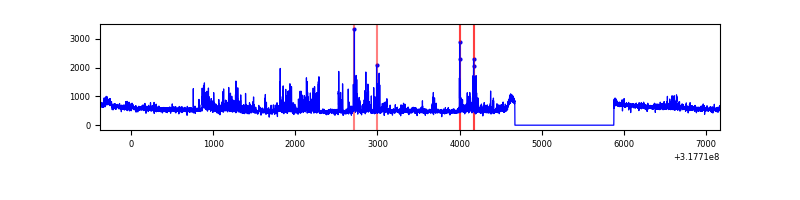 |
| B | 7547 | 6342 | 7 | 7 | 0.09% | 0.11% | 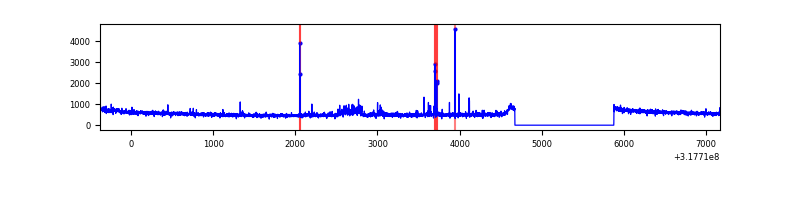 |
| C | 7547 | 6342 | 0 | 0 | 0.00% | 0.00% | 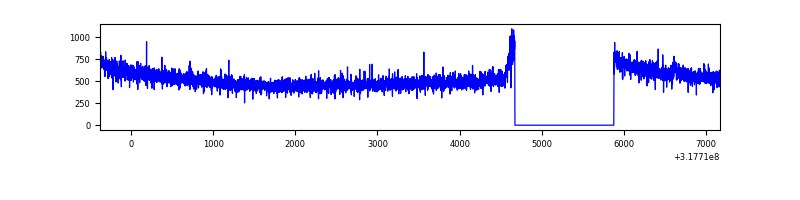 |
| D | 7547 | 6342 | 1 | 1 | 0.01% | 0.02% | 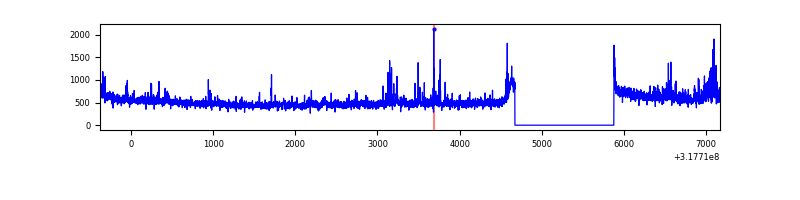 |
Top three noisy pixels from each quadrant. If the there are fewer than three noisy pixels in the level2.evt file, extra rows are filled as -1
| Pixel properties | Quadrant properties | ||||||
|---|---|---|---|---|---|---|---|
| Quadrant | DetID | PixID | Counts | Sigma | Mean | Median | Sigma |
| A | 6 | 16 | 453164 | 2619.07 | 866 | 849 | 172.7 |
| A | 13 | 254 | 10331 | 54.9 | 866 | 849 | 172.7 |
| A | 0 | 226 | 7598 | 39.08 | 866 | 849 | 172.7 |
| B | 0 | 190 | 65936 | 400.79 | 858 | 840 | 162.4 |
| B | 0 | 189 | 49416 | 299.08 | 858 | 840 | 162.4 |
| B | 4 | 216 | 25511 | 151.9 | 858 | 840 | 162.4 |
| C | 14 | 238 | 131604 | 695.79 | 814 | 822 | 188.0 |
| C | 10 | 9 | 9227 | 44.72 | 814 | 822 | 188.0 |
| C | 13 | 61 | 5656 | 25.72 | 814 | 822 | 188.0 |
| D | 1 | 52 | 123891 | 602.71 | 831 | 808 | 204.2 |
| D | 7 | 238 | 113489 | 551.78 | 831 | 808 | 204.2 |
| D | 2 | 234 | 23108 | 109.2 | 831 | 808 | 204.2 |
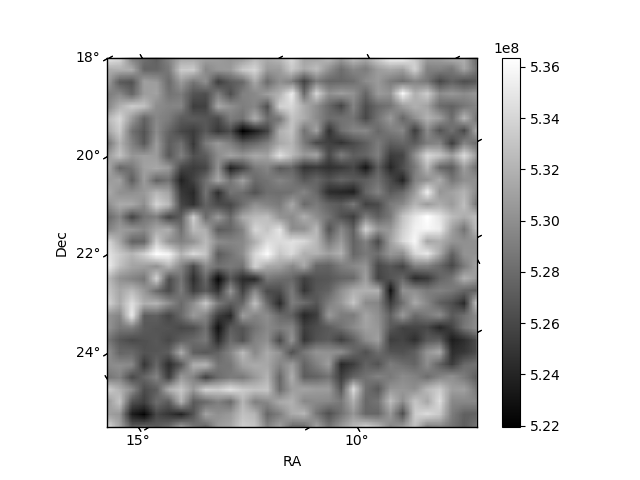
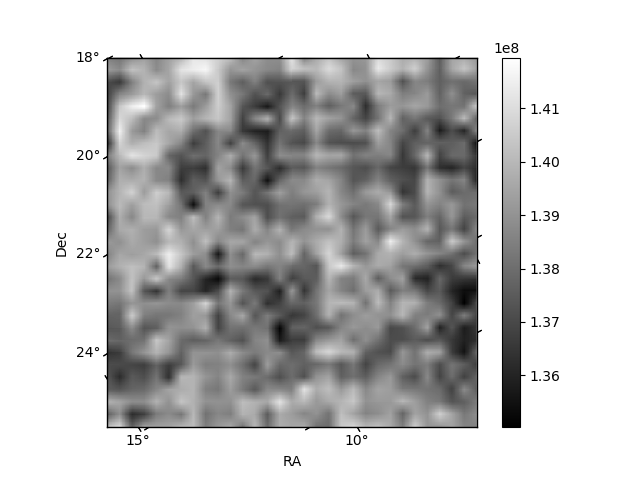
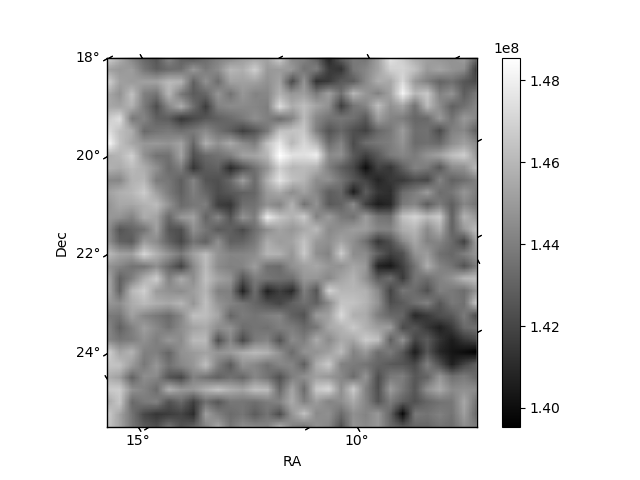
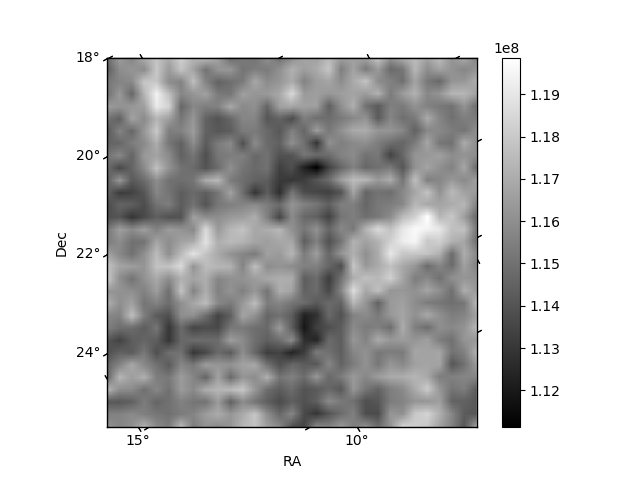
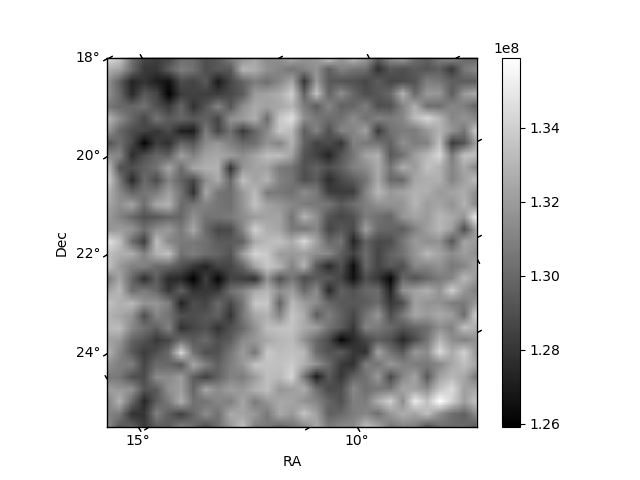
Histogram calculated using DETX and DETY for each event in the final _common_clean file
| Quadrant A |  |
 |
Quadrant B |
|---|---|---|---|
| Quadrant D |  |
 |
Quadrant C |
| Plot type | Count rate plots | Images |
|---|---|---|
| Comparison with Poisson distribution Blue bars denote a histogram of data divided into 1 sec bins. Red curve is a Poisson curve with rate = median count rate of data. |
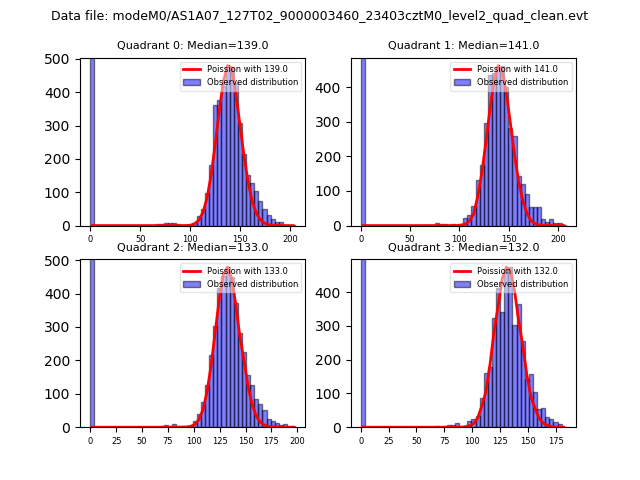 |
 |
| Quadrant-wise count rates Data is divided into 100 sec bins |
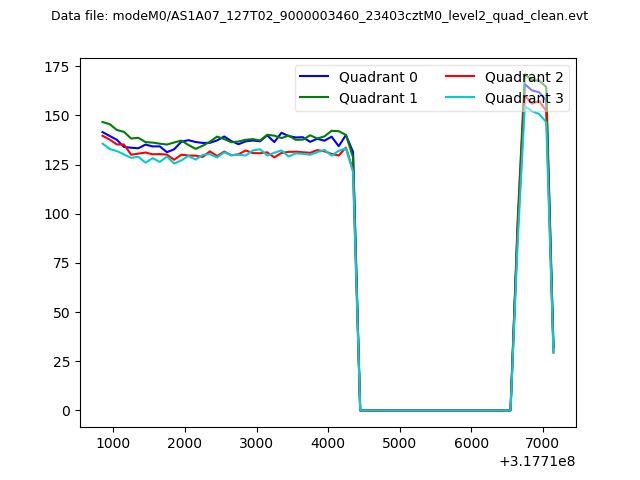 |
|
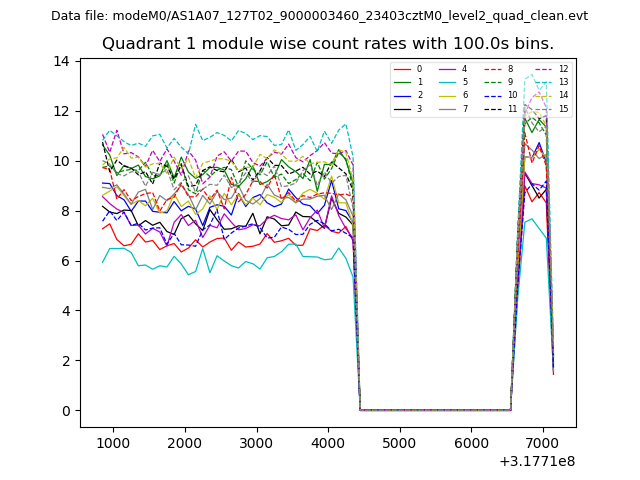
| Module-wise count rates for Quadrant A Data is divided into 100 sec bins |
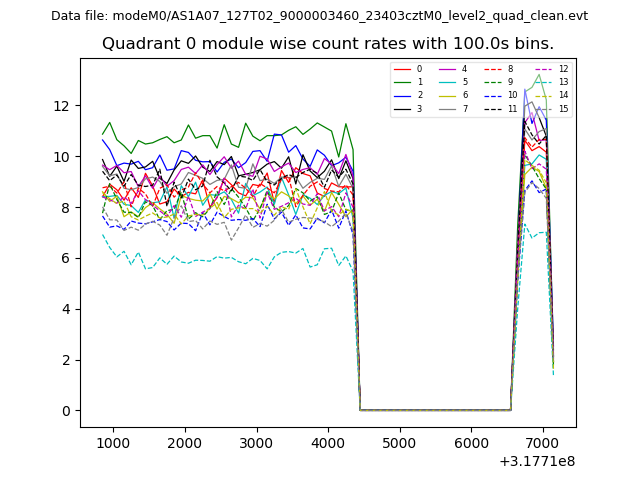 |
 |
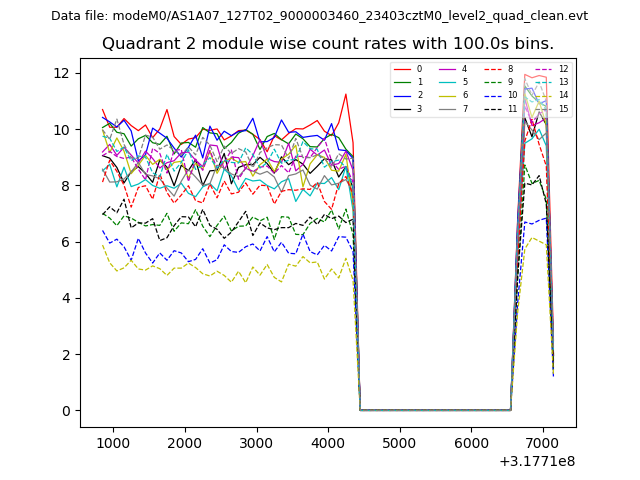
| Module-wise count rates for Quadrant B Data is divided into 100 sec bins |
 |
 |
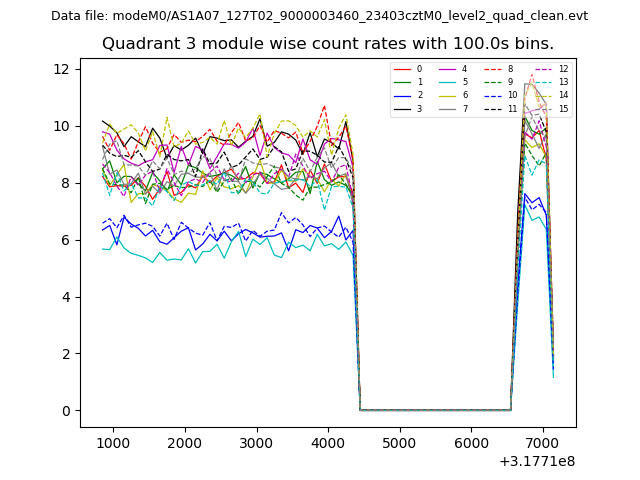
| Module-wise count rates for Quadrant C Data is divided into 100 sec bins |
 |
 |
| Module-wise count rates for Quadrant D Data is divided into 100 sec bins |
 |
 |
| Parameter | Plot |
|---|---|
| CZT HV Monitor |  |
| D_VDD | 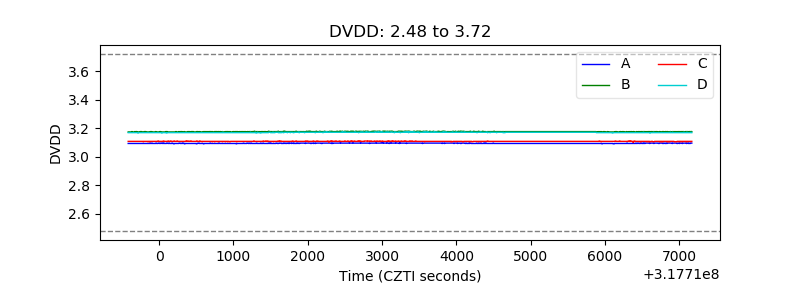 |
| Temperature 1 | 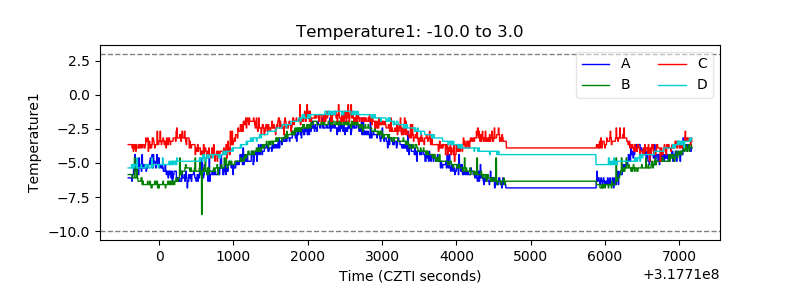 |
| Veto HV Monitor | 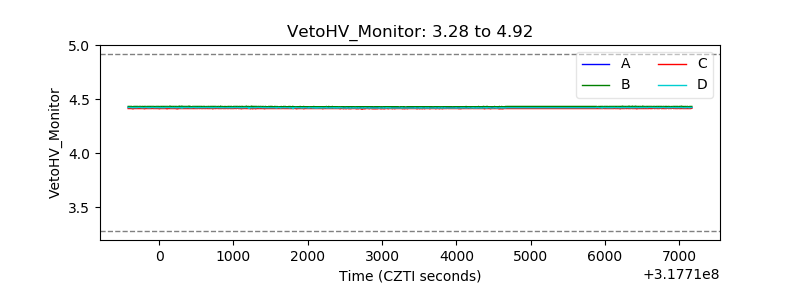 |
| Veto LLD | 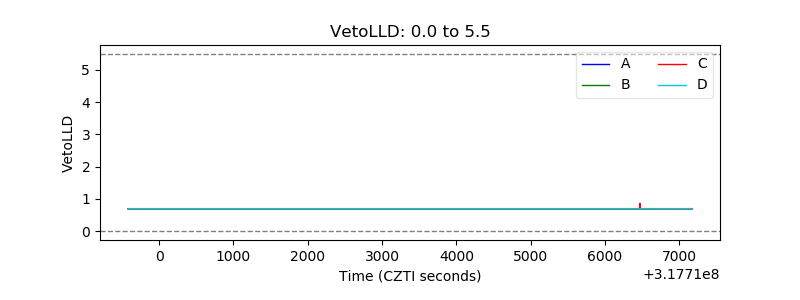 |
| Alpha Counter | 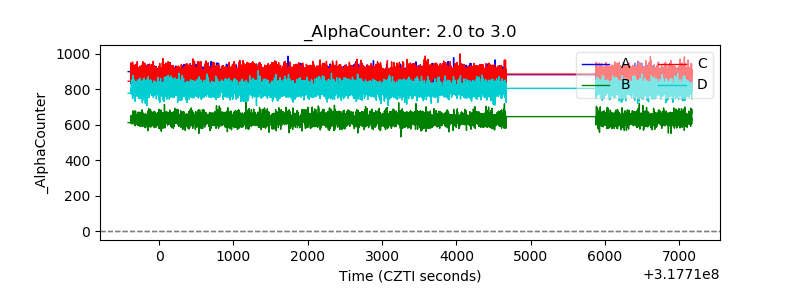 |
| _CPM_Rate | 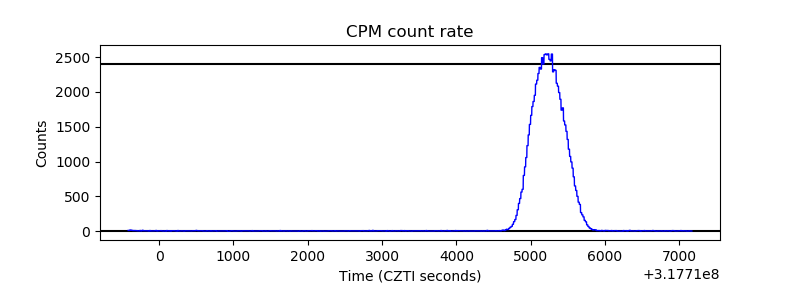 |
| CZT Counter | 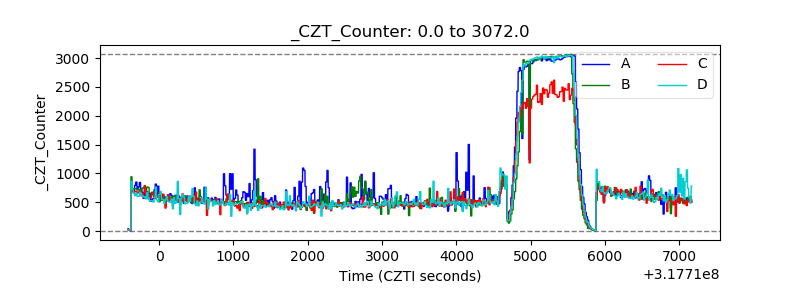 |
| +2.5 Volts monitor |  |
| +5 Volts monitor |  |
| _ROLL_ROT | 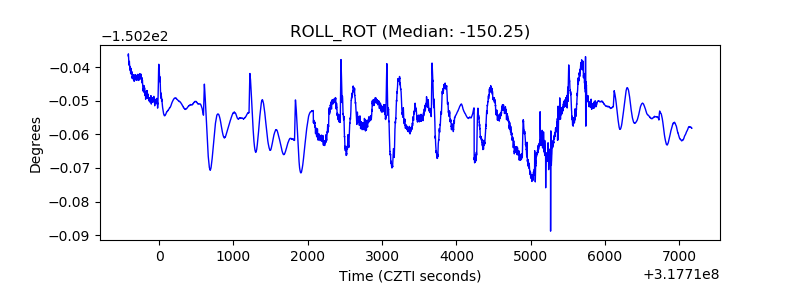 |
| _Roll_DEC | 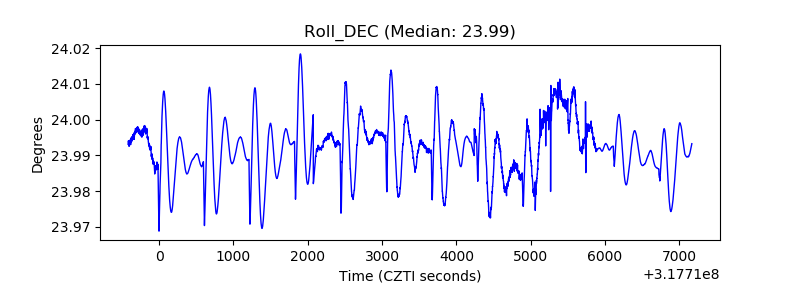 |
| _Roll_RA | 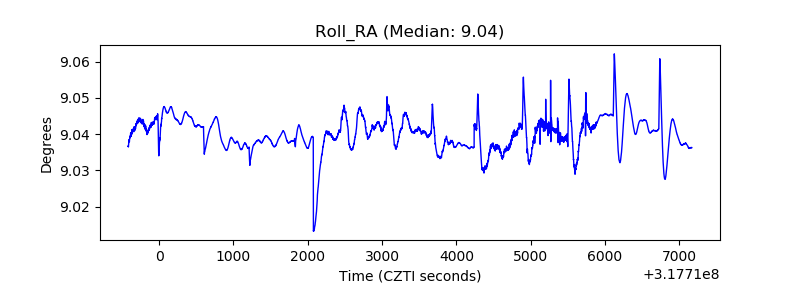 |
| Veto Counter | 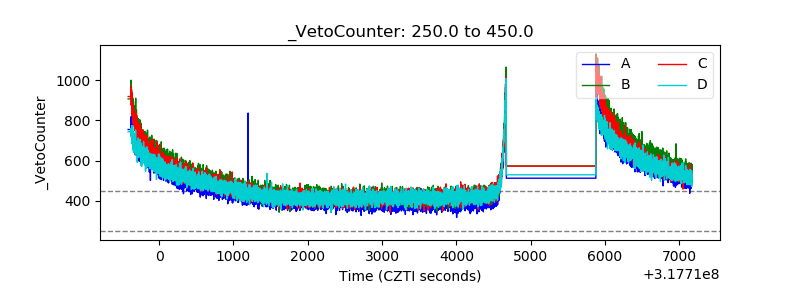 |