| Param | Original file | Final file |
|---|---|---|
| Filename | modeM0/AS1A07_127T02_9000003460_23404cztM0_level2.evt | modeM0/AS1A07_127T02_9000003460_23404cztM0_level2_quad_clean.evt |
| Size (bytes) | 506,715,840 | 103,426,560 |
| Size | 483.2 MB | 98.6 MB |
| Events in quadrant A | 3,755,414 | 692,858 |
| Events in quadrant B | 3,589,645 | 707,317 |
| Events in quadrant C | 3,409,220 | 653,887 |
| Events in quadrant D | 4,165,964 | 640,300 |
| Mode M9 | |||
|---|---|---|---|
| Quadrant | BADHDUFLAG | Total packets | Discarded packets |
| A | 0 | 17 | 0 |
| B | 0 | 17 | 0 |
| C | 0 | 18 | 0 |
| D | 0 | 18 | 0 |
| Mode M0 | |||
|---|---|---|---|
| Quadrant | BADHDUFLAG | Total packets | Discarded packets |
| A | 0 | 15330 | 14 |
| B | 0 | 14726 | 11 |
| C | 0 | 14100 | 14 |
| D | 0 | 16589 | 15 |
| Mode SS | |||
|---|---|---|---|
| Quadrant | BADHDUFLAG | Total packets | Discarded packets |
| A | 0 | 128 | 0 |
| B | 0 | 128 | 0 |
| C | 0 | 128 | 0 |
| D | 0 | 128 | 0 |
| Quadrant | Total seconds | Saturated seconds | Saturation percentage |
|---|---|---|---|
| A | 6275 | 108 | 1.721116% |
| B | 6276 | 120 | 1.912046% |
| C | 6274 | 136 | 2.167676% |
| D | 6274 | 143 | 2.279248% |
Noise dominated data is calculated using 1-second bins in cleaned event files. If a bin has >2000 counts, and if more than 50% of those come from <1% of pixels, then it is considered to be noise-dominated and hence unusable.
| Quadrant | # 1 sec bins | Bins with >0 counts | Bins with >2000 counts | High rate bins dominated by noise | Noise dominated (total time) | Noise dominated (detector-on time) | Marked lightcurve |
|---|---|---|---|---|---|---|---|
| A | 7559 | 6279 | 2 | 2 | 0.03% | 0.03% | 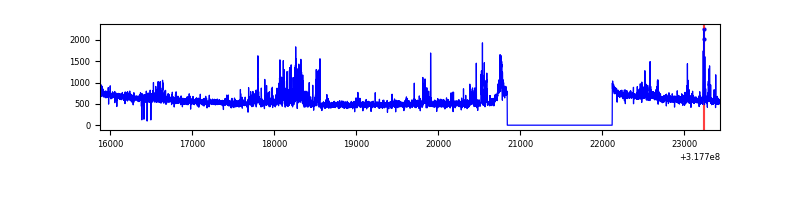 |
| B | 7559 | 6279 | 3 | 3 | 0.04% | 0.05% | 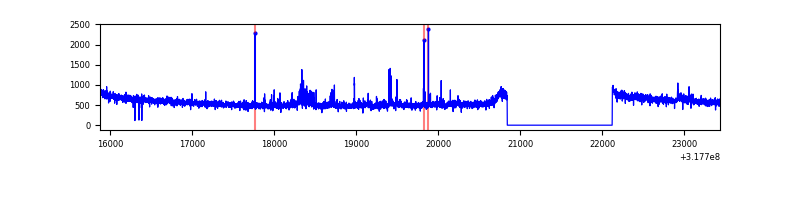 |
| C | 7559 | 6279 | 0 | 0 | 0.00% | 0.00% | 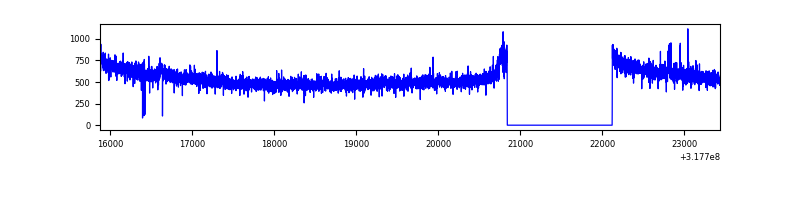 |
| D | 7559 | 6279 | 54 | 54 | 0.71% | 0.86% | 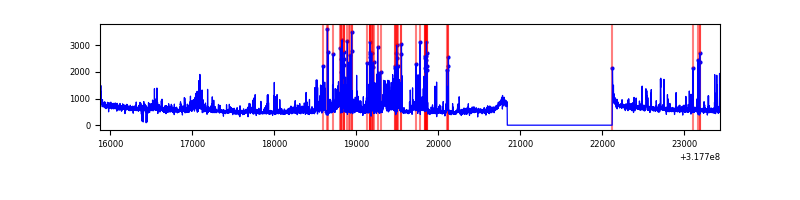 |
Top three noisy pixels from each quadrant. If the there are fewer than three noisy pixels in the level2.evt file, extra rows are filled as -1
| Pixel properties | Quadrant properties | ||||||
|---|---|---|---|---|---|---|---|
| Quadrant | DetID | PixID | Counts | Sigma | Mean | Median | Sigma |
| A | 6 | 16 | 304665 | 1710.92 | 896 | 880 | 177.6 |
| A | 13 | 254 | 10513 | 54.25 | 896 | 880 | 177.6 |
| A | 0 | 226 | 7848 | 39.24 | 896 | 880 | 177.6 |
| B | 0 | 189 | 63315 | 376.46 | 887 | 869 | 165.9 |
| B | 0 | 190 | 44789 | 264.78 | 887 | 869 | 165.9 |
| B | 12 | 111 | 19123 | 110.05 | 887 | 869 | 165.9 |
| C | 14 | 238 | 137970 | 715.23 | 831 | 839 | 191.7 |
| C | 10 | 9 | 17078 | 84.7 | 831 | 839 | 191.7 |
| C | 2 | 16 | 7187 | 33.11 | 831 | 839 | 191.7 |
| D | 1 | 52 | 760864 | 3655.55 | 853 | 831 | 207.9 |
| D | 7 | 238 | 174890 | 837.18 | 853 | 831 | 207.9 |
| D | 2 | 234 | 23932 | 111.11 | 853 | 831 | 207.9 |
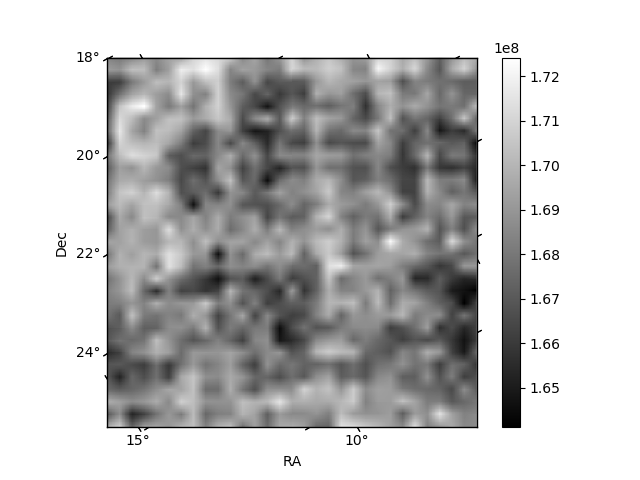
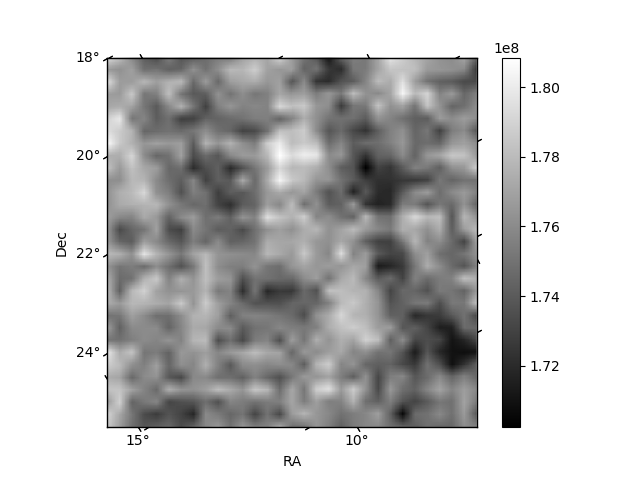
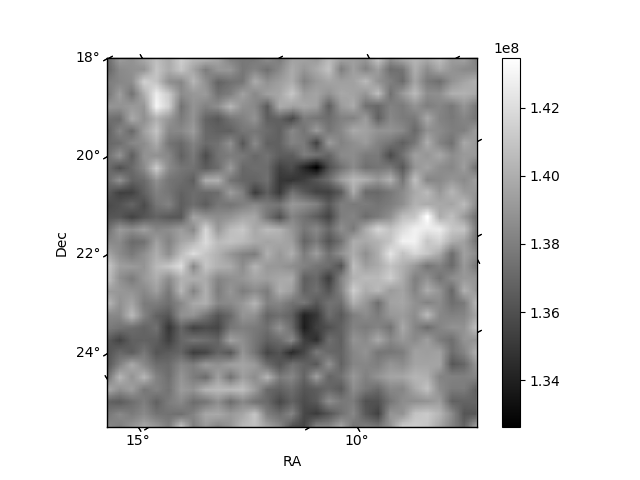
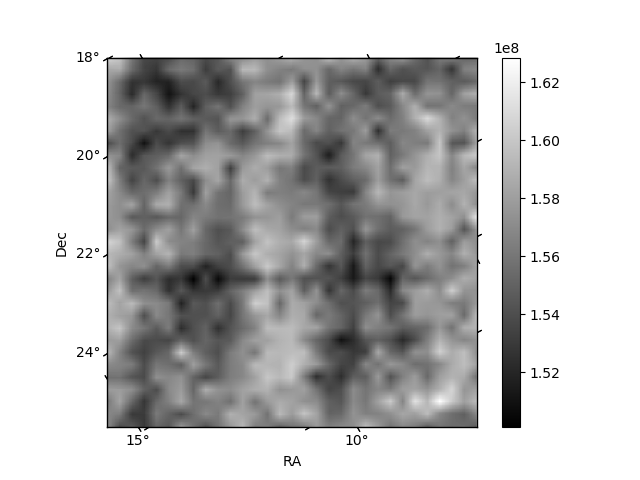
Histogram calculated using DETX and DETY for each event in the final _common_clean file
| Quadrant A | 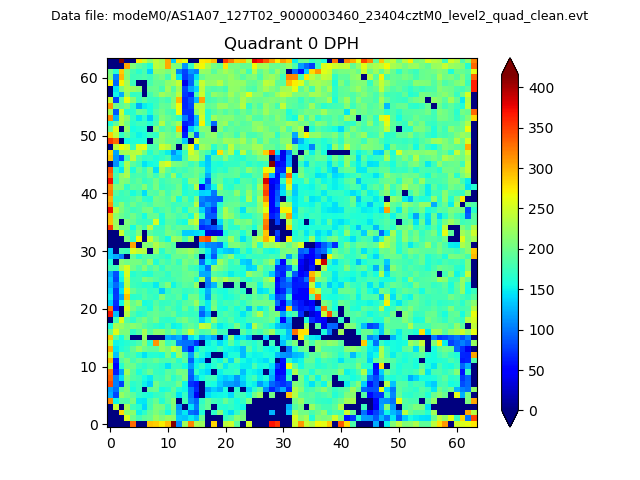 |
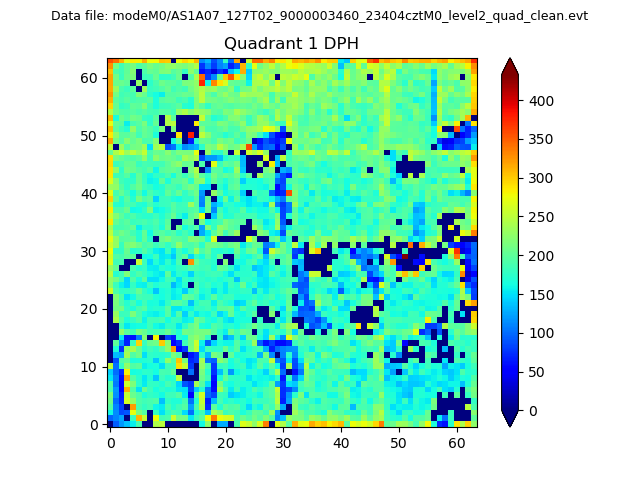 |
Quadrant B |
|---|---|---|---|
| Quadrant D | 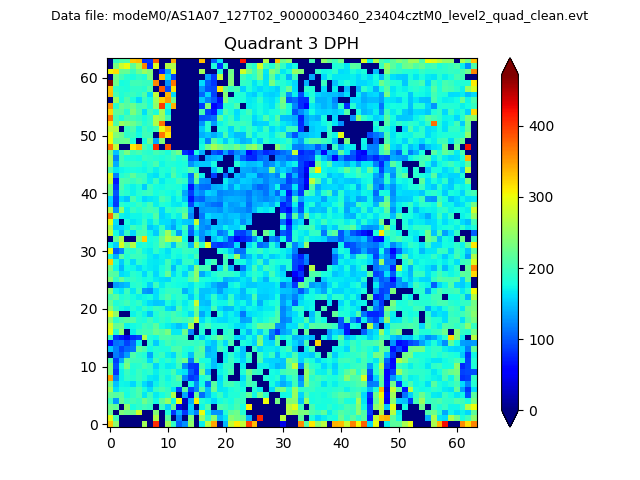 |
 |
Quadrant C |
| Plot type | Count rate plots | Images |
|---|---|---|
| Comparison with Poisson distribution Blue bars denote a histogram of data divided into 1 sec bins. Red curve is a Poisson curve with rate = median count rate of data. |
 |
 |
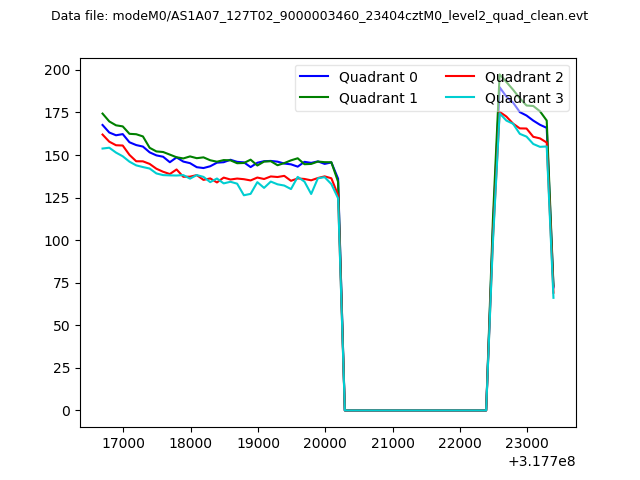
| Quadrant-wise count rates Data is divided into 100 sec bins |
 |
|
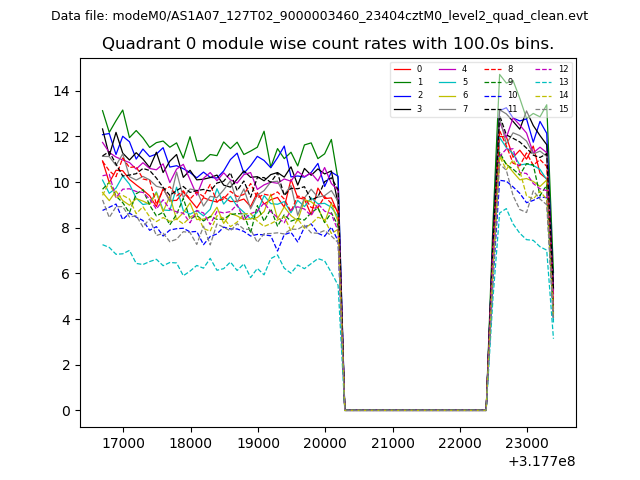
| Module-wise count rates for Quadrant A Data is divided into 100 sec bins |
 |
 |
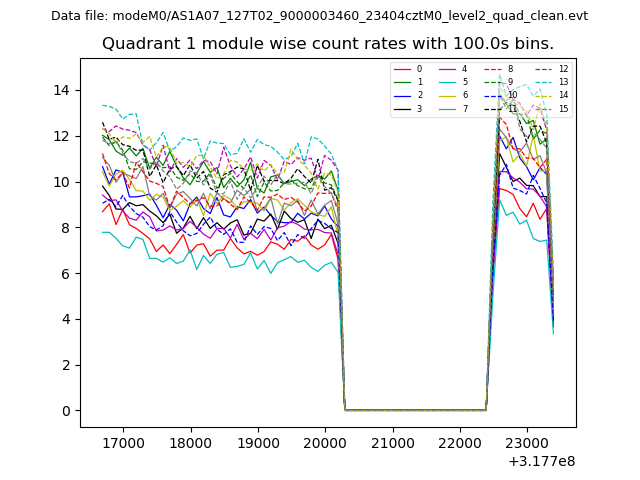
| Module-wise count rates for Quadrant B Data is divided into 100 sec bins |
 |
 |
| Module-wise count rates for Quadrant C Data is divided into 100 sec bins |
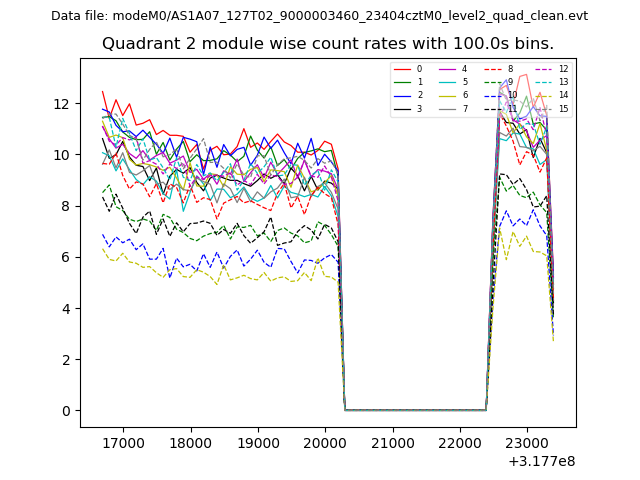 |
 |
| Module-wise count rates for Quadrant D Data is divided into 100 sec bins |
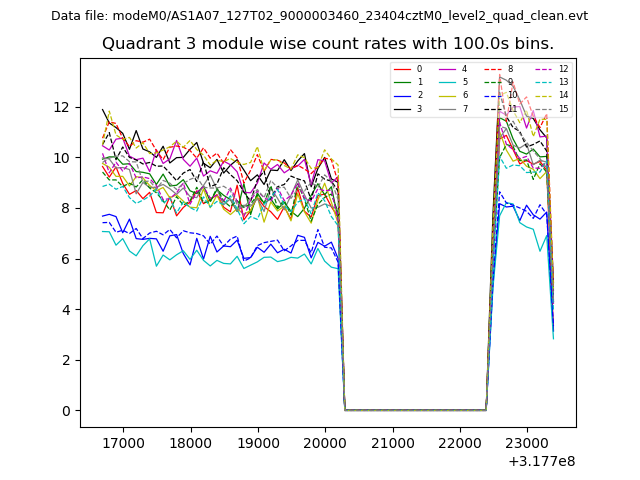 |
 |
| Parameter | Plot |
|---|---|
| CZT HV Monitor | 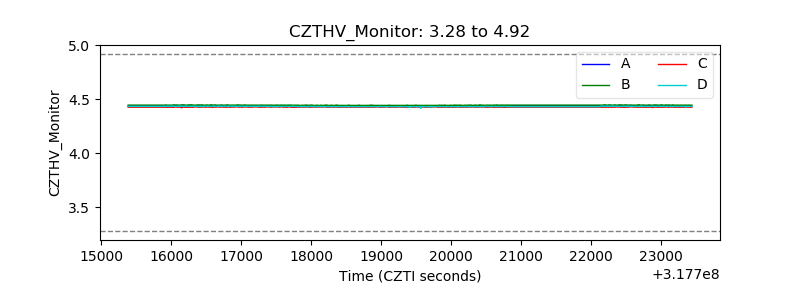 |
| D_VDD | 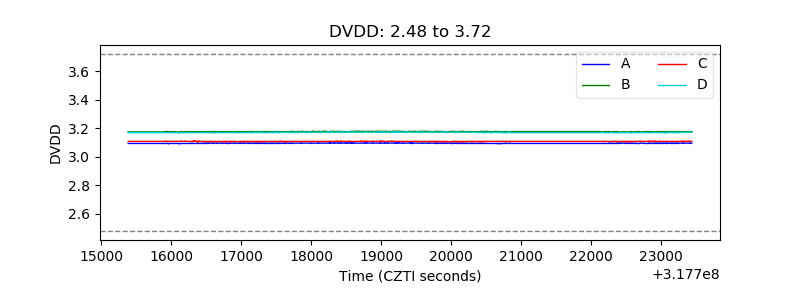 |
| Temperature 1 |  |
| Veto HV Monitor | 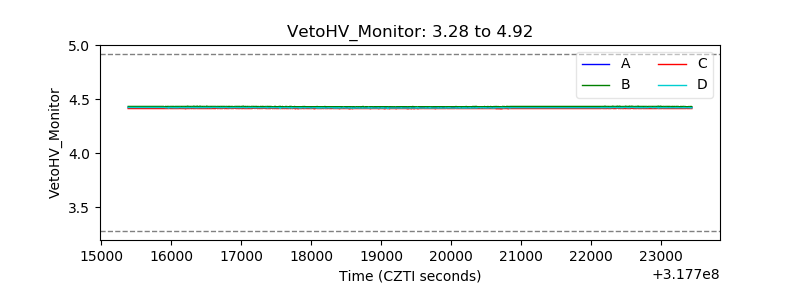 |
| Veto LLD | 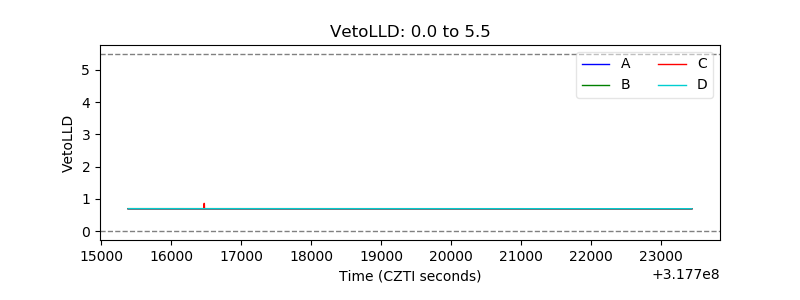 |
| Alpha Counter | 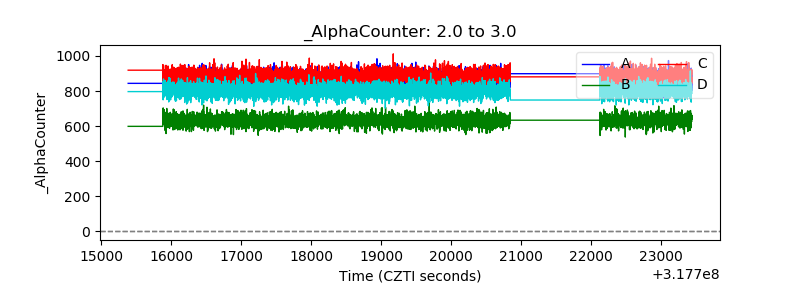 |
| _CPM_Rate | 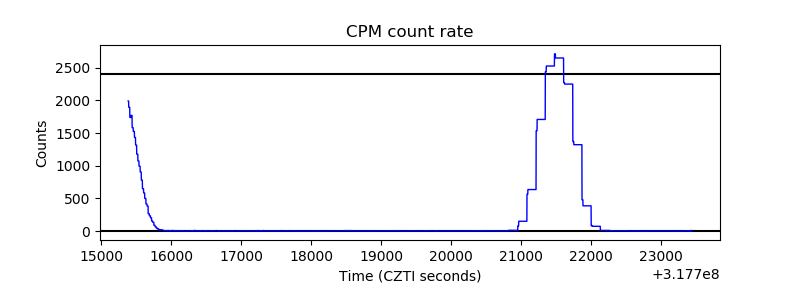 |
| CZT Counter | 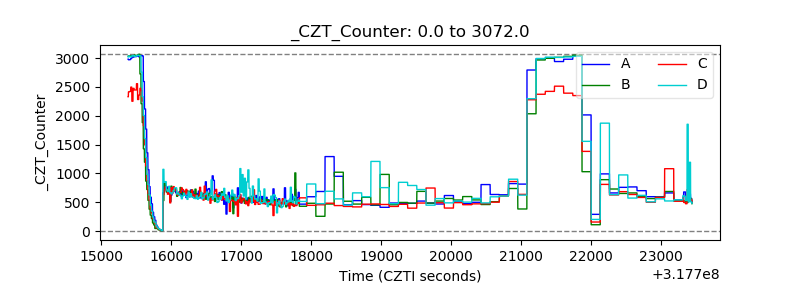 |
| +2.5 Volts monitor |  |
| +5 Volts monitor | 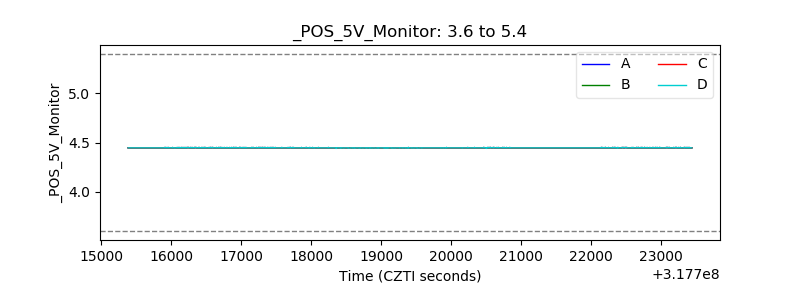 |
| _ROLL_ROT | 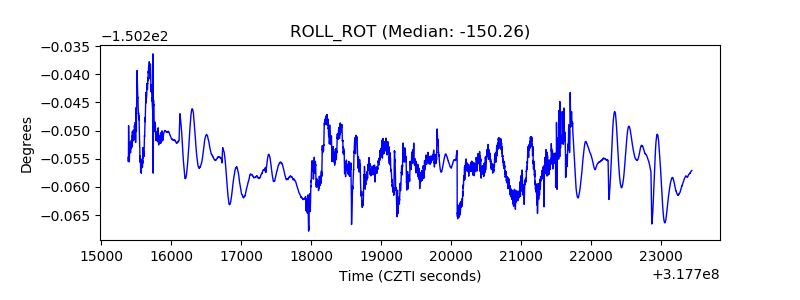 |
| _Roll_DEC |  |
| _Roll_RA | 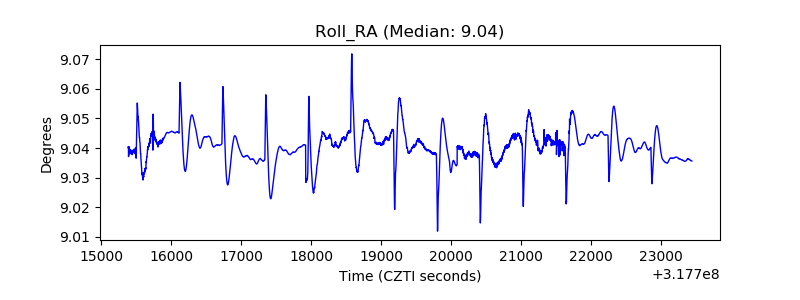 |
| Veto Counter | 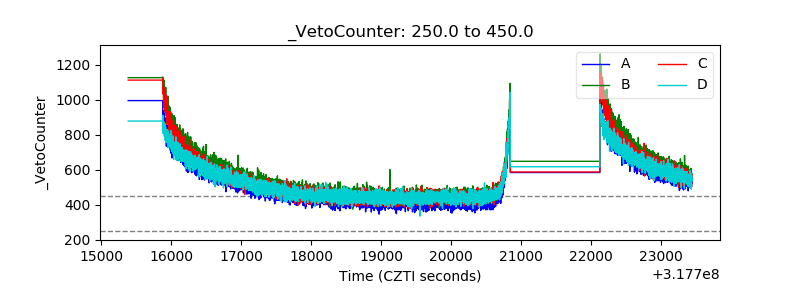 |