| Param | Original file | Final file |
|---|---|---|
| Filename | modeM0/AS1A07_127T02_9000003460_23405cztM0_level2.evt | modeM0/AS1A07_127T02_9000003460_23405cztM0_level2_quad_clean.evt |
| Size (bytes) | 474,612,480 | 114,793,920 |
| Size | 452.6 MB | 109.5 MB |
| Events in quadrant A | 3,417,385 | 792,733 |
| Events in quadrant B | 3,351,644 | 807,953 |
| Events in quadrant C | 3,165,284 | 737,753 |
| Events in quadrant D | 4,038,946 | 725,970 |
| Mode M9 | |||
|---|---|---|---|
| Quadrant | BADHDUFLAG | Total packets | Discarded packets |
| A | 0 | 13 | 0 |
| B | 0 | 13 | 0 |
| C | 0 | 13 | 0 |
| D | 0 | 13 | 0 |
| Mode M0 | |||
|---|---|---|---|
| Quadrant | BADHDUFLAG | Total packets | Discarded packets |
| A | 0 | 13959 | 7 |
| B | 0 | 13733 | 7 |
| C | 0 | 12970 | 9 |
| D | 0 | 15779 | 14 |
| Mode SS | |||
|---|---|---|---|
| Quadrant | BADHDUFLAG | Total packets | Discarded packets |
| A | 0 | 122 | 0 |
| B | 0 | 122 | 2 |
| C | 0 | 122 | 0 |
| D | 0 | 122 | 0 |
| Quadrant | Total seconds | Saturated seconds | Saturation percentage |
|---|---|---|---|
| A | 5897 | 96 | 1.627946% |
| B | 5898 | 85 | 1.441166% |
| C | 5897 | 95 | 1.610989% |
| D | 5898 | 217 | 3.679213% |
Noise dominated data is calculated using 1-second bins in cleaned event files. If a bin has >2000 counts, and if more than 50% of those come from <1% of pixels, then it is considered to be noise-dominated and hence unusable.
| Quadrant | # 1 sec bins | Bins with >0 counts | Bins with >2000 counts | High rate bins dominated by noise | Noise dominated (total time) | Noise dominated (detector-on time) | Marked lightcurve |
|---|---|---|---|---|---|---|---|
| A | 7265 | 5900 | 14 | 14 | 0.19% | 0.24% | 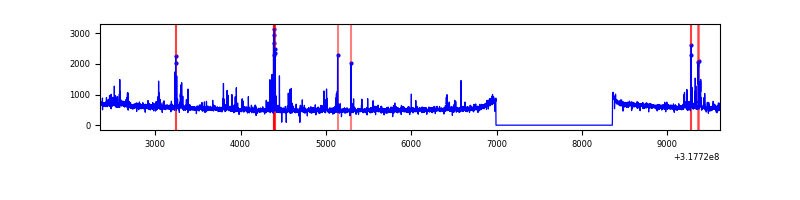 |
| B | 7266 | 5901 | 7 | 7 | 0.10% | 0.12% | 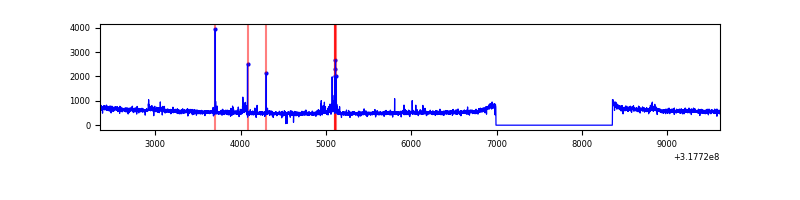 |
| C | 7266 | 5901 | 0 | 0 | 0.00% | 0.00% | 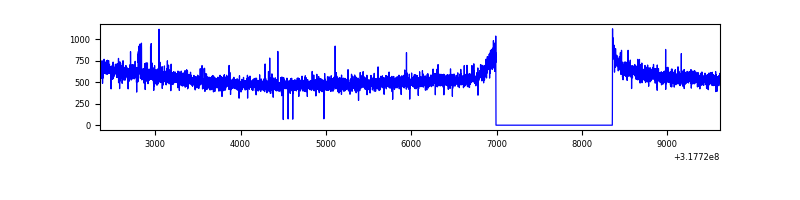 |
| D | 7266 | 5901 | 163 | 163 | 2.24% | 2.76% | 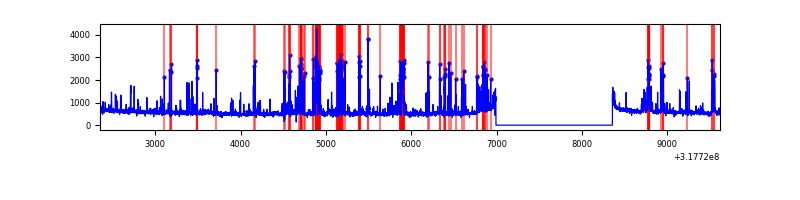 |
Top three noisy pixels from each quadrant. If the there are fewer than three noisy pixels in the level2.evt file, extra rows are filled as -1
| Pixel properties | Quadrant properties | ||||||
|---|---|---|---|---|---|---|---|
| Quadrant | DetID | PixID | Counts | Sigma | Mean | Median | Sigma |
| A | 6 | 16 | 188103 | 1123.74 | 838 | 824 | 166.7 |
| A | 13 | 254 | 9156 | 49.99 | 838 | 824 | 166.7 |
| A | 0 | 226 | 7339 | 39.09 | 838 | 824 | 166.7 |
| B | 0 | 189 | 67539 | 430.95 | 827 | 810 | 154.8 |
| B | 0 | 190 | 33808 | 213.11 | 827 | 810 | 154.8 |
| B | 12 | 111 | 17703 | 109.1 | 827 | 810 | 154.8 |
| C | 14 | 238 | 128001 | 714.27 | 774 | 780 | 178.1 |
| C | 10 | 9 | 10243 | 53.13 | 774 | 780 | 178.1 |
| C | 2 | 16 | 7199 | 36.04 | 774 | 780 | 178.1 |
| D | 1 | 52 | 840582 | 4374.6 | 793 | 772 | 192.0 |
| D | 12 | 227 | 132184 | 684.53 | 793 | 772 | 192.0 |
| D | 7 | 238 | 37923 | 193.52 | 793 | 772 | 192.0 |
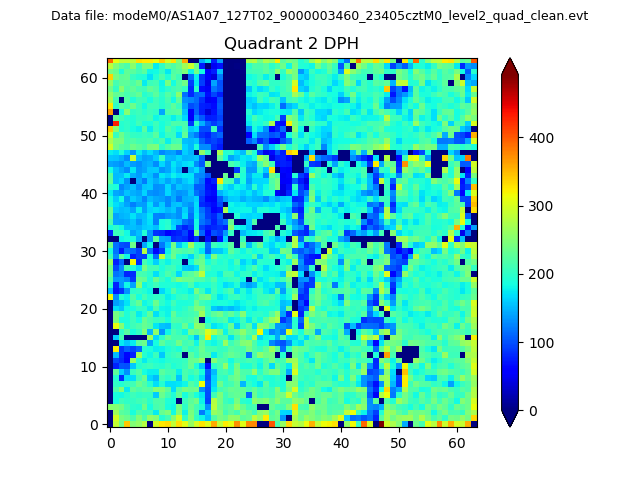
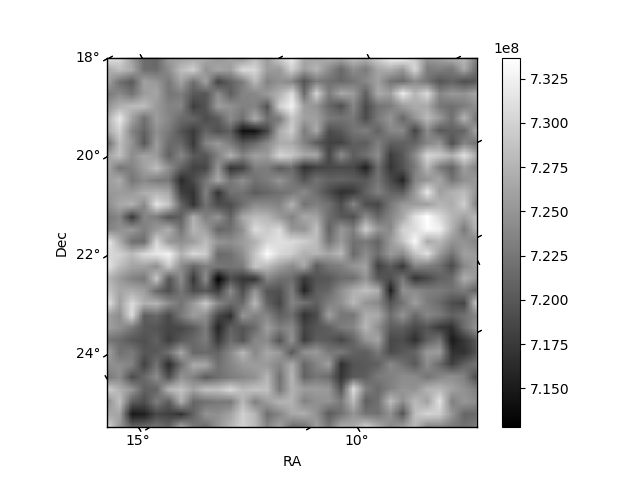
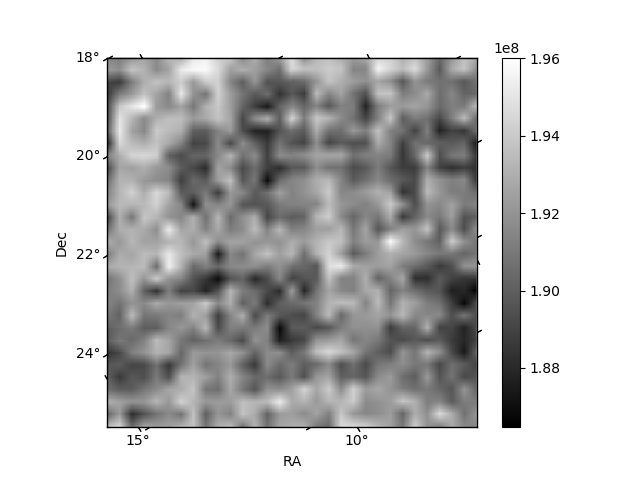
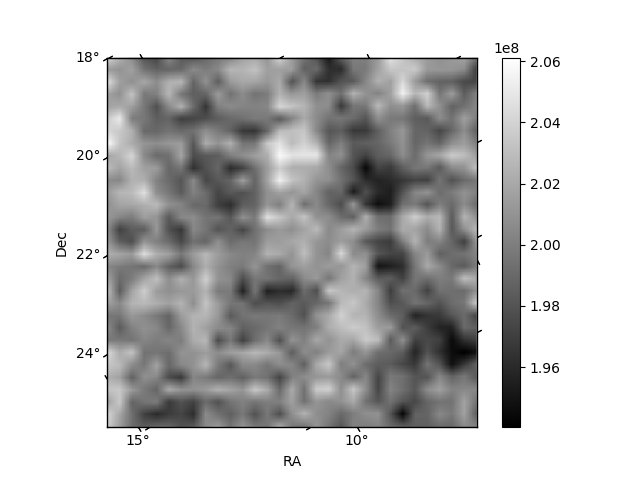
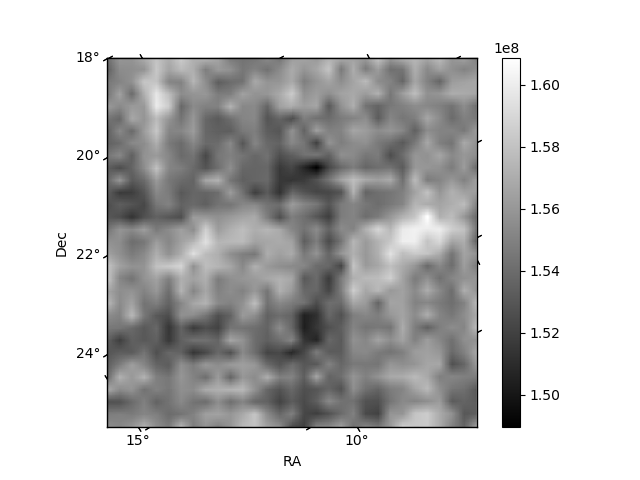
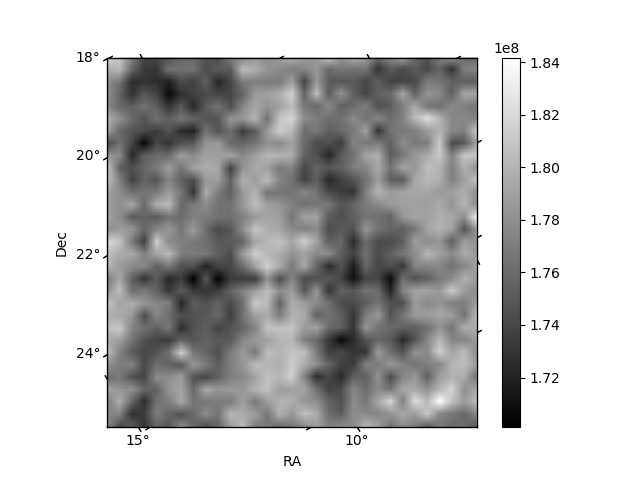
Histogram calculated using DETX and DETY for each event in the final _common_clean file
| Quadrant A | 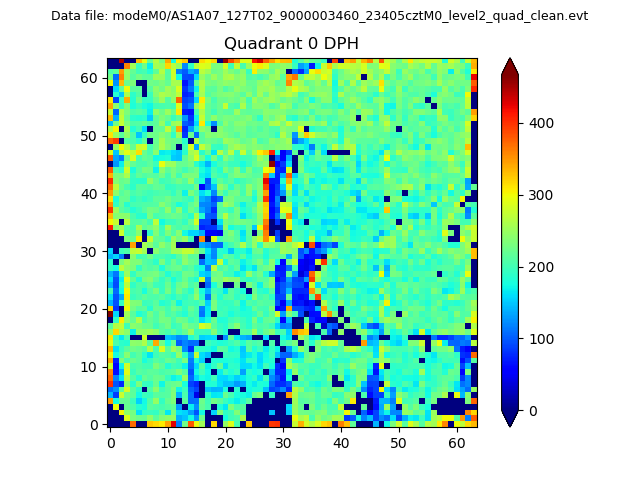 |
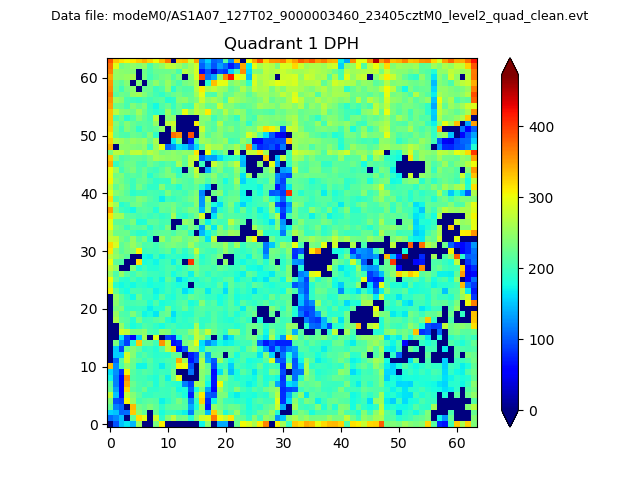 |
Quadrant B |
|---|---|---|---|
| Quadrant D | 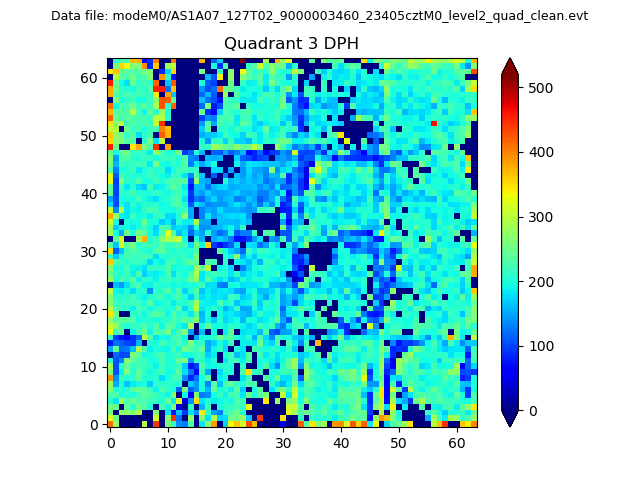 |
 |
Quadrant C |
| Plot type | Count rate plots | Images |
|---|---|---|
| Comparison with Poisson distribution Blue bars denote a histogram of data divided into 1 sec bins. Red curve is a Poisson curve with rate = median count rate of data. |
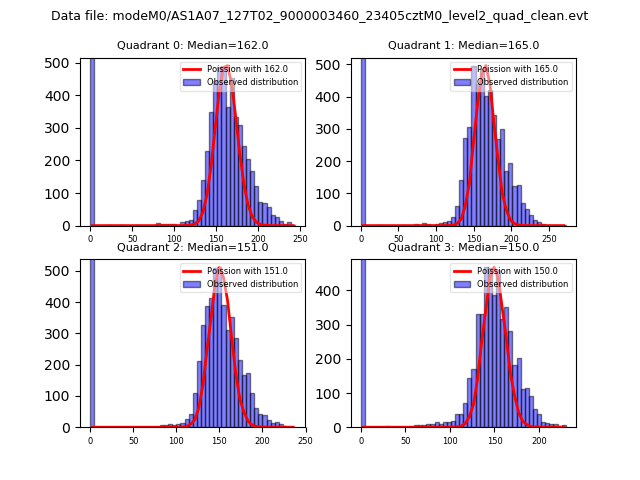 |
 |
| Quadrant-wise count rates Data is divided into 100 sec bins |
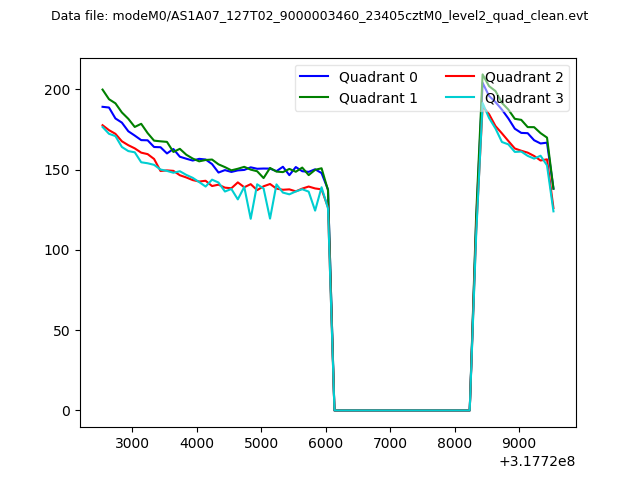 |
|
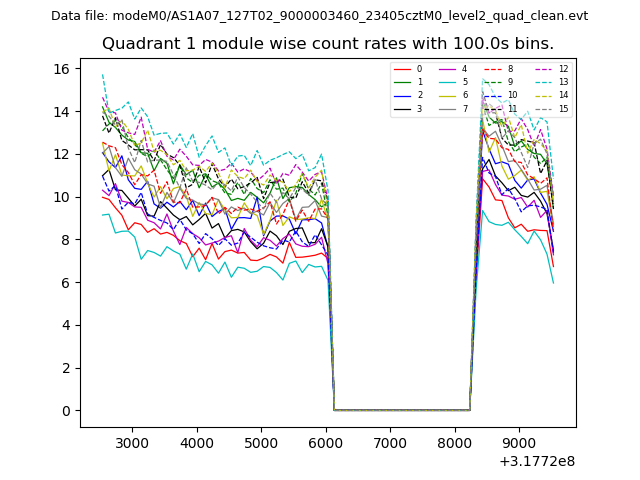
| Module-wise count rates for Quadrant A Data is divided into 100 sec bins |
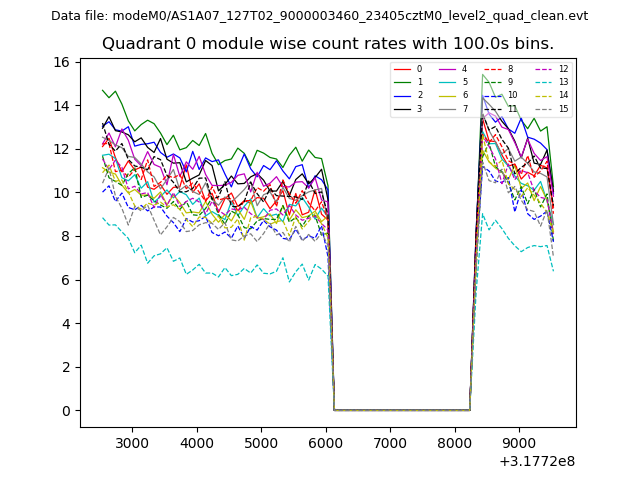 |
 |
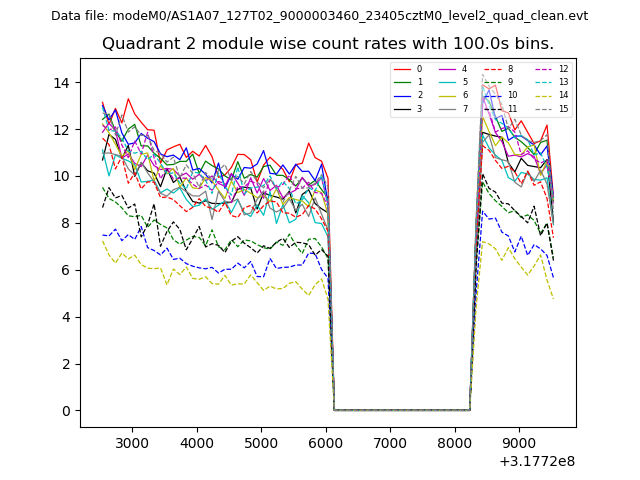
| Module-wise count rates for Quadrant B Data is divided into 100 sec bins |
 |
 |
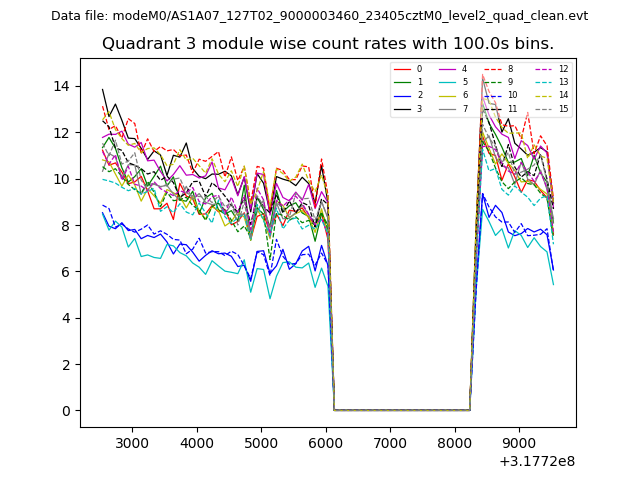
| Module-wise count rates for Quadrant C Data is divided into 100 sec bins |
 |
 |
| Module-wise count rates for Quadrant D Data is divided into 100 sec bins |
 |
 |
| Parameter | Plot |
|---|---|
| CZT HV Monitor | 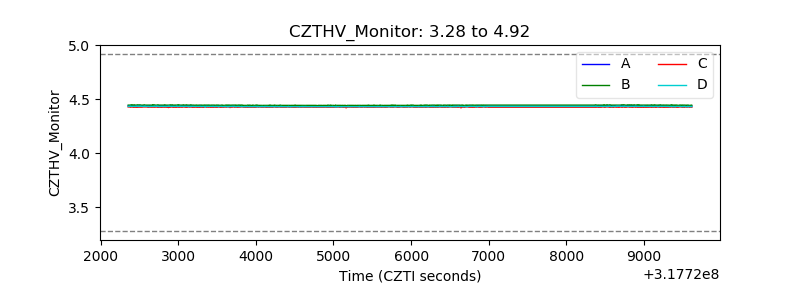 |
| D_VDD | 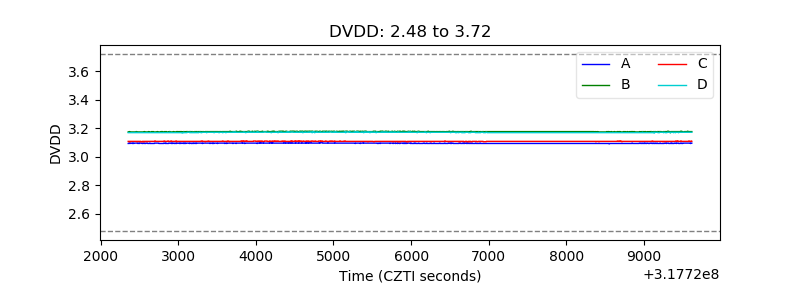 |
| Temperature 1 | 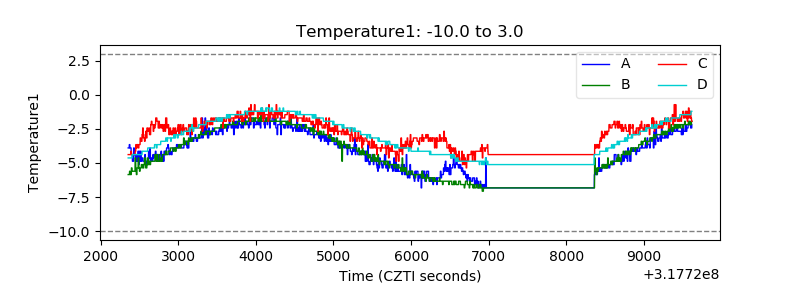 |
| Veto HV Monitor | 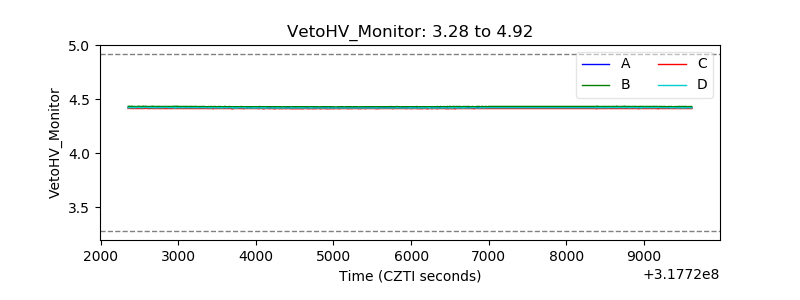 |
| Veto LLD | 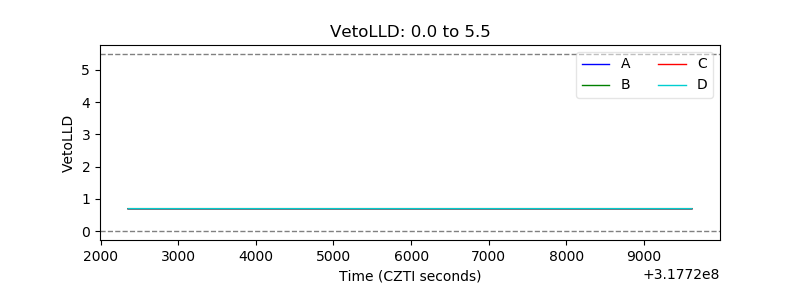 |
| Alpha Counter | 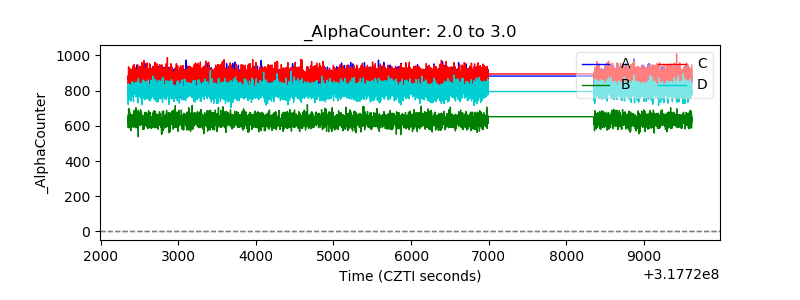 |
| _CPM_Rate | 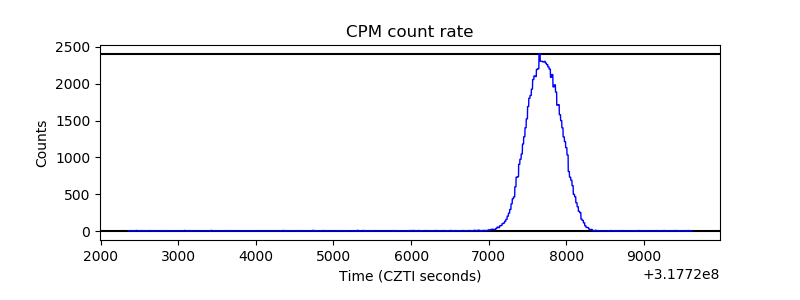 |
| CZT Counter | 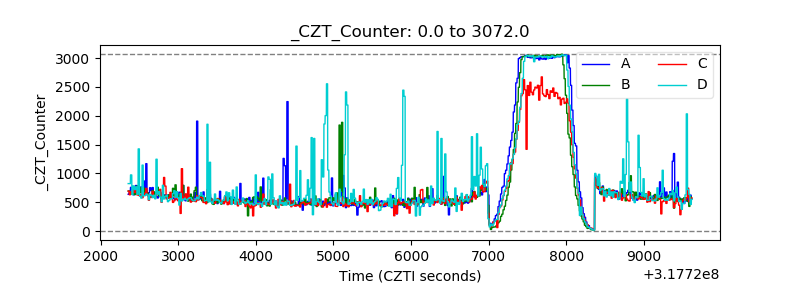 |
| +2.5 Volts monitor |  |
| +5 Volts monitor |  |
| _ROLL_ROT | 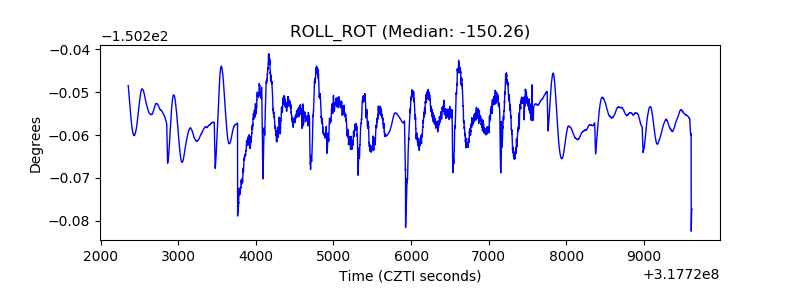 |
| _Roll_DEC | 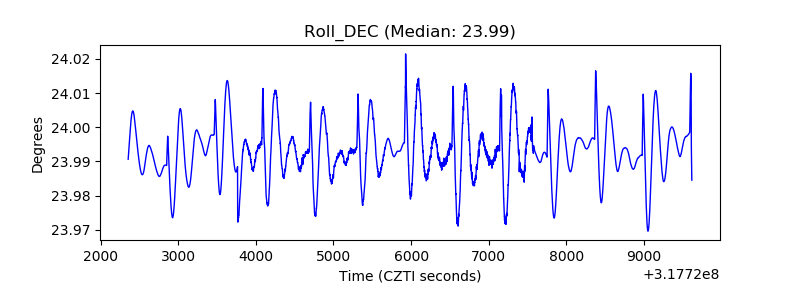 |
| _Roll_RA | 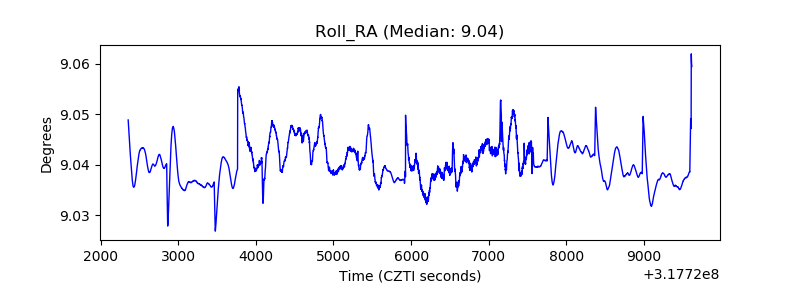 |
| Veto Counter | 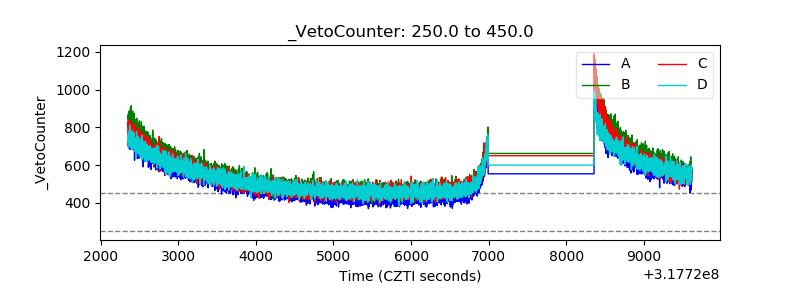 |