| Param | Original file | Final file |
|---|---|---|
| Filename | modeM0/AS1A07_127T02_9000003460_23406cztM0_level2.evt | modeM0/AS1A07_127T02_9000003460_23406cztM0_level2_quad_clean.evt |
| Size (bytes) | 589,570,560 | 111,542,400 |
| Size | 562.3 MB | 106.4 MB |
| Events in quadrant A | 6,223,947 | 735,309 |
| Events in quadrant B | 3,392,398 | 790,937 |
| Events in quadrant C | 3,216,201 | 725,736 |
| Events in quadrant D | 4,609,311 | 699,905 |
| Mode M9 | |||
|---|---|---|---|
| Quadrant | BADHDUFLAG | Total packets | Discarded packets |
| A | 0 | 14 | 0 |
| B | 0 | 14 | 0 |
| C | 0 | 14 | 0 |
| D | 0 | 14 | 0 |
| Mode M0 | |||
|---|---|---|---|
| Quadrant | BADHDUFLAG | Total packets | Discarded packets |
| A | 0 | 22934 | 274 |
| B | 0 | 13998 | 154 |
| C | 0 | 13331 | 133 |
| D | 0 | 17796 | 286 |
| Mode SS | |||
|---|---|---|---|
| Quadrant | BADHDUFLAG | Total packets | Discarded packets |
| A | 0 | 126 | 0 |
| B | 0 | 126 | 0 |
| C | 0 | 126 | 0 |
| D | 0 | 126 | 0 |
| Quadrant | Total seconds | Saturated seconds | Saturation percentage |
|---|---|---|---|
| A | 6076 | 849 | 13.973009% |
| B | 6104 | 96 | 1.572739% |
| C | 6106 | 98 | 1.604979% |
| D | 6092 | 431 | 7.074852% |
Noise dominated data is calculated using 1-second bins in cleaned event files. If a bin has >2000 counts, and if more than 50% of those come from <1% of pixels, then it is considered to be noise-dominated and hence unusable.
| Quadrant | # 1 sec bins | Bins with >0 counts | Bins with >2000 counts | High rate bins dominated by noise | Noise dominated (total time) | Noise dominated (detector-on time) | Marked lightcurve |
|---|---|---|---|---|---|---|---|
| A | 7526 | 6149 | 701 | 701 | 9.31% | 11.40% | 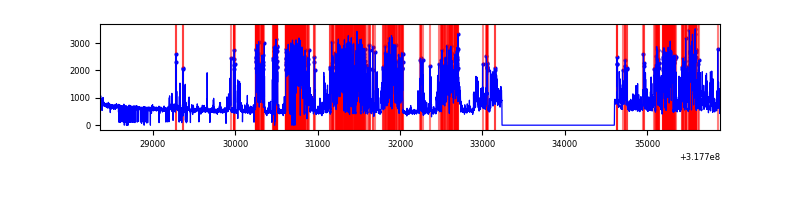 |
| B | 7527 | 6159 | 3 | 3 | 0.04% | 0.05% | 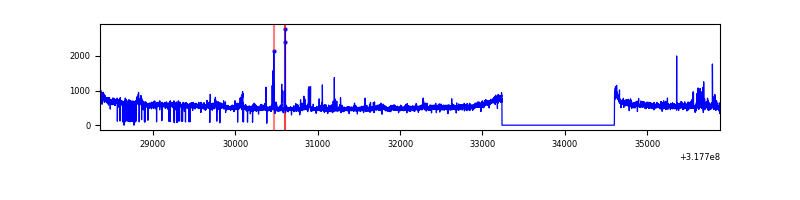 |
| C | 7527 | 6157 | 0 | 0 | 0.00% | 0.00% | 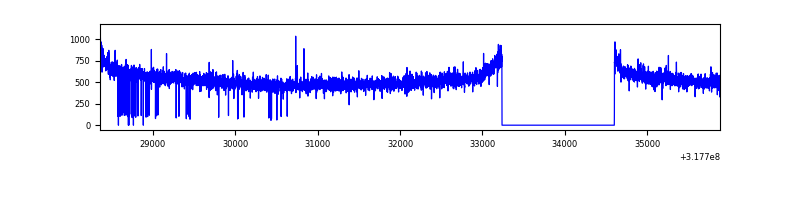 |
| D | 7527 | 6155 | 424 | 424 | 5.63% | 6.89% | 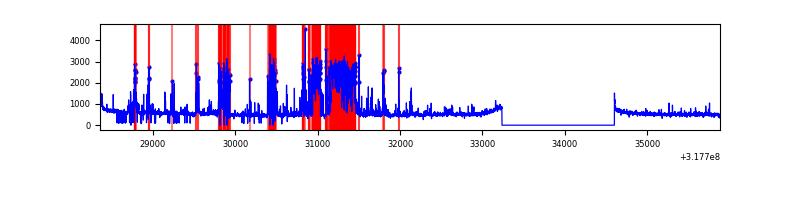 |
Top three noisy pixels from each quadrant. If the there are fewer than three noisy pixels in the level2.evt file, extra rows are filled as -1
| Pixel properties | Quadrant properties | ||||||
|---|---|---|---|---|---|---|---|
| Quadrant | DetID | PixID | Counts | Sigma | Mean | Median | Sigma |
| A | 6 | 16 | 3064574 | 19005.03 | 820 | 806 | 161.2 |
| A | 13 | 254 | 9162 | 51.83 | 820 | 806 | 161.2 |
| A | 0 | 226 | 7104 | 39.07 | 820 | 806 | 161.2 |
| B | 0 | 189 | 78698 | 494.53 | 837 | 819 | 157.5 |
| B | 0 | 190 | 35942 | 223.03 | 837 | 819 | 157.5 |
| B | 12 | 111 | 17795 | 107.8 | 837 | 819 | 157.5 |
| C | 14 | 238 | 130973 | 718.66 | 787 | 793 | 181.1 |
| C | 2 | 16 | 9595 | 48.59 | 787 | 793 | 181.1 |
| C | 13 | 61 | 5466 | 25.79 | 787 | 793 | 181.1 |
| D | 12 | 227 | 1104128 | 5729.82 | 800 | 780 | 192.6 |
| D | 1 | 52 | 437261 | 2266.7 | 800 | 780 | 192.6 |
| D | 2 | 234 | 22521 | 112.9 | 800 | 780 | 192.6 |
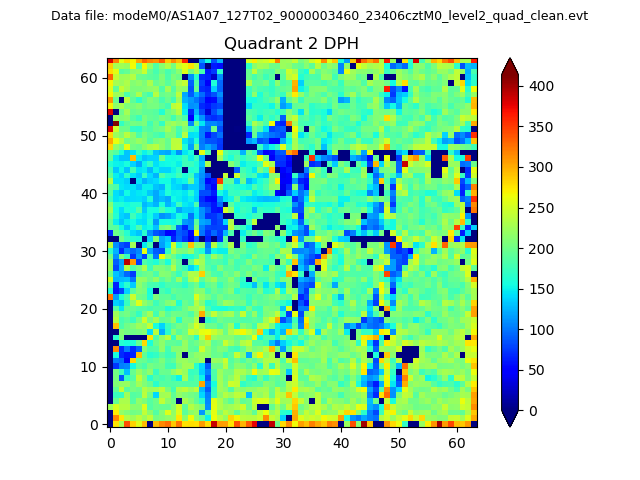
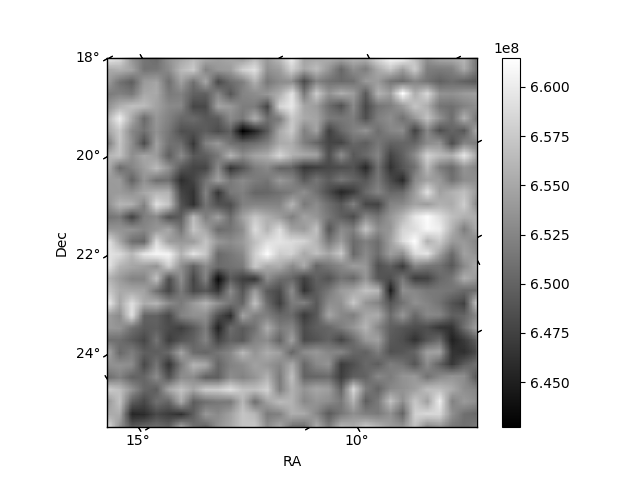
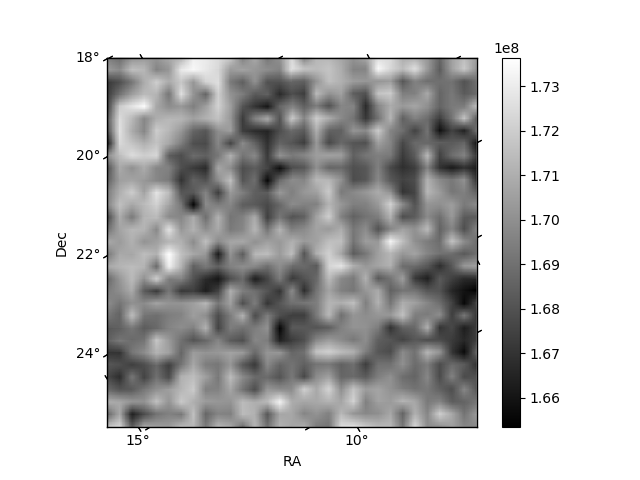
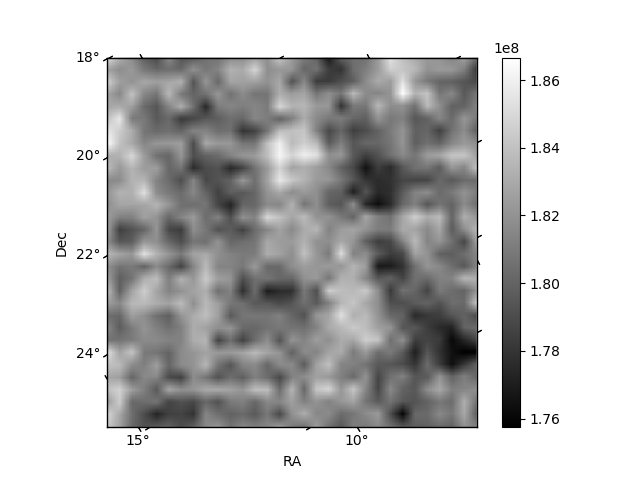
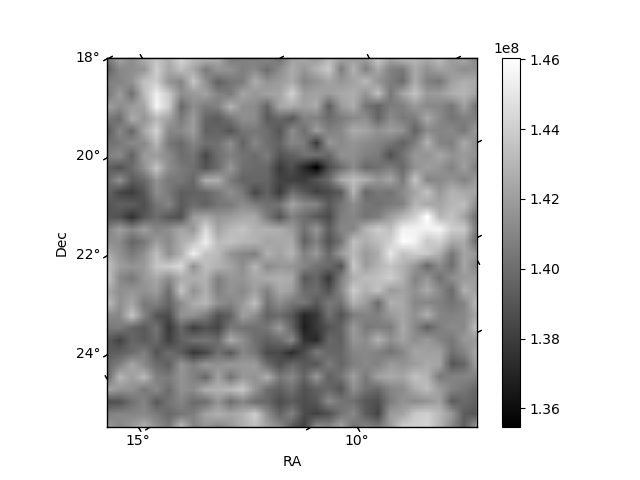
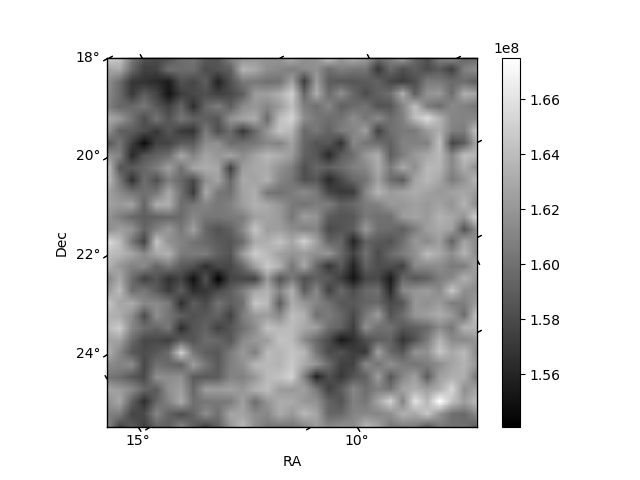
Histogram calculated using DETX and DETY for each event in the final _common_clean file
| Quadrant A | 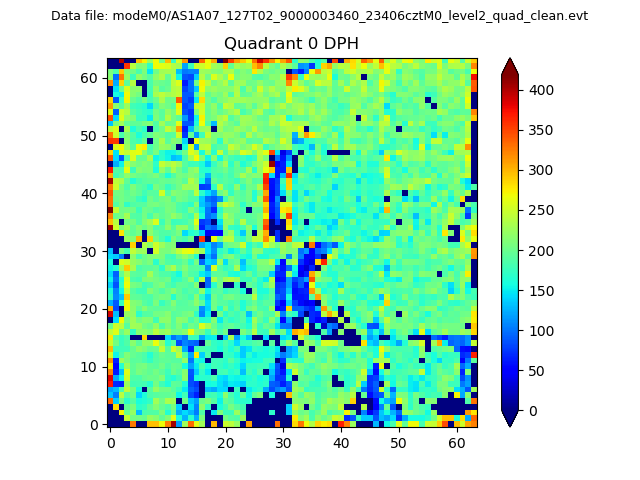 |
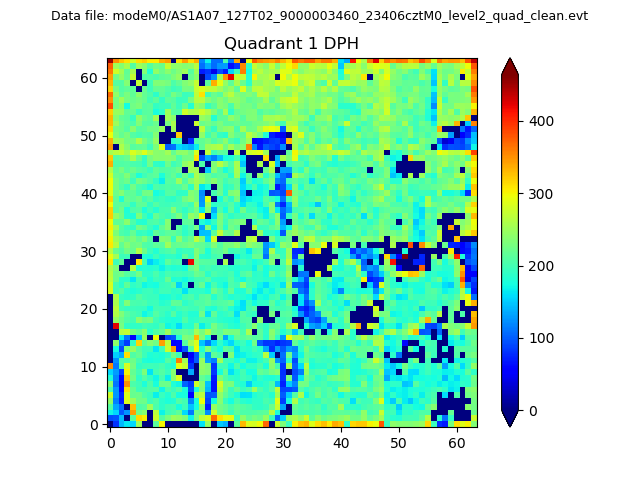 |
Quadrant B |
|---|---|---|---|
| Quadrant D | 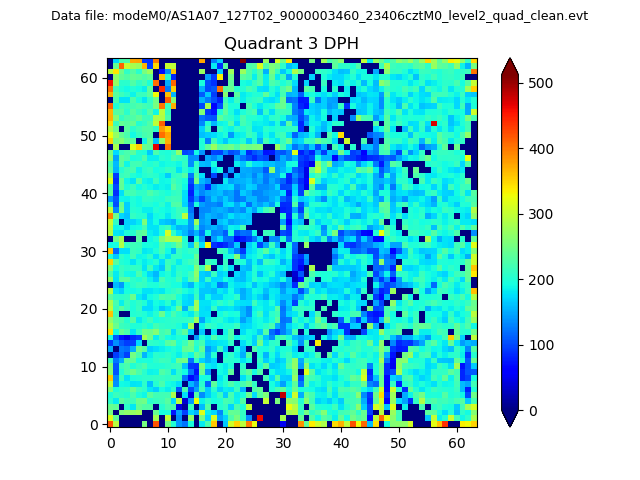 |
 |
Quadrant C |
| Plot type | Count rate plots | Images |
|---|---|---|
| Comparison with Poisson distribution Blue bars denote a histogram of data divided into 1 sec bins. Red curve is a Poisson curve with rate = median count rate of data. |
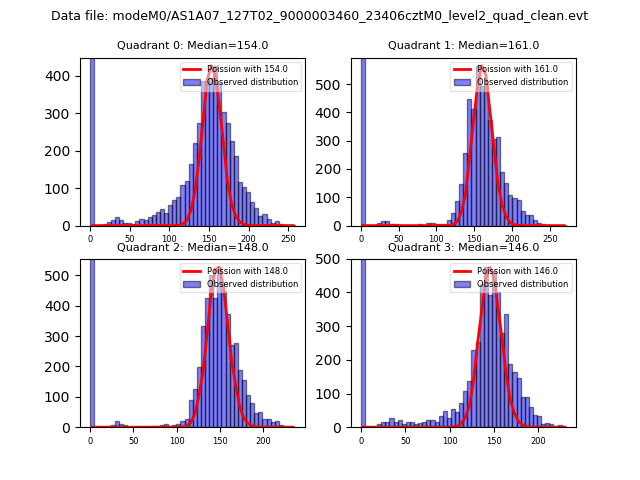 |
 |
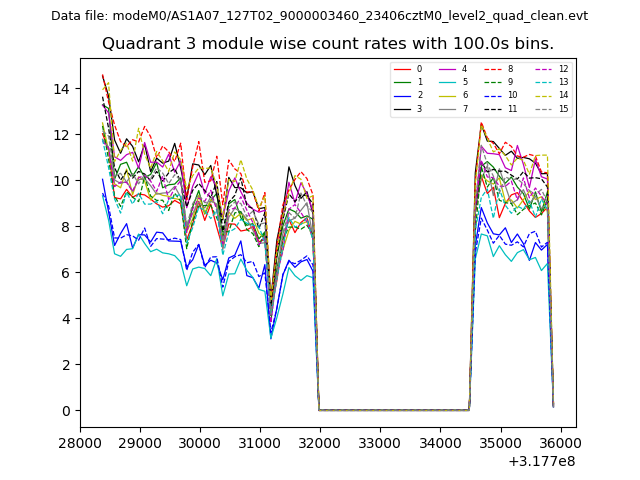
| Quadrant-wise count rates Data is divided into 100 sec bins |
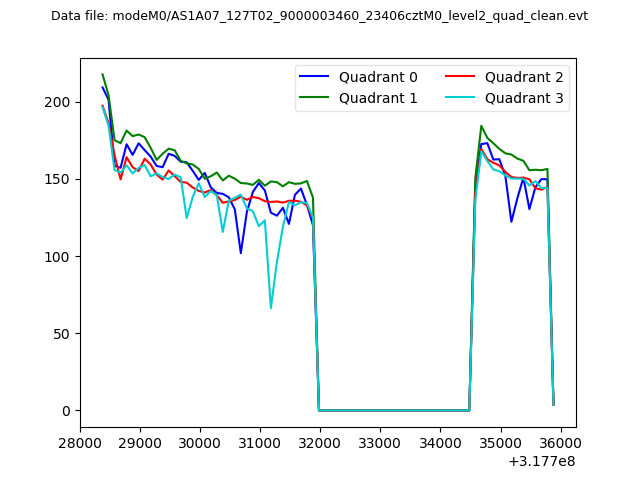 |
|
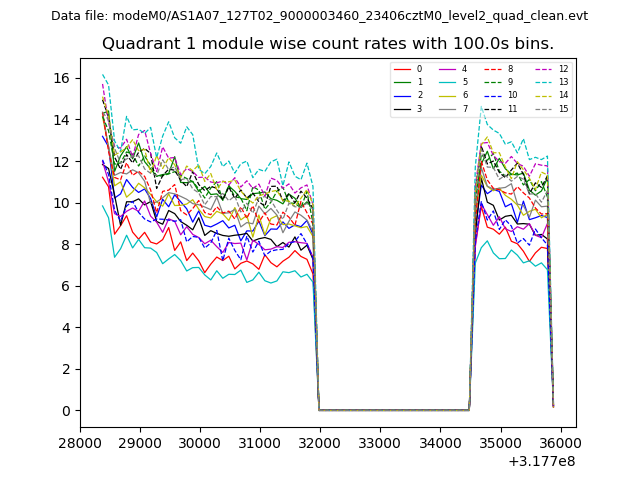
| Module-wise count rates for Quadrant A Data is divided into 100 sec bins |
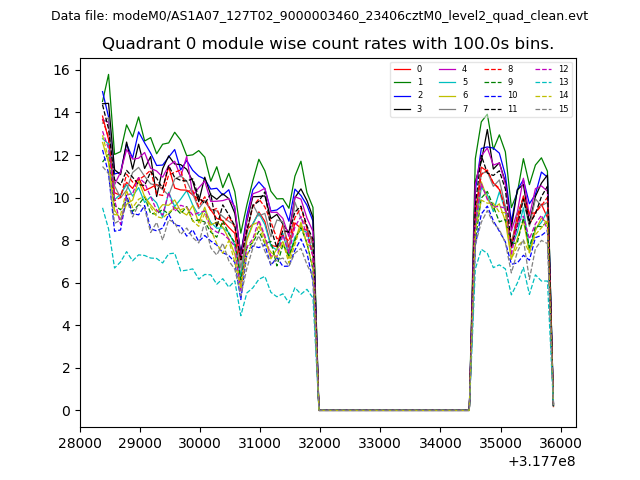 |
 |
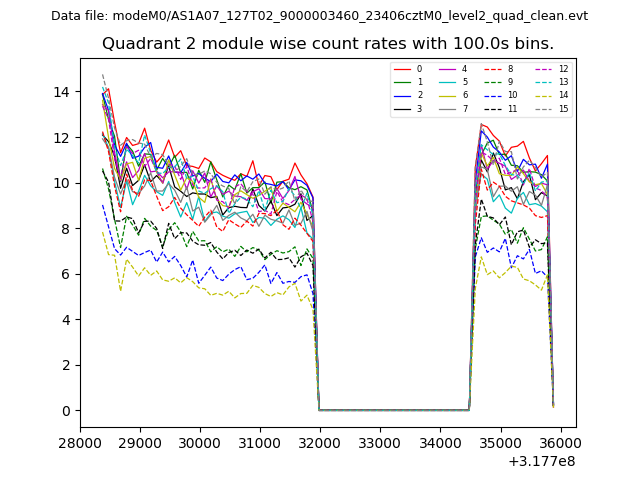
| Module-wise count rates for Quadrant B Data is divided into 100 sec bins |
 |
 |
| Module-wise count rates for Quadrant C Data is divided into 100 sec bins |
 |
 |
| Module-wise count rates for Quadrant D Data is divided into 100 sec bins |
 |
 |
| Parameter | Plot |
|---|---|
| CZT HV Monitor | 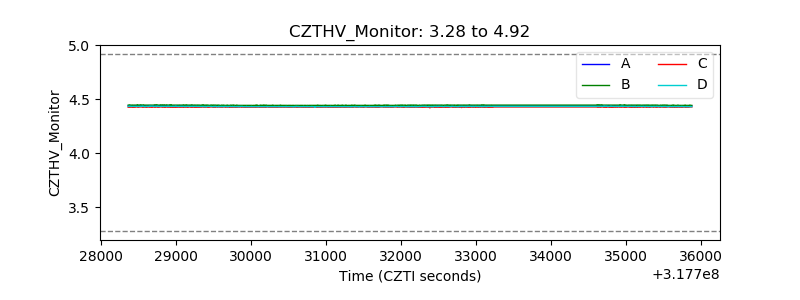 |
| D_VDD | 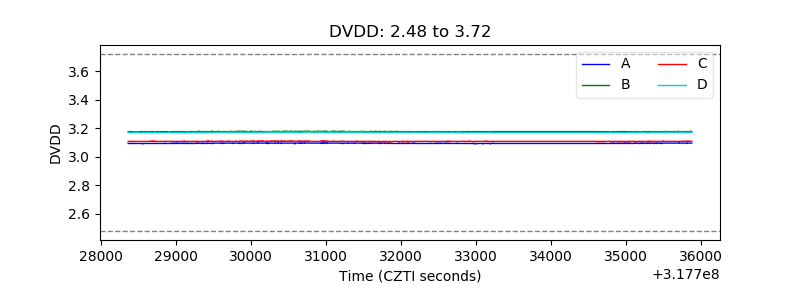 |
| Temperature 1 | 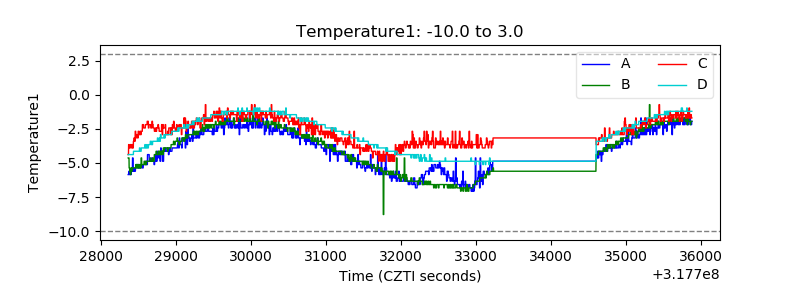 |
| Veto HV Monitor | 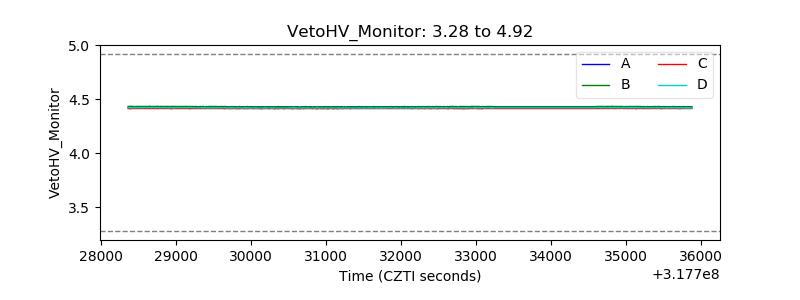 |
| Veto LLD | 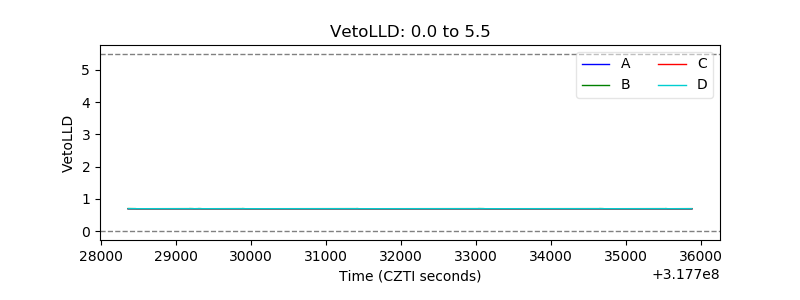 |
| Alpha Counter | 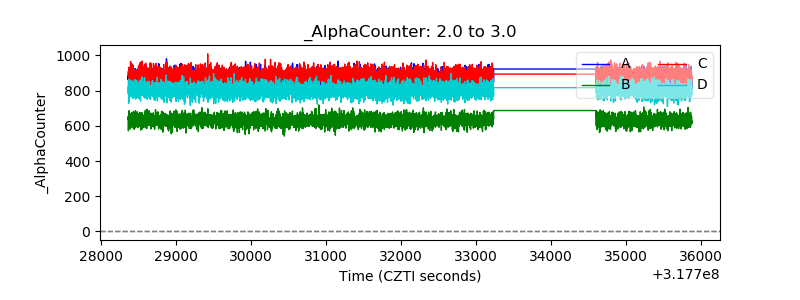 |
| _CPM_Rate | 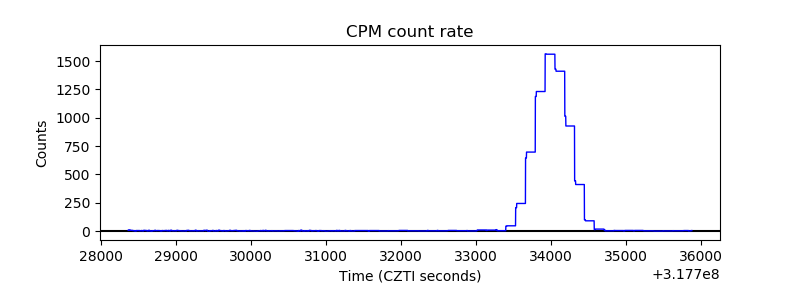 |
| CZT Counter | 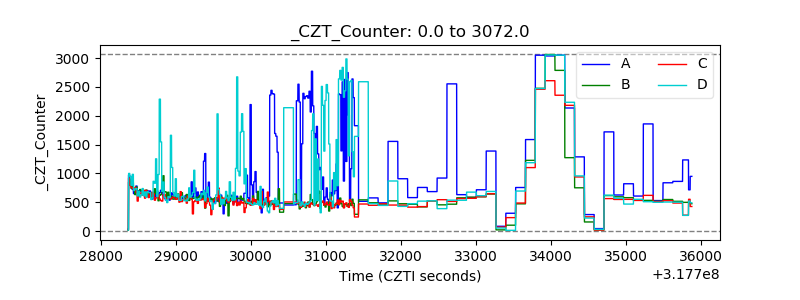 |
| +2.5 Volts monitor | 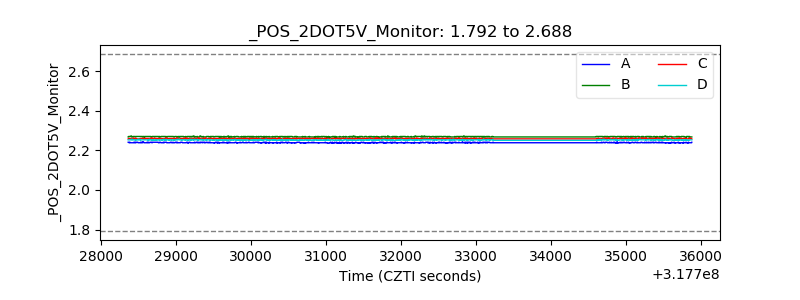 |
| +5 Volts monitor |  |
| _ROLL_ROT | 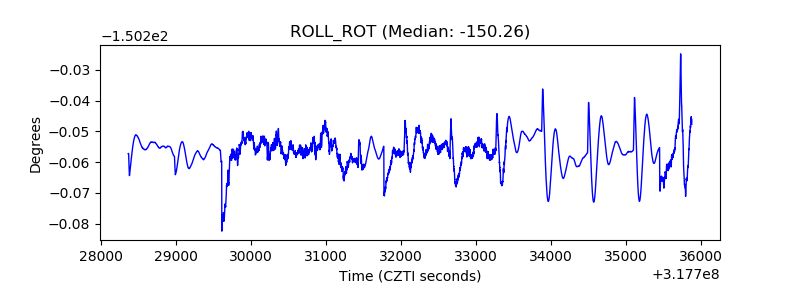 |
| _Roll_DEC | 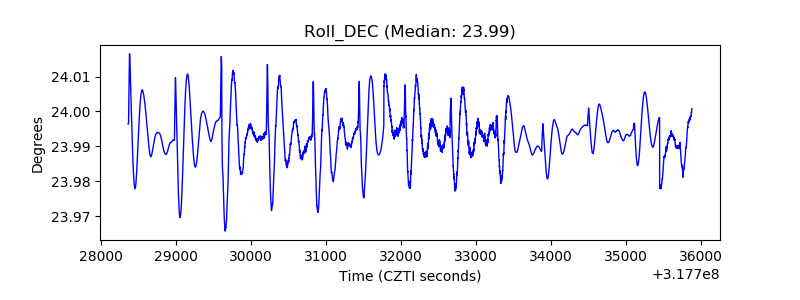 |
| _Roll_RA | 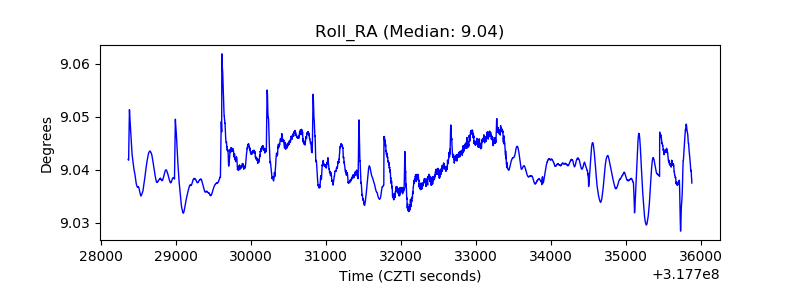 |
| Veto Counter | 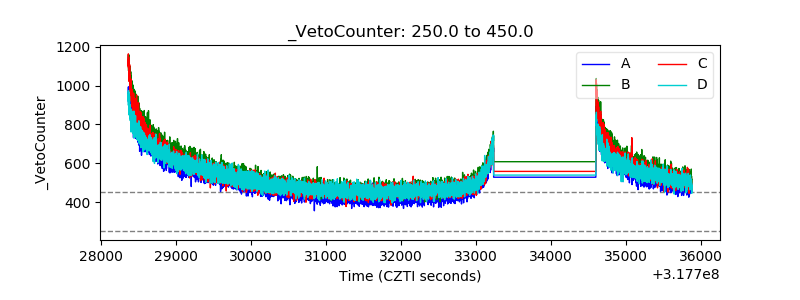 |