| Param | Original file | Final file |
|---|---|---|
| Filename | modeM0/AS1A07_127T02_9000003460_23407cztM0_level2.evt | modeM0/AS1A07_127T02_9000003460_23407cztM0_level2_quad_clean.evt |
| Size (bytes) | 492,727,680 | 93,536,640 |
| Size | 469.9 MB | 89.2 MB |
| Events in quadrant A | 4,927,820 | 603,815 |
| Events in quadrant B | 3,209,643 | 631,277 |
| Events in quadrant C | 3,064,075 | 588,688 |
| Events in quadrant D | 3,310,055 | 586,109 |
| Mode M9 | |||
|---|---|---|---|
| Quadrant | BADHDUFLAG | Total packets | Discarded packets |
| A | 0 | 12 | 0 |
| B | 0 | 12 | 0 |
| C | 0 | 12 | 0 |
| D | 0 | 12 | 0 |
| Mode M0 | |||
|---|---|---|---|
| Quadrant | BADHDUFLAG | Total packets | Discarded packets |
| A | 0 | 18527 | 1 |
| B | 0 | 13173 | 1 |
| C | 0 | 12701 | 1 |
| D | 0 | 13588 | 1 |
| Mode SS | |||
|---|---|---|---|
| Quadrant | BADHDUFLAG | Total packets | Discarded packets |
| A | 0 | 122 | 0 |
| B | 0 | 122 | 0 |
| C | 0 | 122 | 0 |
| D | 0 | 122 | 0 |
| Quadrant | Total seconds | Saturated seconds | Saturation percentage |
|---|---|---|---|
| A | 6056 | 493 | 8.140687% |
| B | 6056 | 106 | 1.750330% |
| C | 6057 | 95 | 1.568433% |
| D | 6057 | 93 | 1.535414% |
Noise dominated data is calculated using 1-second bins in cleaned event files. If a bin has >2000 counts, and if more than 50% of those come from <1% of pixels, then it is considered to be noise-dominated and hence unusable.
| Quadrant | # 1 sec bins | Bins with >0 counts | Bins with >2000 counts | High rate bins dominated by noise | Noise dominated (total time) | Noise dominated (detector-on time) | Marked lightcurve |
|---|---|---|---|---|---|---|---|
| A | 7251 | 6056 | 371 | 371 | 5.12% | 6.13% | 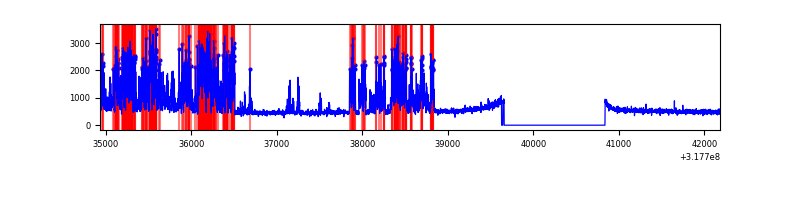 |
| B | 7251 | 6057 | 3 | 3 | 0.04% | 0.05% | 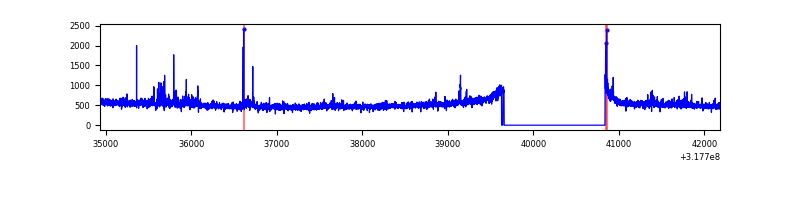 |
| C | 7252 | 6058 | 5 | 5 | 0.07% | 0.08% | 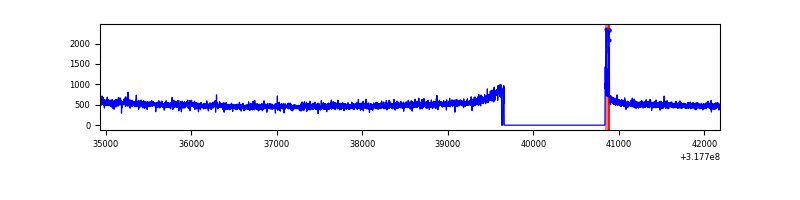 |
| D | 7252 | 6058 | 44 | 44 | 0.61% | 0.73% | 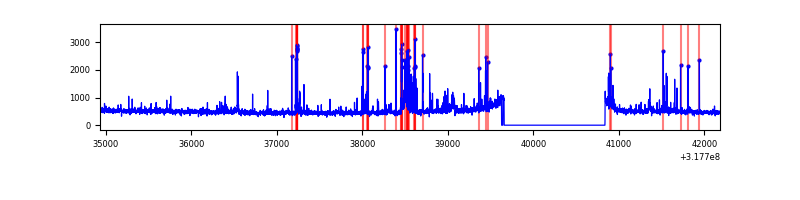 |
Top three noisy pixels from each quadrant. If the there are fewer than three noisy pixels in the level2.evt file, extra rows are filled as -1
| Pixel properties | Quadrant properties | ||||||
|---|---|---|---|---|---|---|---|
| Quadrant | DetID | PixID | Counts | Sigma | Mean | Median | Sigma |
| A | 6 | 16 | 1915299 | 12325.0 | 782 | 767 | 155.3 |
| A | 13 | 254 | 9893 | 58.75 | 782 | 767 | 155.3 |
| A | 0 | 226 | 6758 | 38.57 | 782 | 767 | 155.3 |
| B | 0 | 189 | 97102 | 654.09 | 784 | 767 | 147.3 |
| B | 0 | 190 | 34030 | 225.85 | 784 | 767 | 147.3 |
| B | 12 | 111 | 17448 | 113.26 | 784 | 767 | 147.3 |
| C | 14 | 238 | 119553 | 687.56 | 744 | 750 | 172.8 |
| C | 0 | 10 | 30971 | 174.9 | 744 | 750 | 172.8 |
| C | 7 | 247 | 5966 | 30.19 | 744 | 750 | 172.8 |
| D | 1 | 52 | 324022 | 1783.18 | 766 | 747 | 181.3 |
| D | 9 | 85 | 33867 | 182.69 | 766 | 747 | 181.3 |
| D | 12 | 227 | 24416 | 130.56 | 766 | 747 | 181.3 |
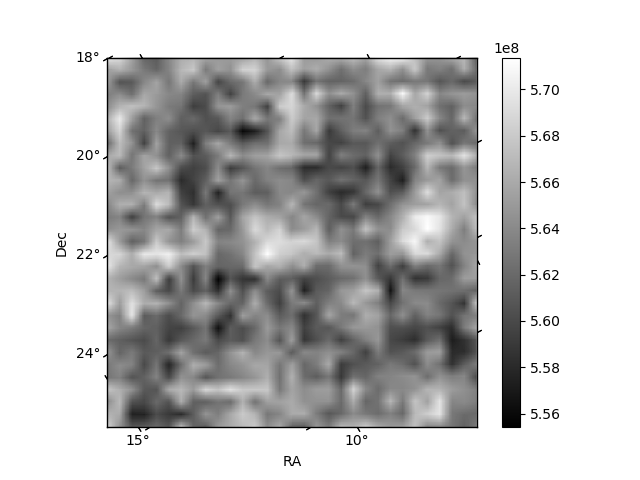
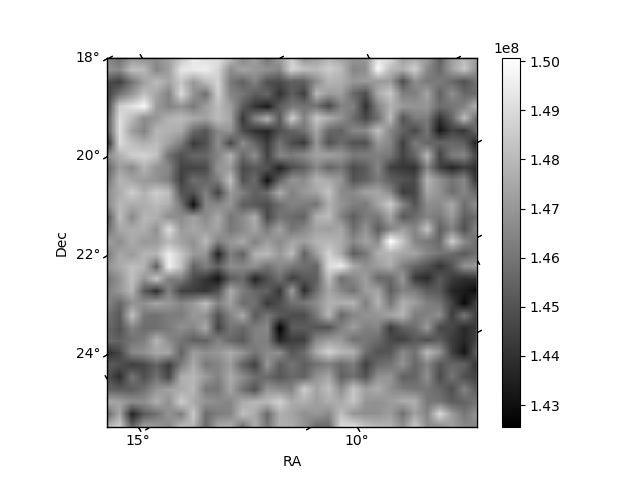
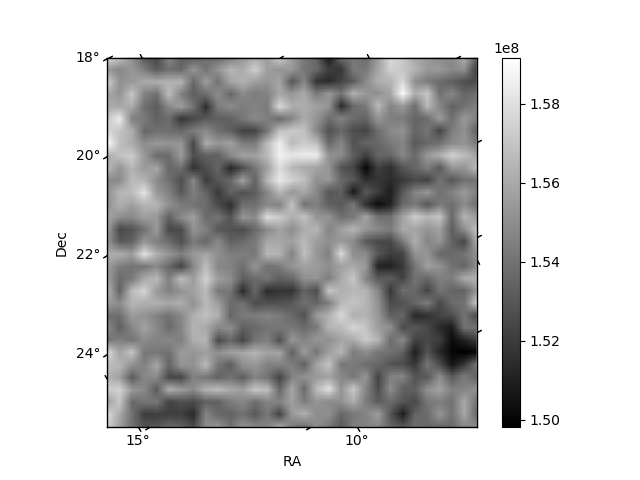
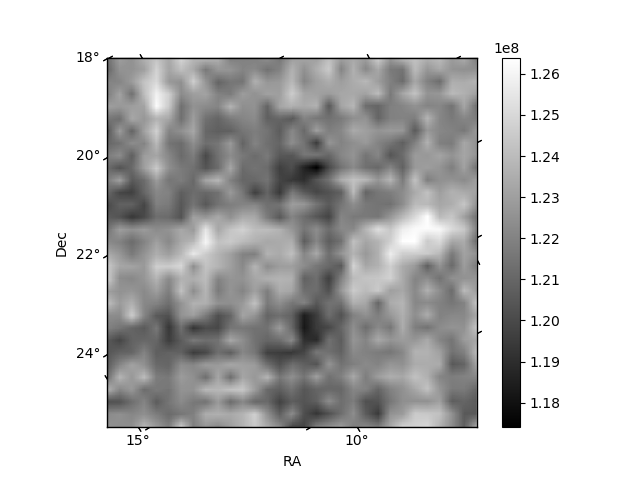
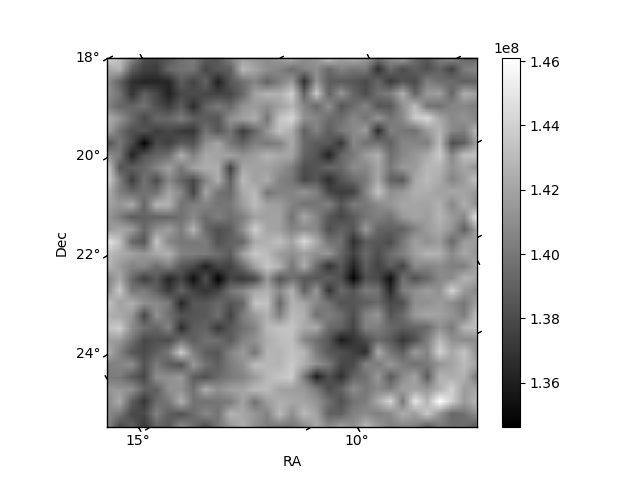
Histogram calculated using DETX and DETY for each event in the final _common_clean file
| Quadrant A | 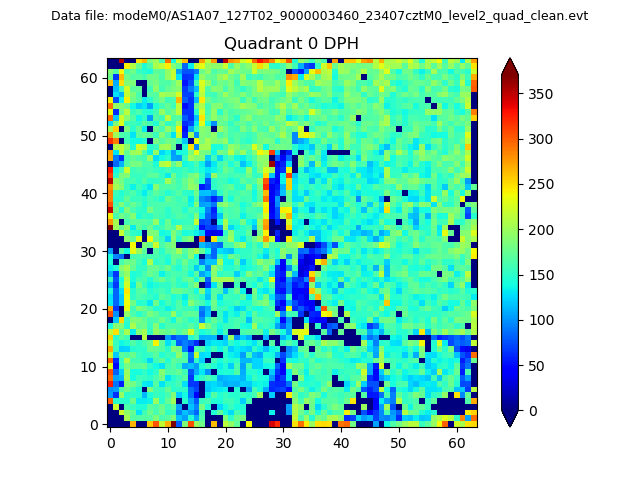 |
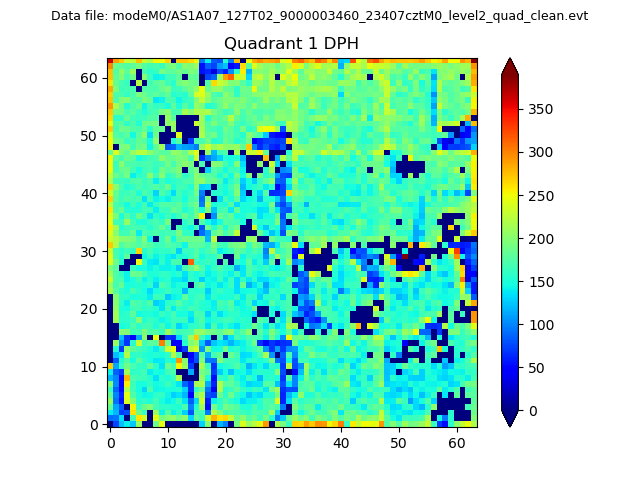 |
Quadrant B |
|---|---|---|---|
| Quadrant D | 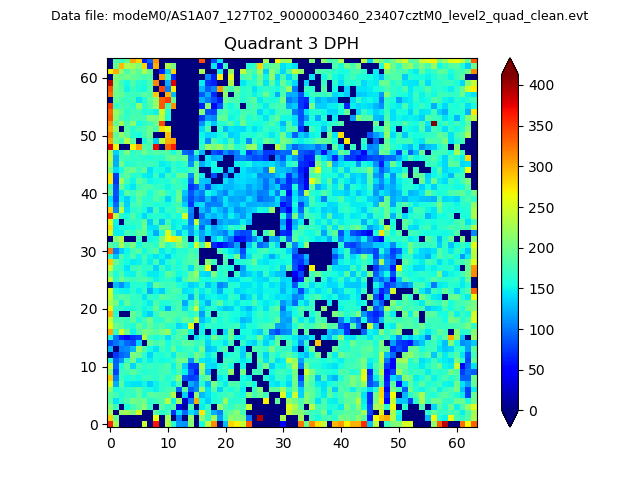 |
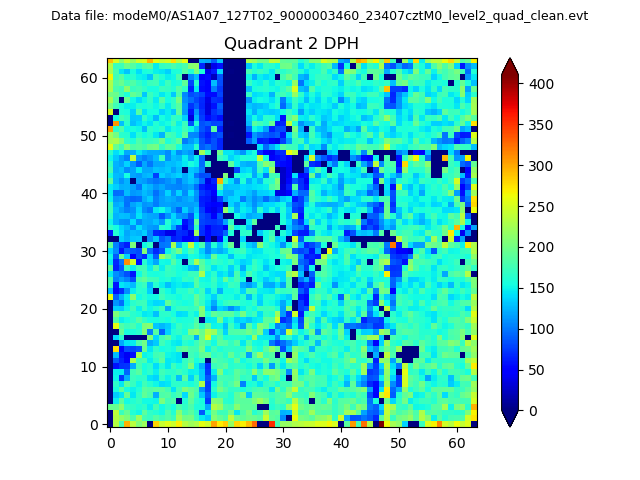 |
Quadrant C |
| Plot type | Count rate plots | Images |
|---|---|---|
| Comparison with Poisson distribution Blue bars denote a histogram of data divided into 1 sec bins. Red curve is a Poisson curve with rate = median count rate of data. |
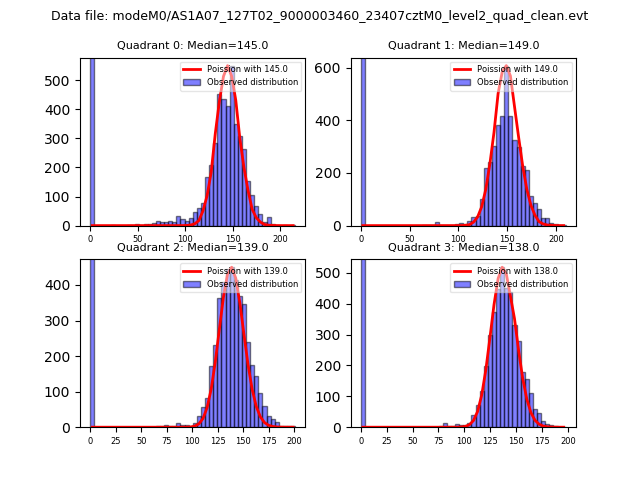 |
 |
| Quadrant-wise count rates Data is divided into 100 sec bins |
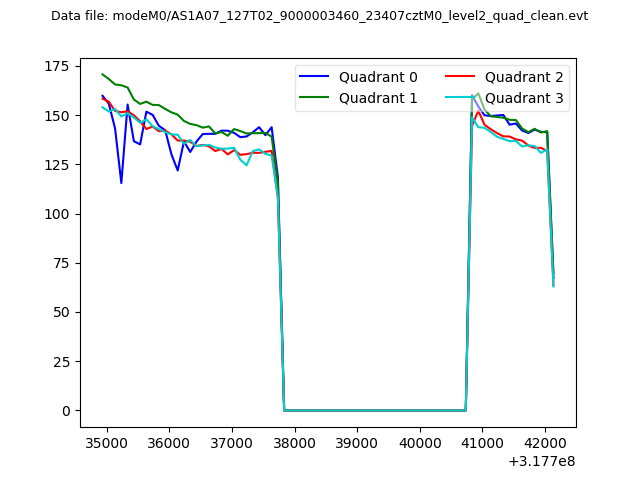 |
|
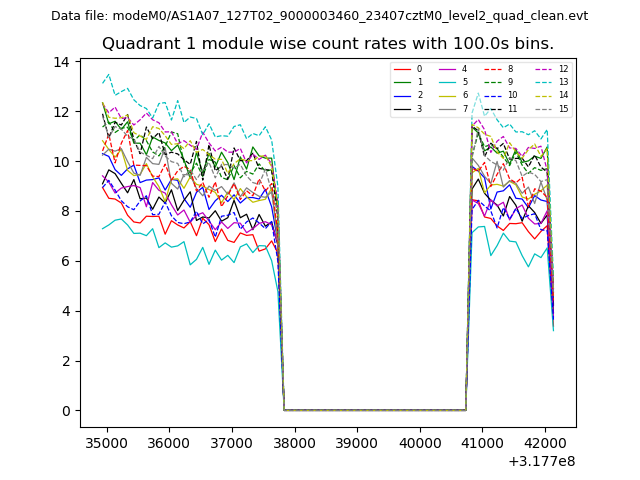
| Module-wise count rates for Quadrant A Data is divided into 100 sec bins |
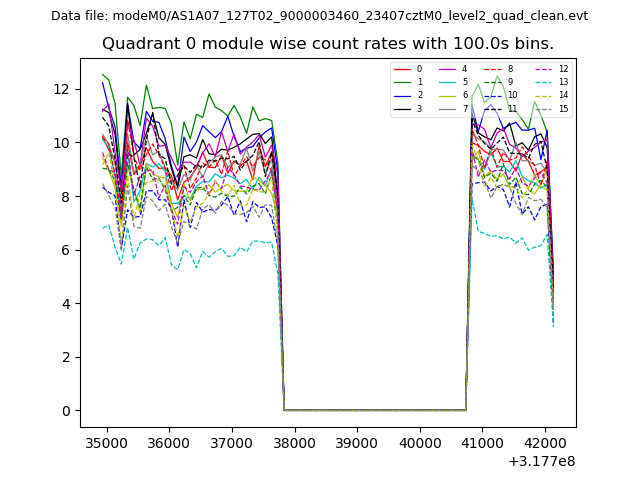 |
 |
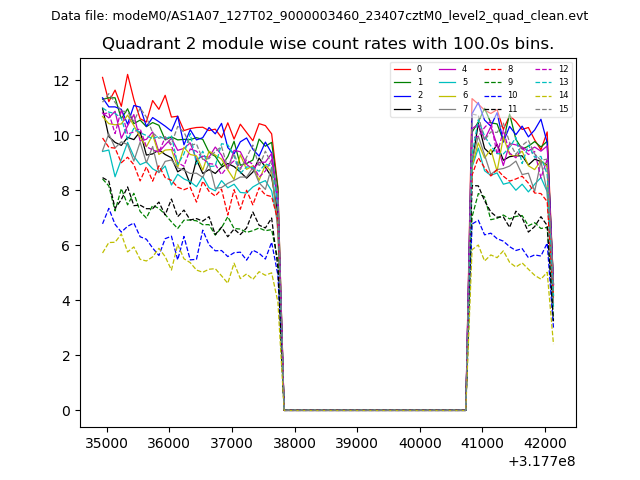
| Module-wise count rates for Quadrant B Data is divided into 100 sec bins |
 |
 |
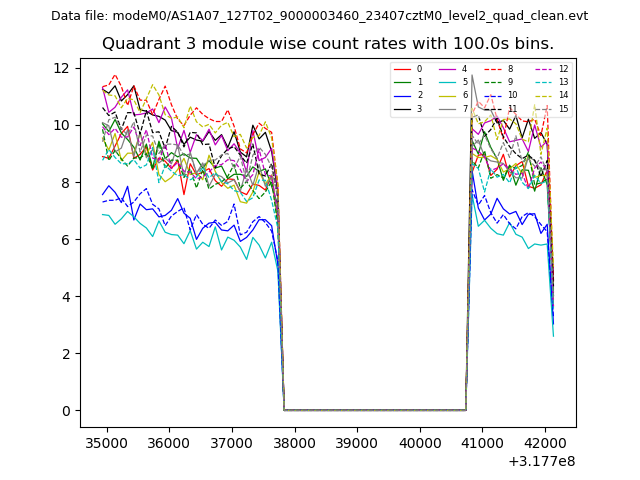
| Module-wise count rates for Quadrant C Data is divided into 100 sec bins |
 |
 |
| Module-wise count rates for Quadrant D Data is divided into 100 sec bins |
 |
 |
| Parameter | Plot |
|---|---|
| CZT HV Monitor | 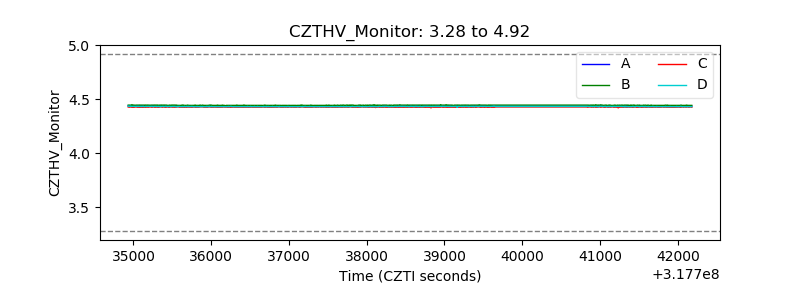 |
| D_VDD | 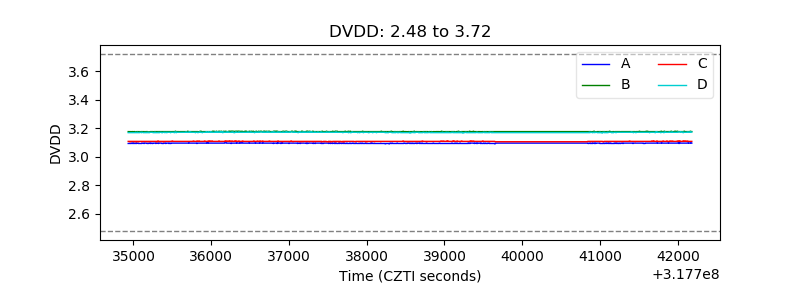 |
| Temperature 1 | 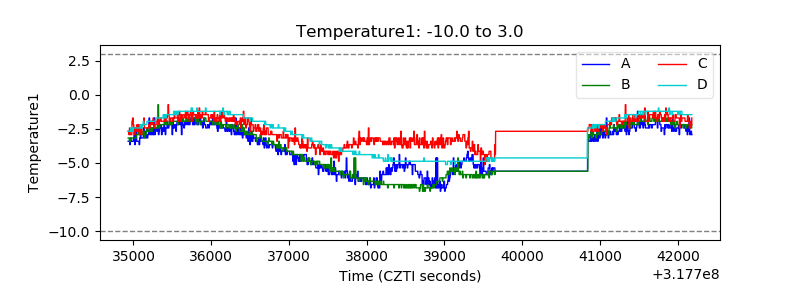 |
| Veto HV Monitor | 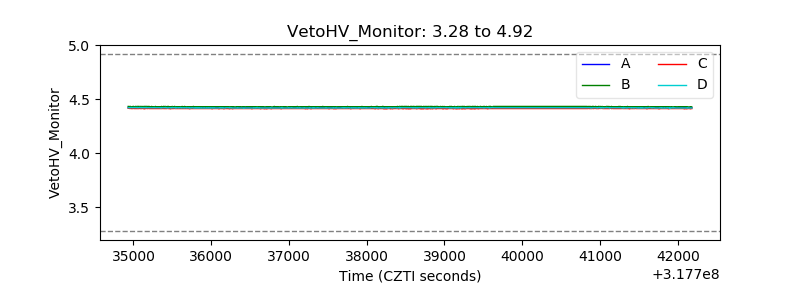 |
| Veto LLD | 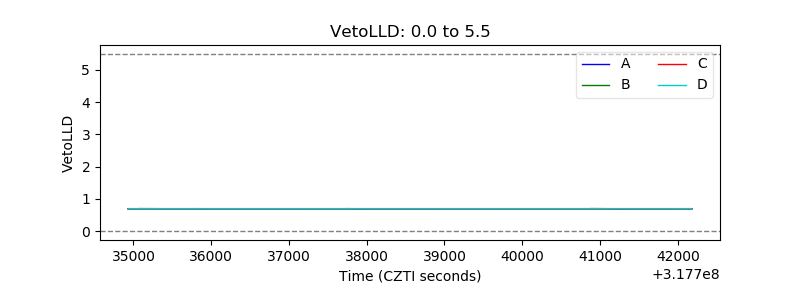 |
| Alpha Counter | 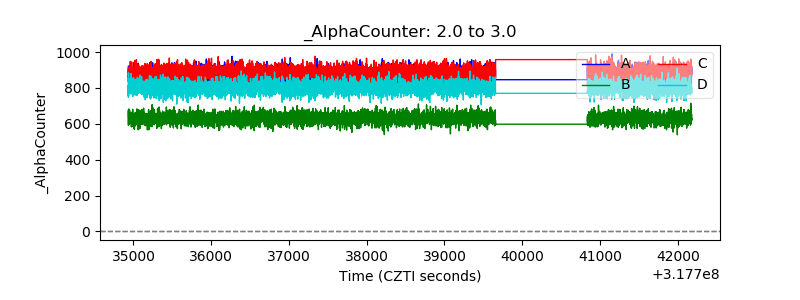 |
| _CPM_Rate | 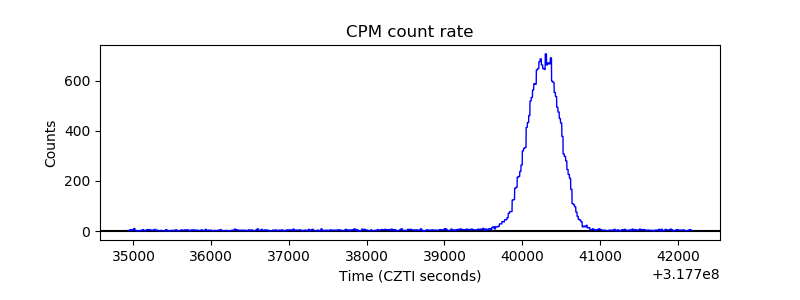 |
| CZT Counter | 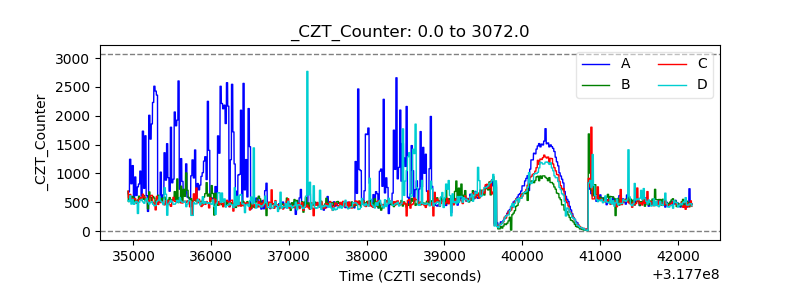 |
| +2.5 Volts monitor |  |
| +5 Volts monitor |  |
| _ROLL_ROT | 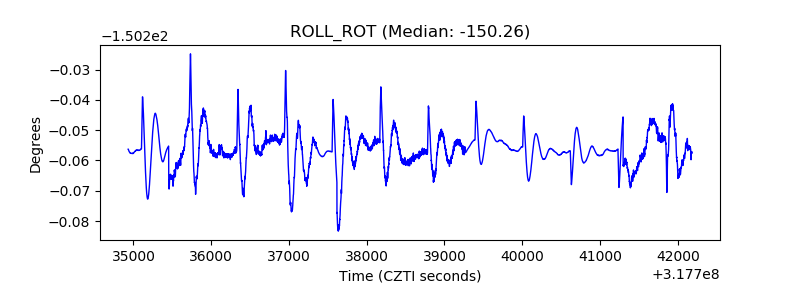 |
| _Roll_DEC | 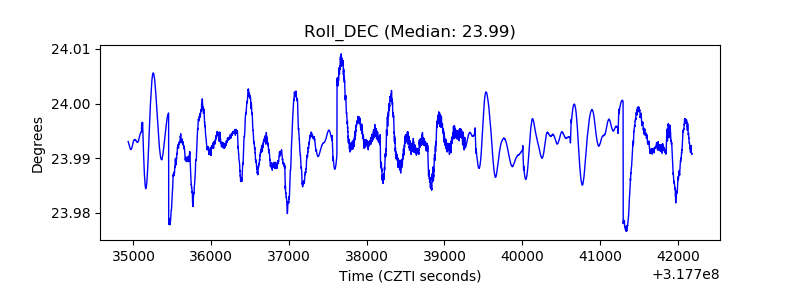 |
| _Roll_RA | 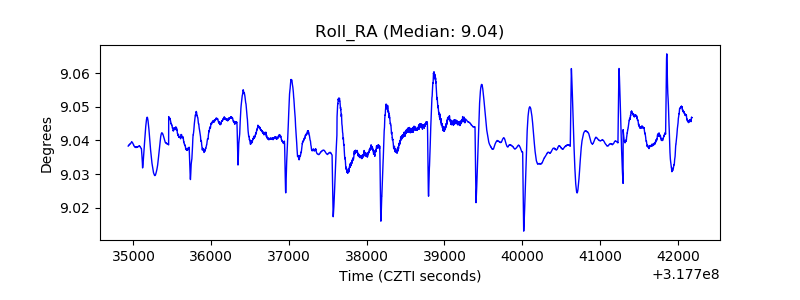 |
| Veto Counter | 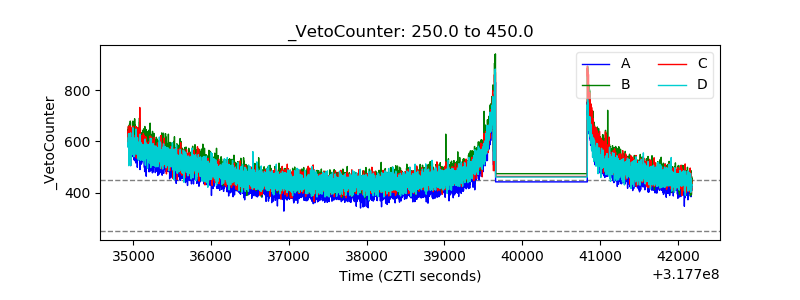 |