| Param | Original file | Final file |
|---|---|---|
| Filename | modeM0/AS1A07_127T02_9000003460_23408cztM0_level2.evt | modeM0/AS1A07_127T02_9000003460_23408cztM0_level2_quad_clean.evt |
| Size (bytes) | 463,875,840 | 95,832,000 |
| Size | 442.4 MB | 91.4 MB |
| Events in quadrant A | 3,306,019 | 625,566 |
| Events in quadrant B | 3,469,786 | 627,413 |
| Events in quadrant C | 3,365,664 | 591,842 |
| Events in quadrant D | 3,449,397 | 587,952 |
| Mode M9 | |||
|---|---|---|---|
| Quadrant | BADHDUFLAG | Total packets | Discarded packets |
| A | 0 | 8 | 0 |
| B | 0 | 9 | 0 |
| C | 0 | 9 | 0 |
| D | 0 | 9 | 0 |
| Mode M0 | |||
|---|---|---|---|
| Quadrant | BADHDUFLAG | Total packets | Discarded packets |
| A | 0 | 14009 | 2 |
| B | 0 | 14460 | 2 |
| C | 0 | 14145 | 2 |
| D | 0 | 14581 | 2 |
| Mode SS | |||
|---|---|---|---|
| Quadrant | BADHDUFLAG | Total packets | Discarded packets |
| A | 0 | 138 | 0 |
| B | 0 | 138 | 0 |
| C | 0 | 138 | 0 |
| D | 0 | 138 | 0 |
| Quadrant | Total seconds | Saturated seconds | Saturation percentage |
|---|---|---|---|
| A | 6731 | 83 | 1.233101% |
| B | 6731 | 97 | 1.441093% |
| C | 6731 | 116 | 1.723369% |
| D | 6731 | 73 | 1.084534% |
Noise dominated data is calculated using 1-second bins in cleaned event files. If a bin has >2000 counts, and if more than 50% of those come from <1% of pixels, then it is considered to be noise-dominated and hence unusable.
| Quadrant | # 1 sec bins | Bins with >0 counts | Bins with >2000 counts | High rate bins dominated by noise | Noise dominated (total time) | Noise dominated (detector-on time) | Marked lightcurve |
|---|---|---|---|---|---|---|---|
| A | 7601 | 6731 | 0 | 0 | 0.00% | 0.00% | 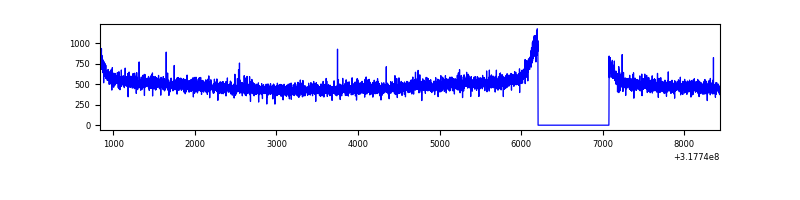 |
| B | 7601 | 6731 | 3 | 3 | 0.04% | 0.04% | 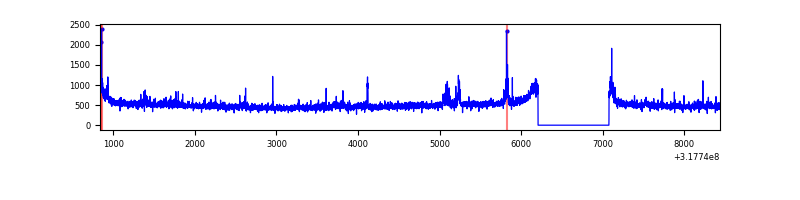 |
| C | 7601 | 6731 | 5 | 5 | 0.07% | 0.07% | 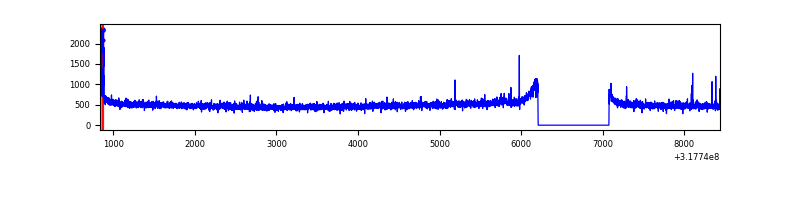 |
| D | 7601 | 6731 | 19 | 19 | 0.25% | 0.28% | 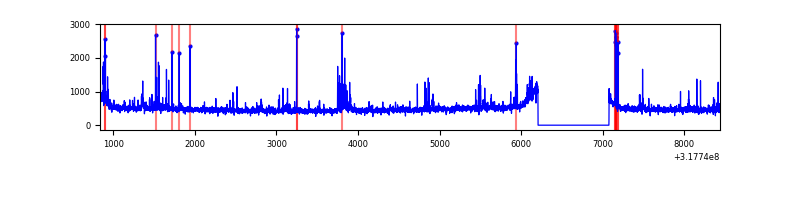 |
Top three noisy pixels from each quadrant. If the there are fewer than three noisy pixels in the level2.evt file, extra rows are filled as -1
| Pixel properties | Quadrant properties | ||||||
|---|---|---|---|---|---|---|---|
| Quadrant | DetID | PixID | Counts | Sigma | Mean | Median | Sigma |
| A | 13 | 254 | 11032 | 59.25 | 857 | 841 | 172.0 |
| A | 3 | 137 | 7384 | 38.04 | 857 | 841 | 172.0 |
| A | 0 | 226 | 7368 | 37.95 | 857 | 841 | 172.0 |
| B | 0 | 189 | 70490 | 426.95 | 846 | 826 | 163.2 |
| B | 0 | 183 | 40045 | 240.36 | 846 | 826 | 163.2 |
| B | 0 | 190 | 29650 | 176.65 | 846 | 826 | 163.2 |
| C | 14 | 238 | 128609 | 668.14 | 810 | 817 | 191.3 |
| C | 10 | 9 | 44422 | 227.98 | 810 | 817 | 191.3 |
| C | 0 | 10 | 28417 | 144.3 | 810 | 817 | 191.3 |
| D | 1 | 52 | 259362 | 1283.05 | 831 | 809 | 201.5 |
| D | 2 | 234 | 28500 | 137.41 | 831 | 809 | 201.5 |
| D | 2 | 249 | 10867 | 49.91 | 831 | 809 | 201.5 |
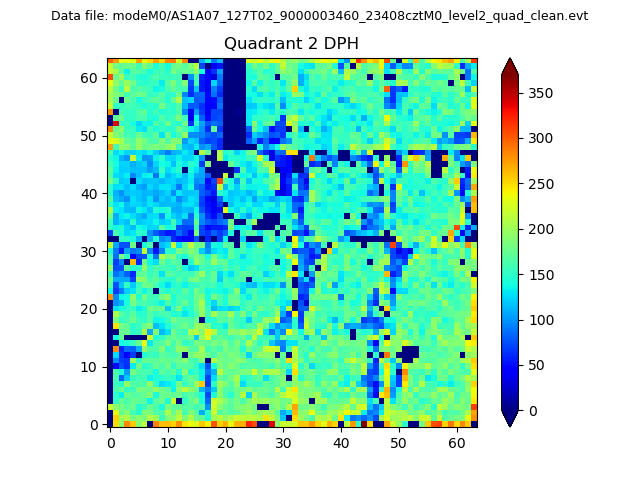
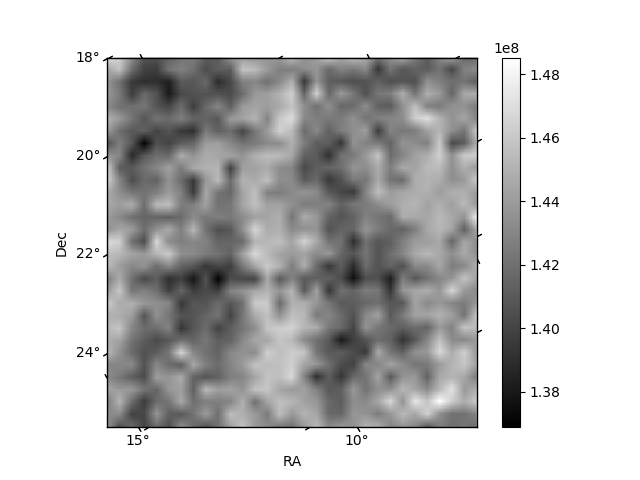
Histogram calculated using DETX and DETY for each event in the final _common_clean file
| Quadrant A | 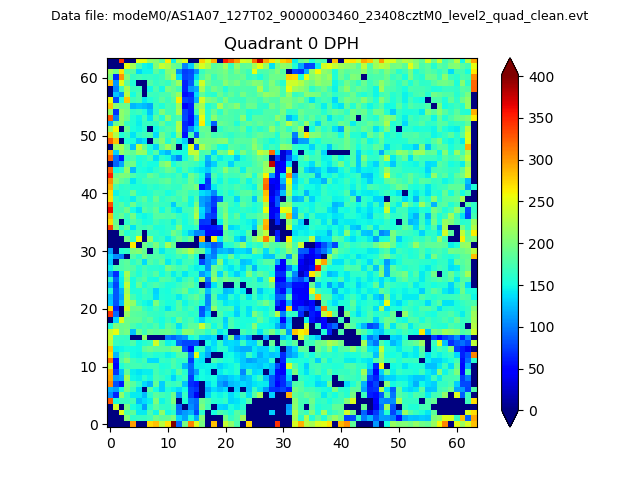 |
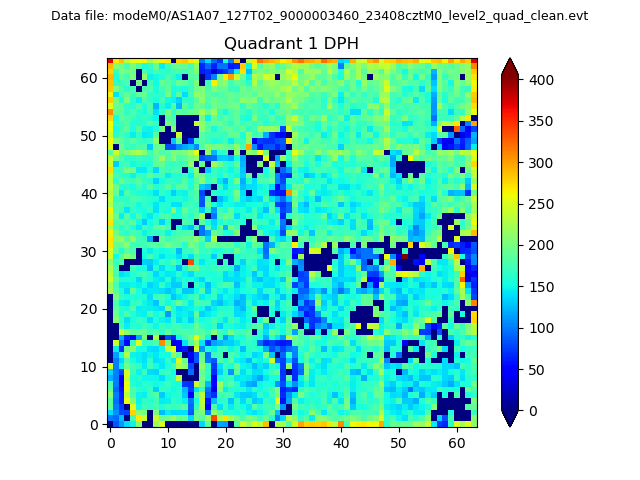 |
Quadrant B |
|---|---|---|---|
| Quadrant D | 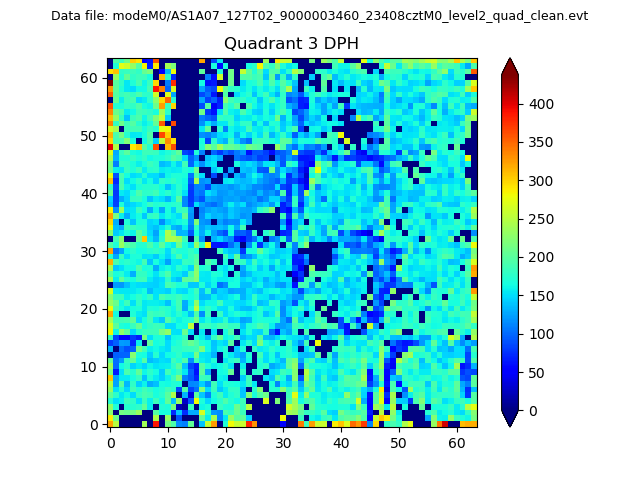 |
 |
Quadrant C |
| Plot type | Count rate plots | Images |
|---|---|---|
| Comparison with Poisson distribution Blue bars denote a histogram of data divided into 1 sec bins. Red curve is a Poisson curve with rate = median count rate of data. |
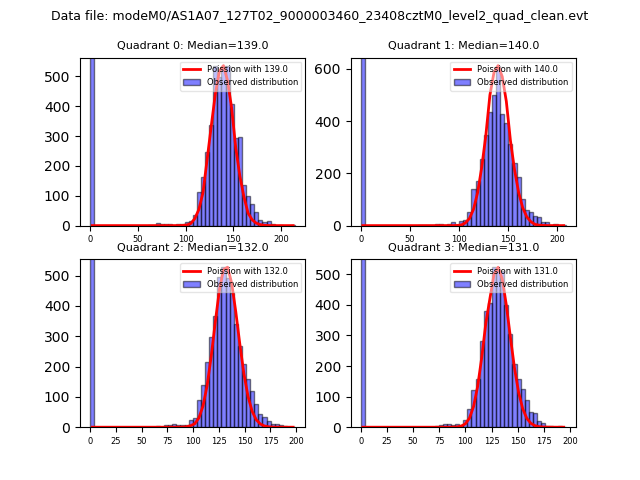 |
 |
| Quadrant-wise count rates Data is divided into 100 sec bins |
 |
|
| Module-wise count rates for Quadrant A Data is divided into 100 sec bins |
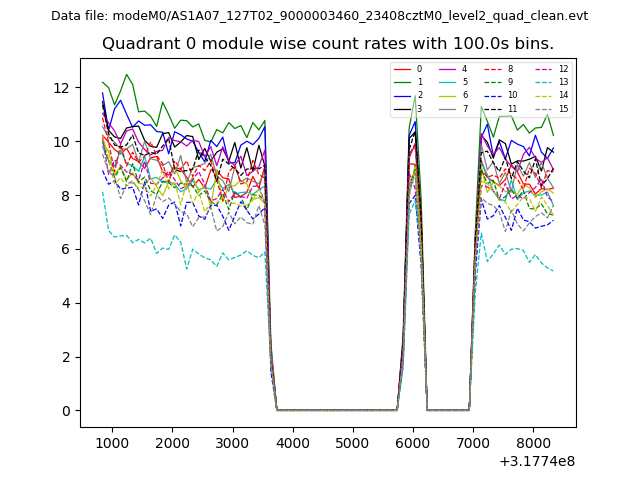 |
 |
| Module-wise count rates for Quadrant B Data is divided into 100 sec bins |
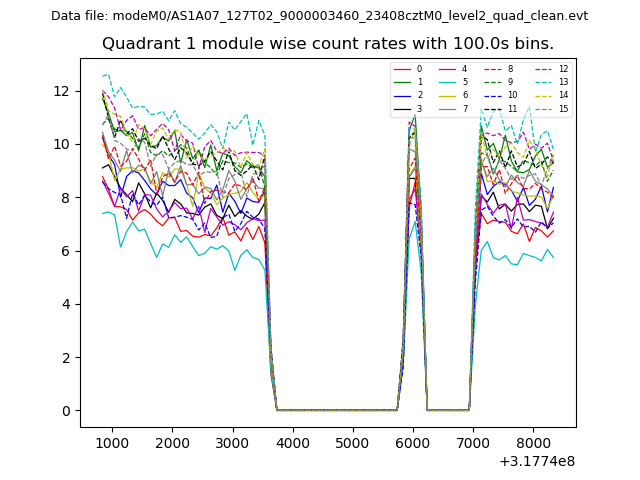 |
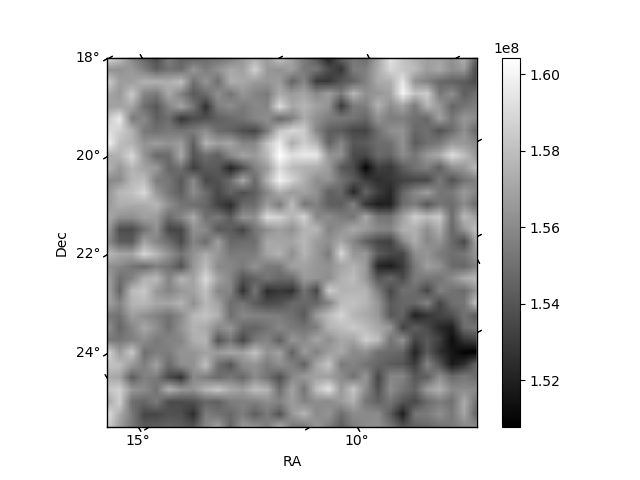 |
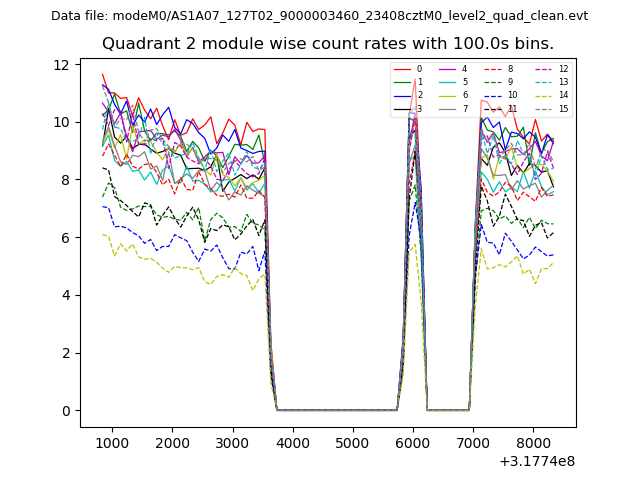
| Module-wise count rates for Quadrant C Data is divided into 100 sec bins |
 |
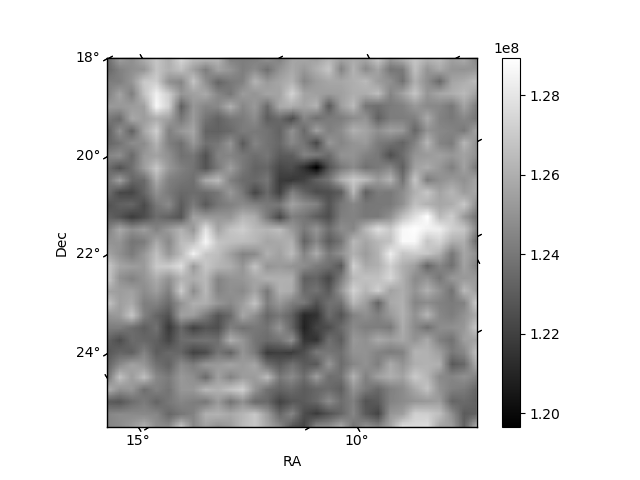 |
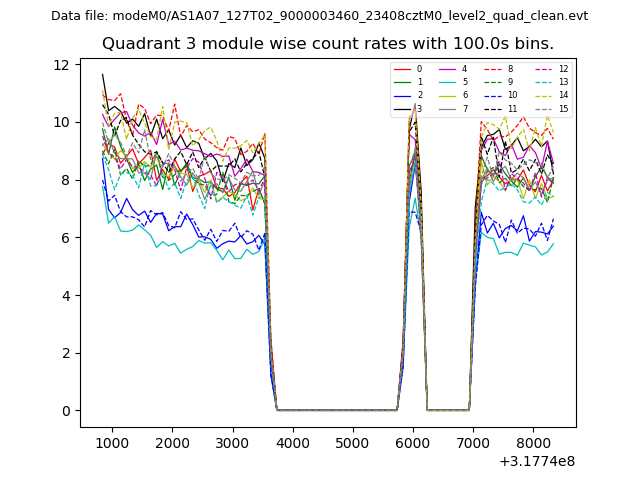
| Module-wise count rates for Quadrant D Data is divided into 100 sec bins |
 |
 |
| Parameter | Plot |
|---|---|
| CZT HV Monitor | 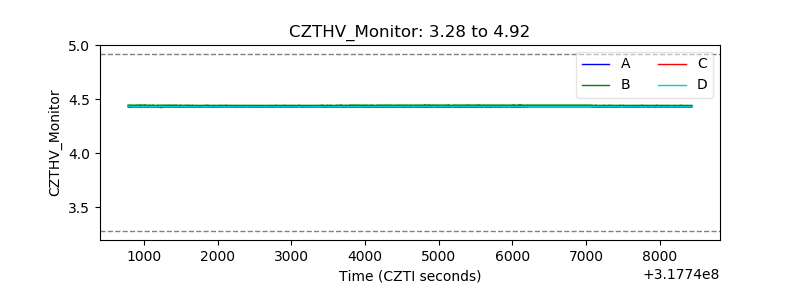 |
| D_VDD | 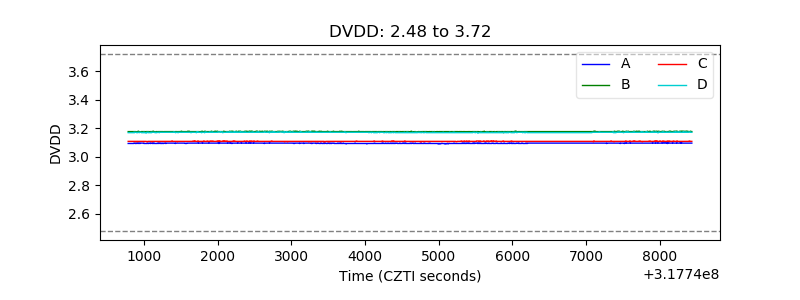 |
| Temperature 1 | 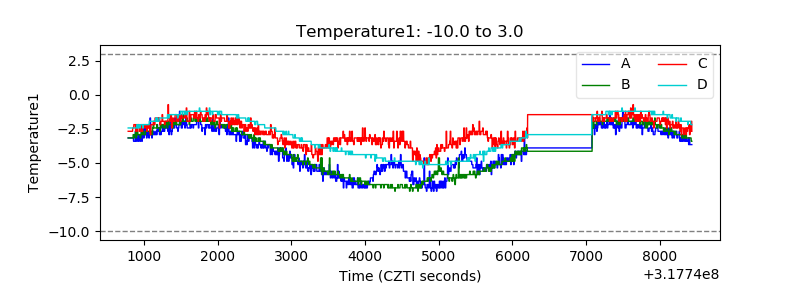 |
| Veto HV Monitor | 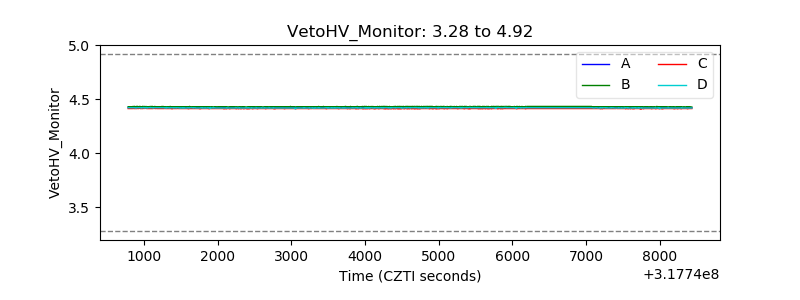 |
| Veto LLD | 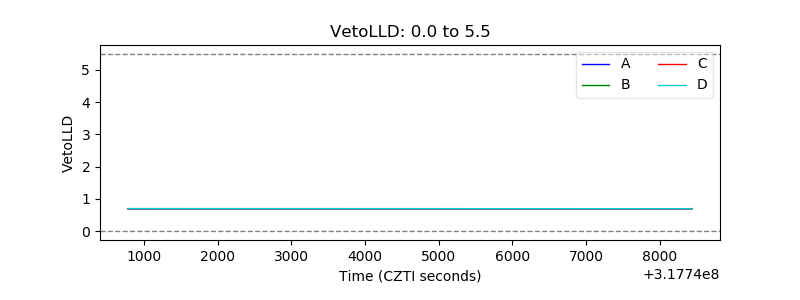 |
| Alpha Counter | 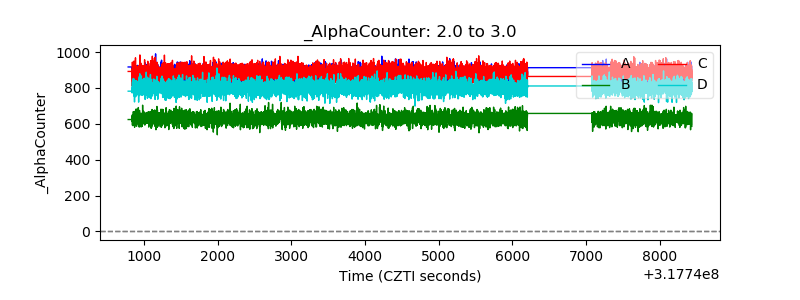 |
| _CPM_Rate | 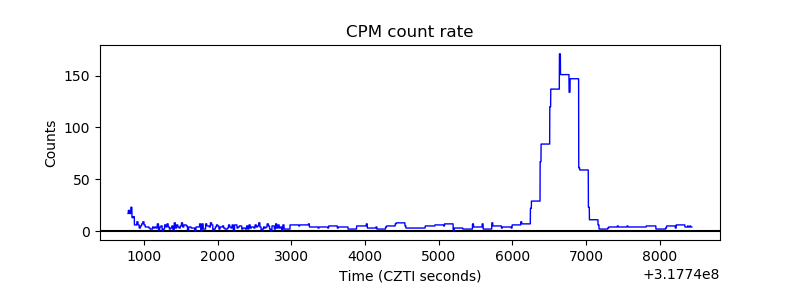 |
| CZT Counter |  |
| +2.5 Volts monitor |  |
| +5 Volts monitor |  |
| _ROLL_ROT | 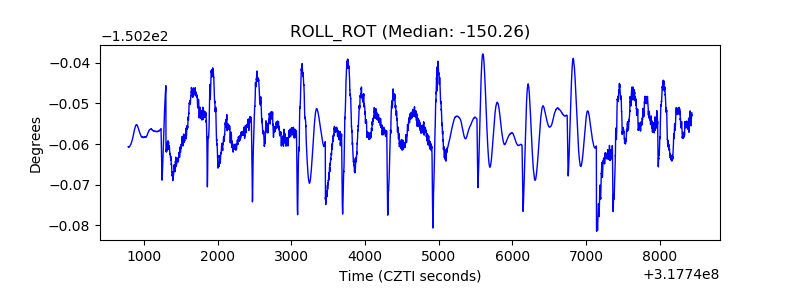 |
| _Roll_DEC | 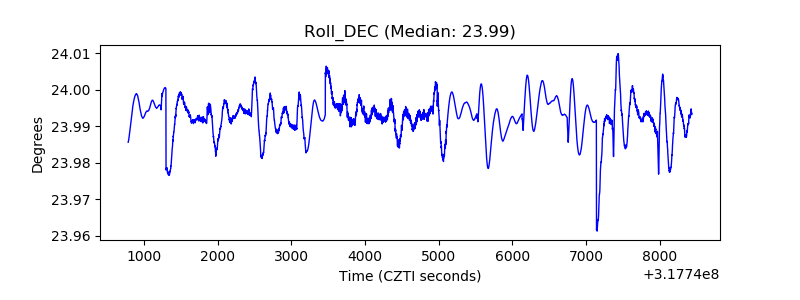 |
| _Roll_RA |  |
| Veto Counter | 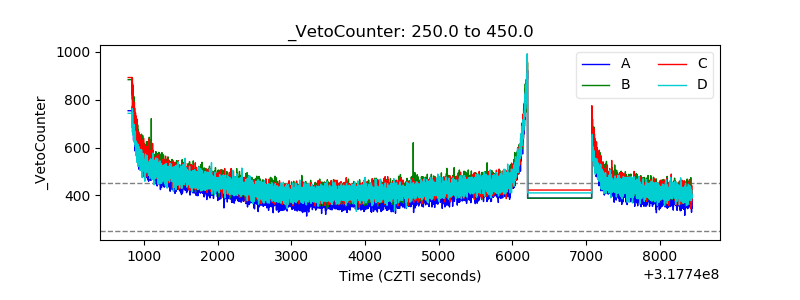 |