| Param | Original file | Final file |
|---|---|---|
| Filename | modeM0/AS1A07_127T02_9000003460_23409cztM0_level2.evt | modeM0/AS1A07_127T02_9000003460_23409cztM0_level2_quad_clean.evt |
| Size (bytes) | 543,660,480 | 106,012,800 |
| Size | 518.5 MB | 101.1 MB |
| Events in quadrant A | 3,537,944 | 693,815 |
| Events in quadrant B | 3,652,240 | 697,542 |
| Events in quadrant C | 4,219,529 | 646,641 |
| Events in quadrant D | 4,547,579 | 652,165 |
| Mode M9 | |||
|---|---|---|---|
| Quadrant | BADHDUFLAG | Total packets | Discarded packets |
| A | 0 | 8 | 0 |
| B | 0 | 9 | 0 |
| C | 0 | 9 | 0 |
| D | 0 | 9 | 0 |
| Mode M0 | |||
|---|---|---|---|
| Quadrant | BADHDUFLAG | Total packets | Discarded packets |
| A | 0 | 15375 | 2 |
| B | 0 | 15605 | 2 |
| C | 0 | 17168 | 2 |
| D | 0 | 18424 | 4 |
| Mode SS | |||
|---|---|---|---|
| Quadrant | BADHDUFLAG | Total packets | Discarded packets |
| A | 0 | 152 | 0 |
| B | 0 | 152 | 0 |
| C | 0 | 152 | 0 |
| D | 0 | 152 | 0 |
| Quadrant | Total seconds | Saturated seconds | Saturation percentage |
|---|---|---|---|
| A | 7478 | 35 | 0.468040% |
| B | 7478 | 64 | 0.855844% |
| C | 7478 | 234 | 3.129179% |
| D | 7477 | 201 | 2.688244% |
Noise dominated data is calculated using 1-second bins in cleaned event files. If a bin has >2000 counts, and if more than 50% of those come from <1% of pixels, then it is considered to be noise-dominated and hence unusable.
| Quadrant | # 1 sec bins | Bins with >0 counts | Bins with >2000 counts | High rate bins dominated by noise | Noise dominated (total time) | Noise dominated (detector-on time) | Marked lightcurve |
|---|---|---|---|---|---|---|---|
| A | 7953 | 7479 | 0 | 0 | 0.00% | 0.00% | 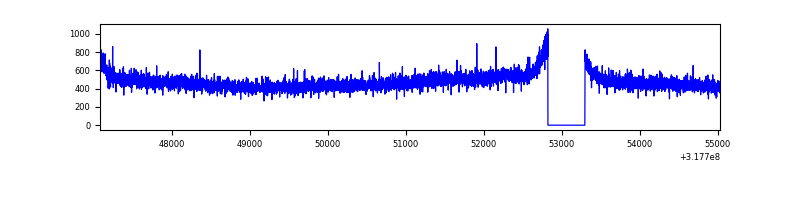 |
| B | 7953 | 7479 | 2 | 2 | 0.03% | 0.03% | 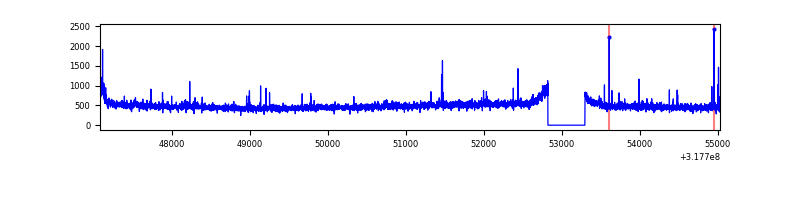 |
| C | 7953 | 7479 | 164 | 164 | 2.06% | 2.19% | 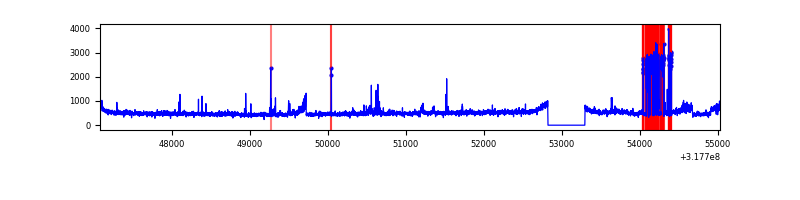 |
| D | 7952 | 7478 | 174 | 174 | 2.19% | 2.33% | 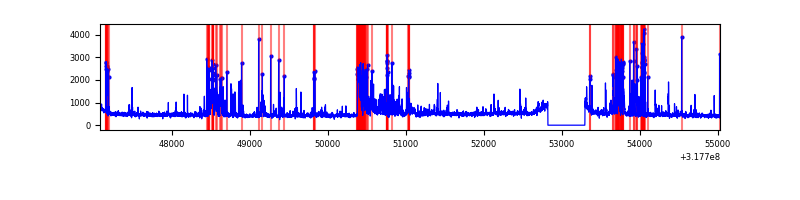 |
Top three noisy pixels from each quadrant. If the there are fewer than three noisy pixels in the level2.evt file, extra rows are filled as -1
| Pixel properties | Quadrant properties | ||||||
|---|---|---|---|---|---|---|---|
| Quadrant | DetID | PixID | Counts | Sigma | Mean | Median | Sigma |
| A | 13 | 254 | 11305 | 56.3 | 917 | 898 | 184.9 |
| A | 3 | 137 | 8209 | 39.55 | 917 | 898 | 184.9 |
| A | 0 | 226 | 7916 | 37.96 | 917 | 898 | 184.9 |
| B | 0 | 189 | 48710 | 273.36 | 911 | 888 | 174.9 |
| B | 12 | 111 | 21078 | 115.41 | 911 | 888 | 174.9 |
| B | 11 | 111 | 18791 | 102.34 | 911 | 888 | 174.9 |
| C | 10 | 9 | 681103 | 3333.06 | 865 | 871 | 204.1 |
| C | 14 | 238 | 137218 | 668.09 | 865 | 871 | 204.1 |
| C | 7 | 247 | 16372 | 75.95 | 865 | 871 | 204.1 |
| D | 1 | 52 | 1029224 | 4764.12 | 888 | 864 | 215.9 |
| D | 12 | 227 | 101992 | 468.5 | 888 | 864 | 215.9 |
| D | 2 | 234 | 33874 | 152.93 | 888 | 864 | 215.9 |
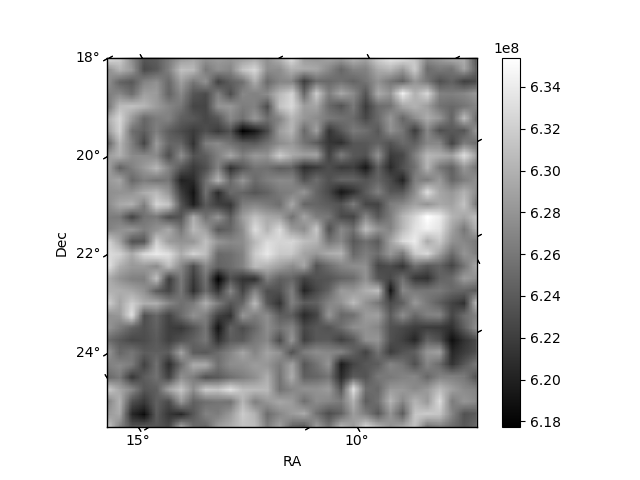
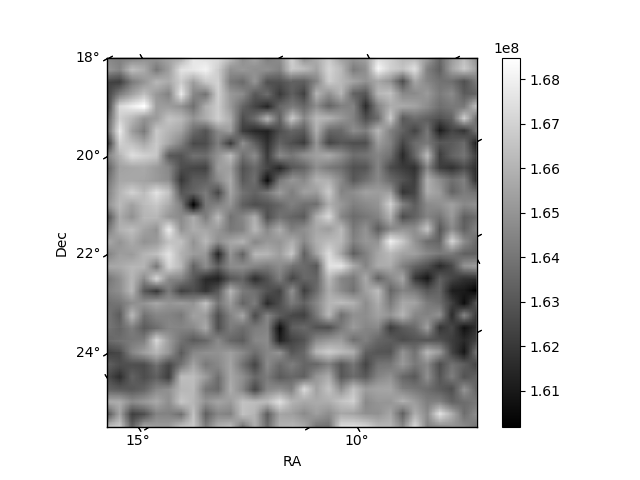
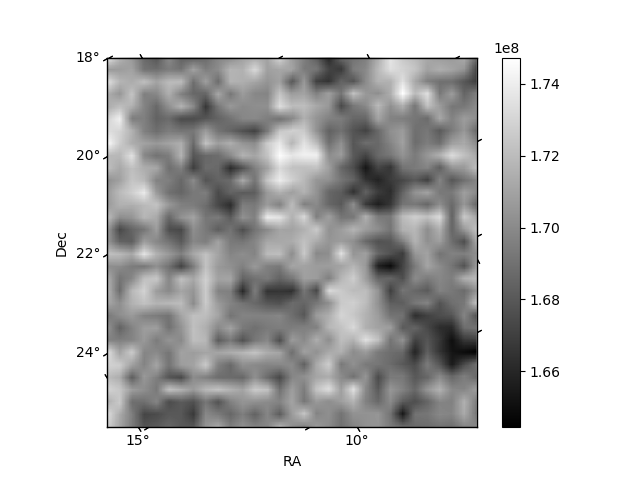
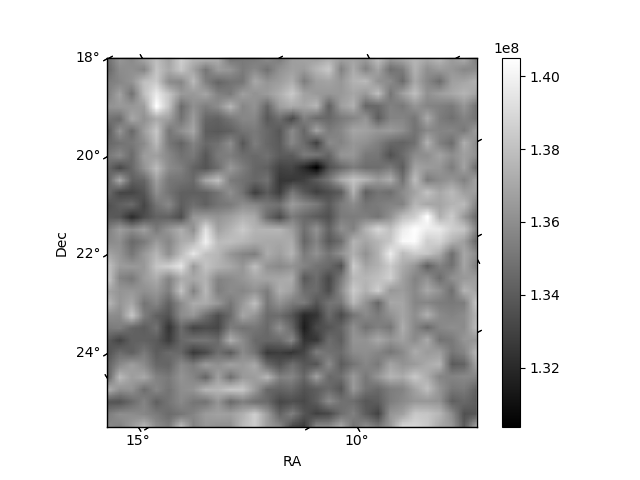
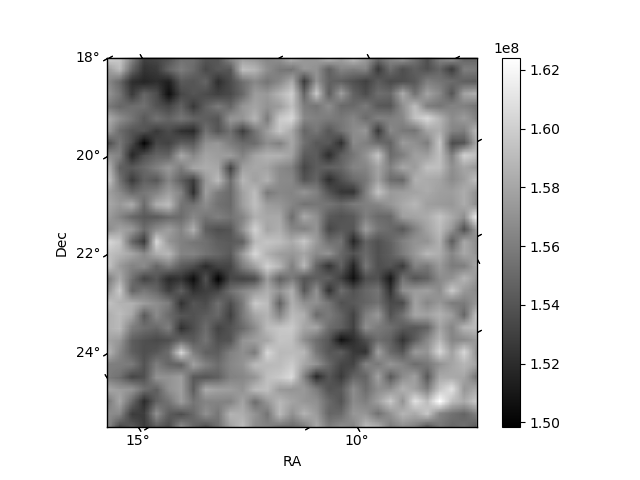
Histogram calculated using DETX and DETY for each event in the final _common_clean file
| Quadrant A | 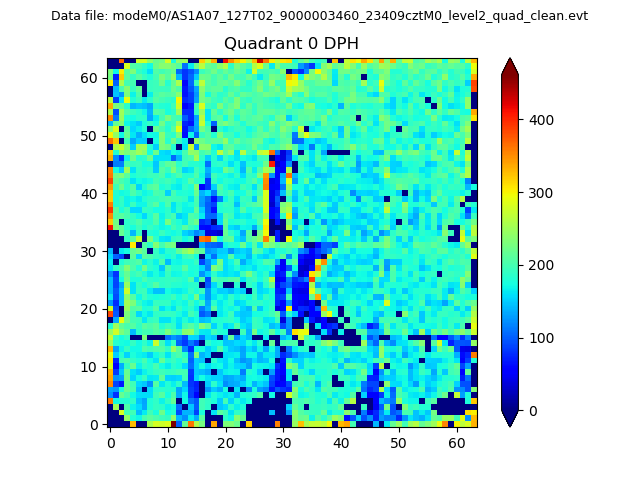 |
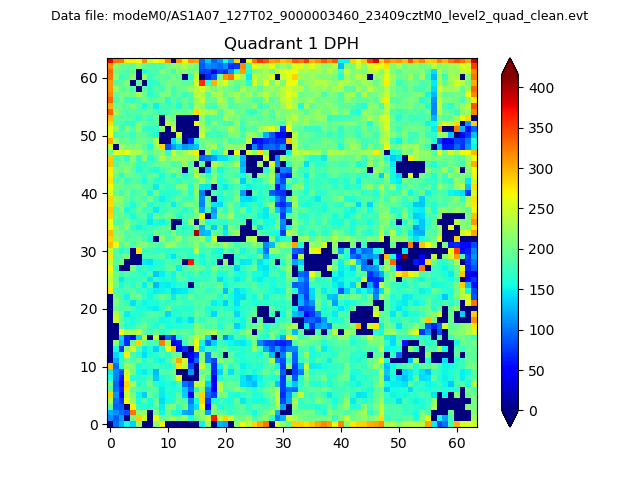 |
Quadrant B |
|---|---|---|---|
| Quadrant D | 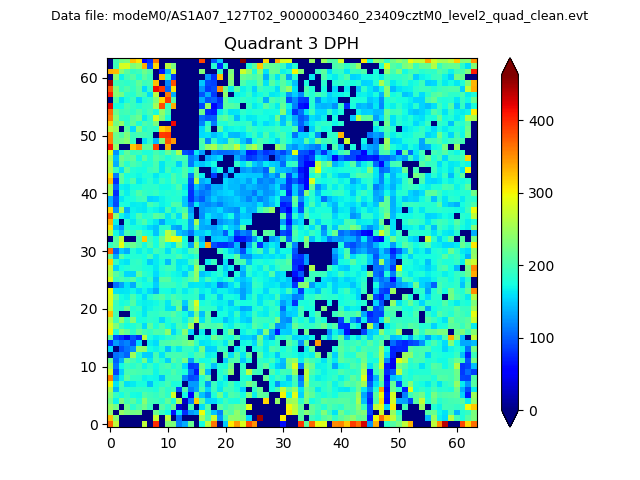 |
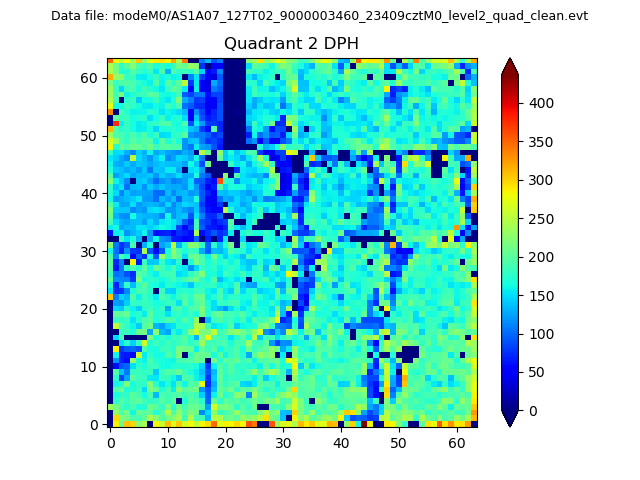 |
Quadrant C |
| Plot type | Count rate plots | Images |
|---|---|---|
| Comparison with Poisson distribution Blue bars denote a histogram of data divided into 1 sec bins. Red curve is a Poisson curve with rate = median count rate of data. |
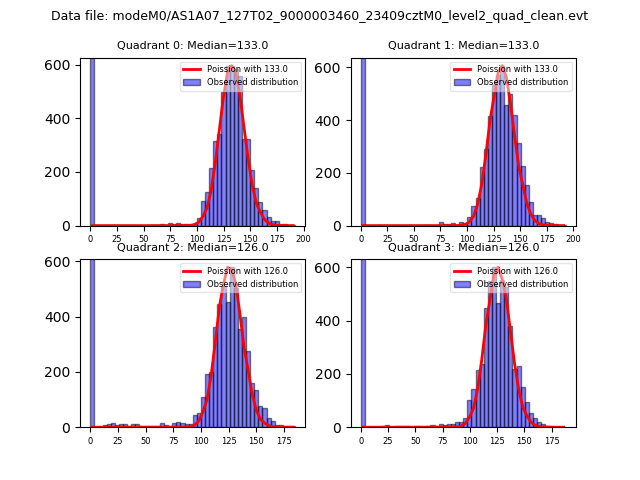 |
 |
| Quadrant-wise count rates Data is divided into 100 sec bins |
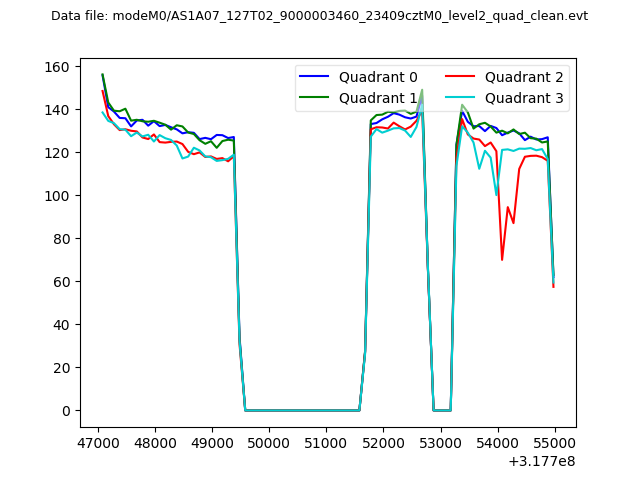 |
|
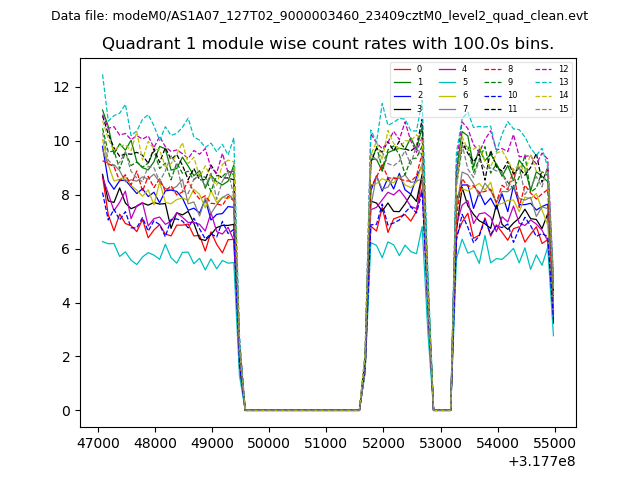
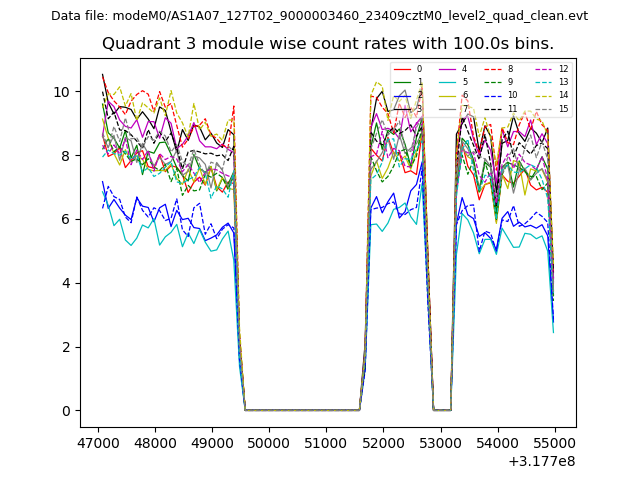
| Module-wise count rates for Quadrant A Data is divided into 100 sec bins |
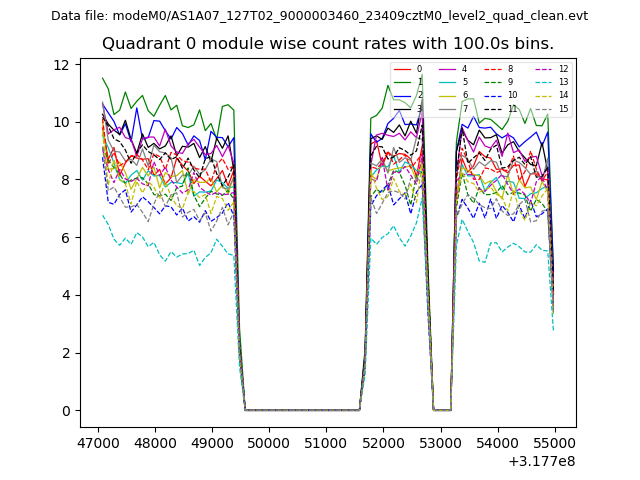 |
 |
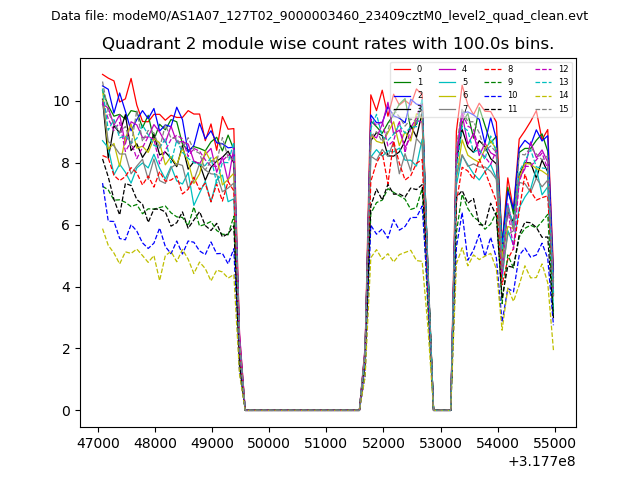
| Module-wise count rates for Quadrant B Data is divided into 100 sec bins |
 |
 |
| Module-wise count rates for Quadrant C Data is divided into 100 sec bins |
 |
 |
| Module-wise count rates for Quadrant D Data is divided into 100 sec bins |
 |
 |
| Parameter | Plot |
|---|---|
| CZT HV Monitor | 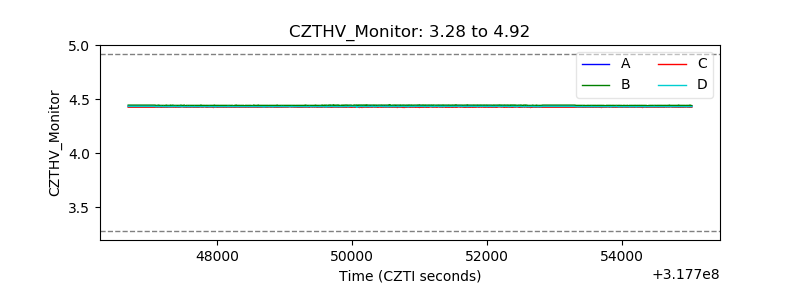 |
| D_VDD | 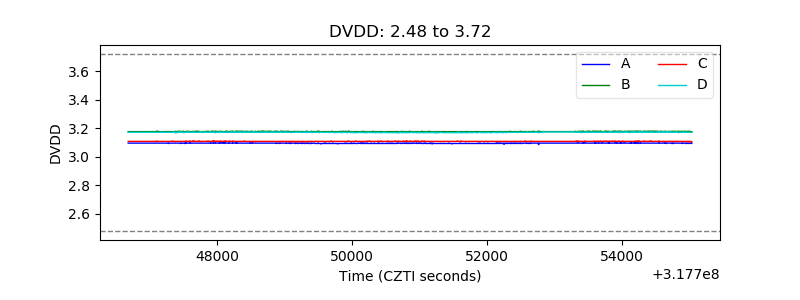 |
| Temperature 1 | 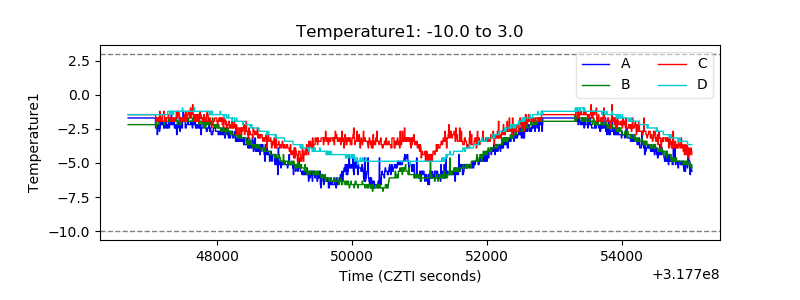 |
| Veto HV Monitor | 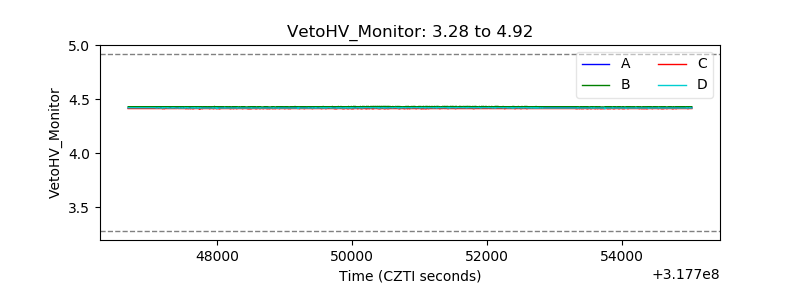 |
| Veto LLD | 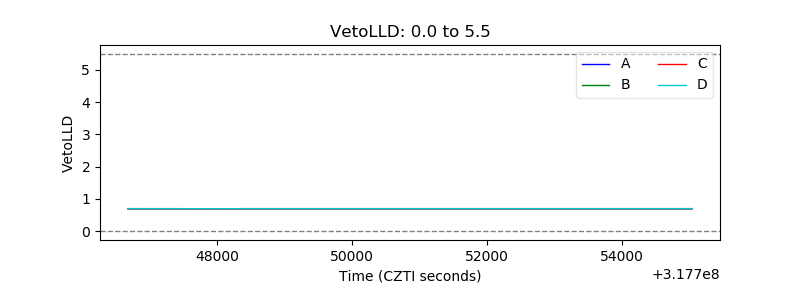 |
| Alpha Counter | 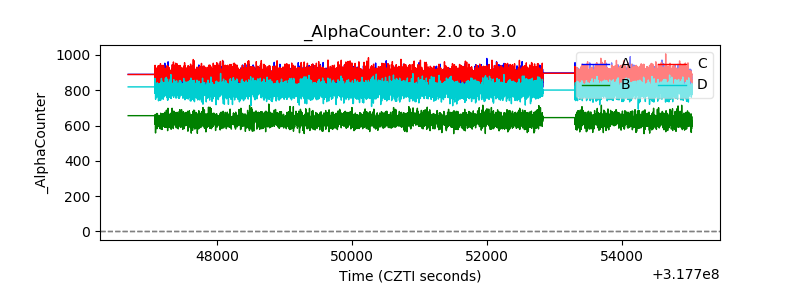 |
| _CPM_Rate | 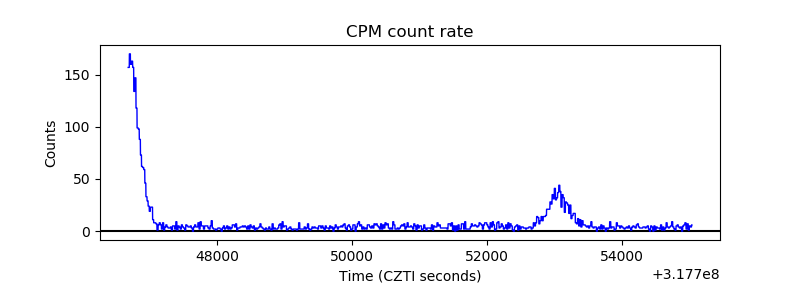 |
| CZT Counter | 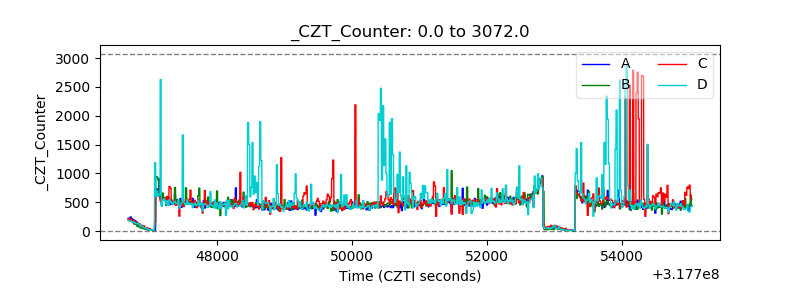 |
| +2.5 Volts monitor |  |
| +5 Volts monitor | 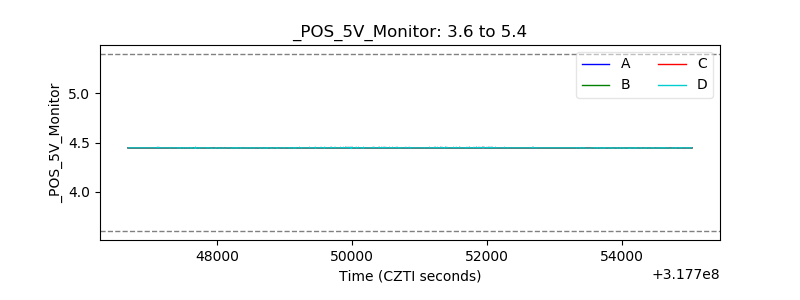 |
| _ROLL_ROT | 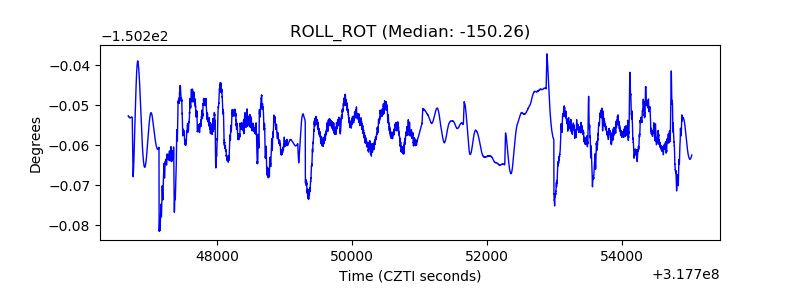 |
| _Roll_DEC | 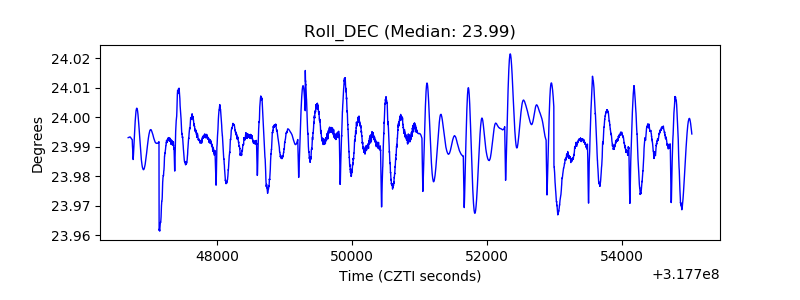 |
| _Roll_RA | 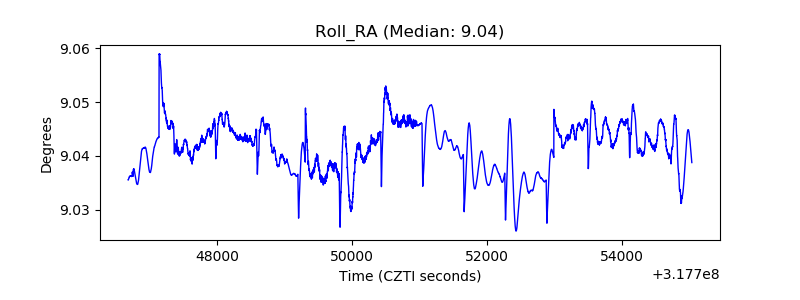 |
| Veto Counter | 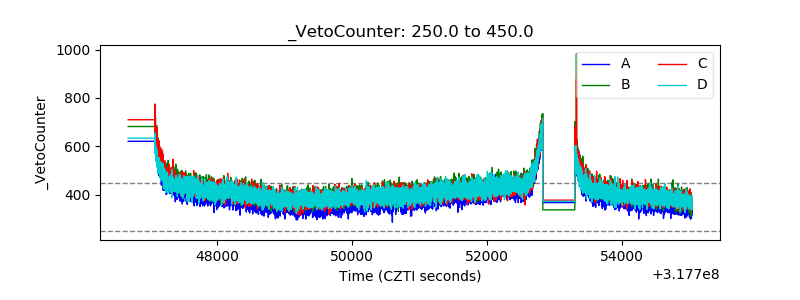 |