| Param | Original file | Final file |
|---|---|---|
| Filename | modeM0/AS1A07_127T02_9000003460_23413cztM0_level2.evt | modeM0/AS1A07_127T02_9000003460_23413cztM0_level2_quad_clean.evt |
| Size (bytes) | 586,753,920 | 93,539,520 |
| Size | 559.6 MB | 89.2 MB |
| Events in quadrant A | 4,141,340 | 563,480 |
| Events in quadrant B | 4,249,478 | 570,229 |
| Events in quadrant C | 4,434,299 | 543,721 |
| Events in quadrant D | 4,341,727 | 538,192 |
| Mode M9 | |||
|---|---|---|---|
| Quadrant | BADHDUFLAG | Total packets | Discarded packets |
| A | 0 | 5 | 0 |
| B | 0 | 5 | 0 |
| C | 0 | 5 | 0 |
| D | 0 | 5 | 0 |
| Mode M0 | |||
|---|---|---|---|
| Quadrant | BADHDUFLAG | Total packets | Discarded packets |
| A | 0 | 18197 | 1 |
| B | 0 | 18298 | 1 |
| C | 0 | 18812 | 1 |
| D | 0 | 18758 | 1 |
| Mode SS | |||
|---|---|---|---|
| Quadrant | BADHDUFLAG | Total packets | Discarded packets |
| A | 0 | 180 | 0 |
| B | 0 | 180 | 0 |
| C | 0 | 180 | 0 |
| D | 0 | 180 | 0 |
| Quadrant | Total seconds | Saturated seconds | Saturation percentage |
|---|---|---|---|
| A | 8887 | 53 | 0.596377% |
| B | 8887 | 67 | 0.753910% |
| C | 8888 | 146 | 1.642664% |
| D | 8888 | 71 | 0.798830% |
Noise dominated data is calculated using 1-second bins in cleaned event files. If a bin has >2000 counts, and if more than 50% of those come from <1% of pixels, then it is considered to be noise-dominated and hence unusable.
| Quadrant | # 1 sec bins | Bins with >0 counts | Bins with >2000 counts | High rate bins dominated by noise | Noise dominated (total time) | Noise dominated (detector-on time) | Marked lightcurve |
|---|---|---|---|---|---|---|---|
| A | 9402 | 8887 | 2 | 2 | 0.02% | 0.02% | 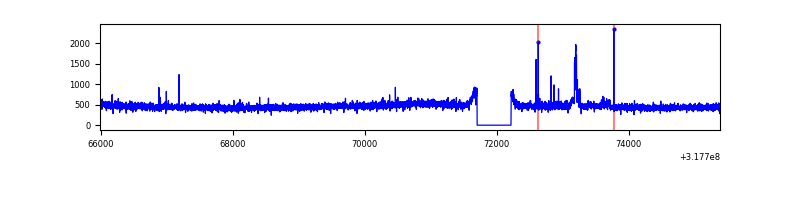 |
| B | 9402 | 8887 | 5 | 5 | 0.05% | 0.06% | 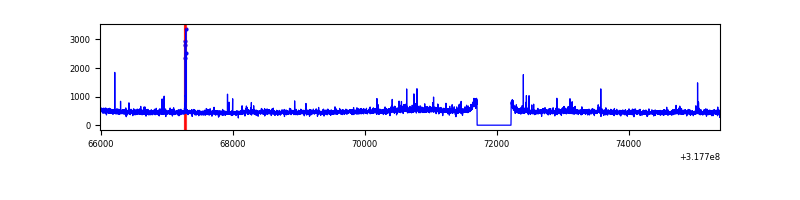 |
| C | 9403 | 8888 | 59 | 59 | 0.63% | 0.66% | 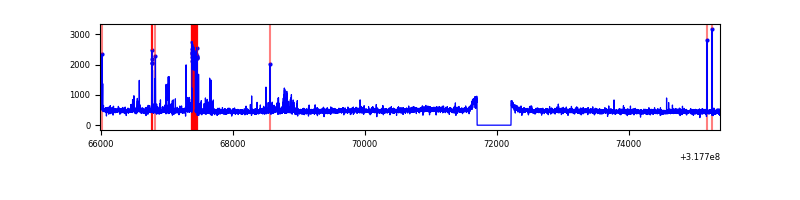 |
| D | 9403 | 8888 | 9 | 9 | 0.10% | 0.10% | 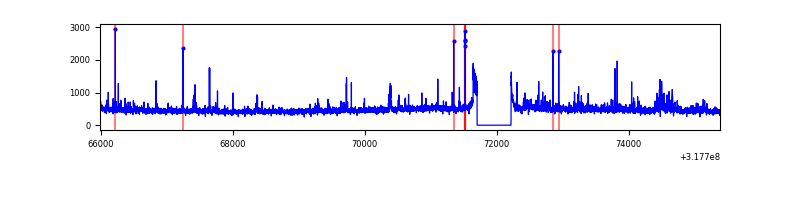 |
Top three noisy pixels from each quadrant. If the there are fewer than three noisy pixels in the level2.evt file, extra rows are filled as -1
| Pixel properties | Quadrant properties | ||||||
|---|---|---|---|---|---|---|---|
| Quadrant | DetID | PixID | Counts | Sigma | Mean | Median | Sigma |
| A | 15 | 174 | 78104 | 364.45 | 1050 | 1027 | 211.5 |
| A | 13 | 254 | 14581 | 64.09 | 1050 | 1027 | 211.5 |
| A | 10 | 253 | 10289 | 43.79 | 1050 | 1027 | 211.5 |
| B | 0 | 189 | 67516 | 326.93 | 1050 | 1024 | 203.4 |
| B | 12 | 111 | 25288 | 119.3 | 1050 | 1024 | 203.4 |
| B | 0 | 183 | 22896 | 107.54 | 1050 | 1024 | 203.4 |
| C | 10 | 9 | 328189 | 1368.72 | 1010 | 1016 | 239.0 |
| C | 14 | 238 | 161506 | 671.41 | 1010 | 1016 | 239.0 |
| C | 7 | 247 | 8461 | 31.15 | 1010 | 1016 | 239.0 |
| D | 1 | 52 | 151479 | 600.88 | 1025 | 995 | 250.4 |
| D | 7 | 238 | 107120 | 423.76 | 1025 | 995 | 250.4 |
| D | 13 | 172 | 81821 | 322.74 | 1025 | 995 | 250.4 |
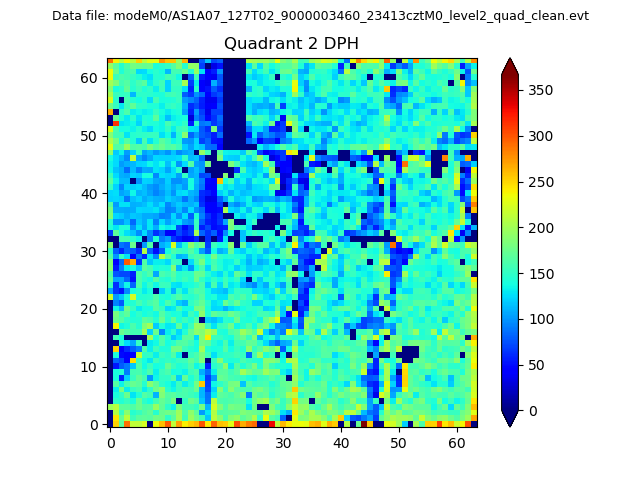
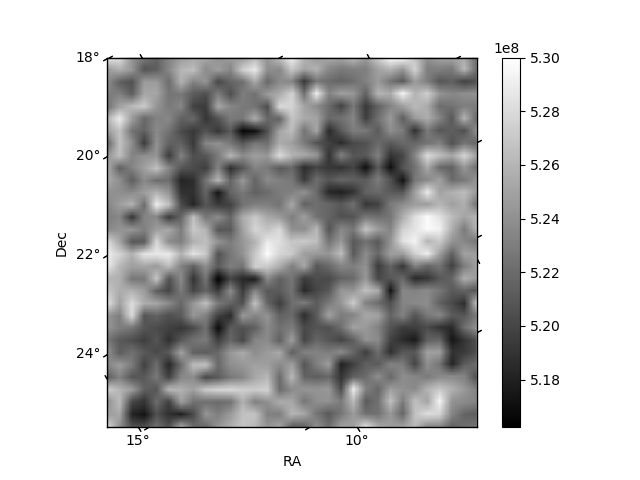
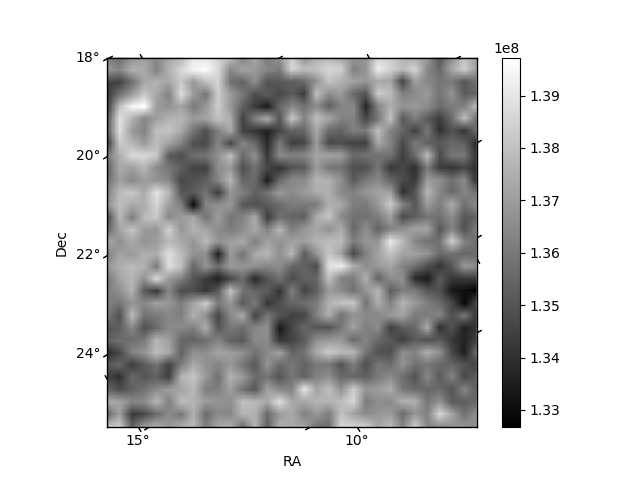
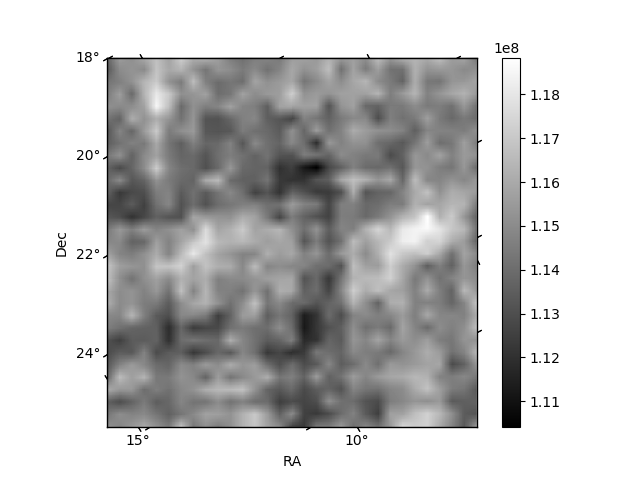
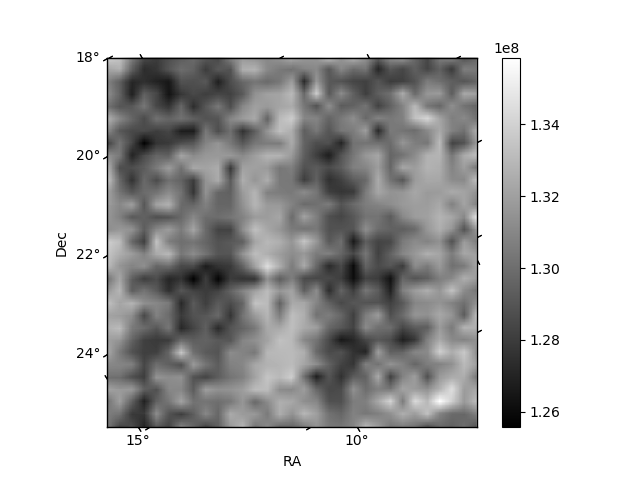
Histogram calculated using DETX and DETY for each event in the final _common_clean file
| Quadrant A | 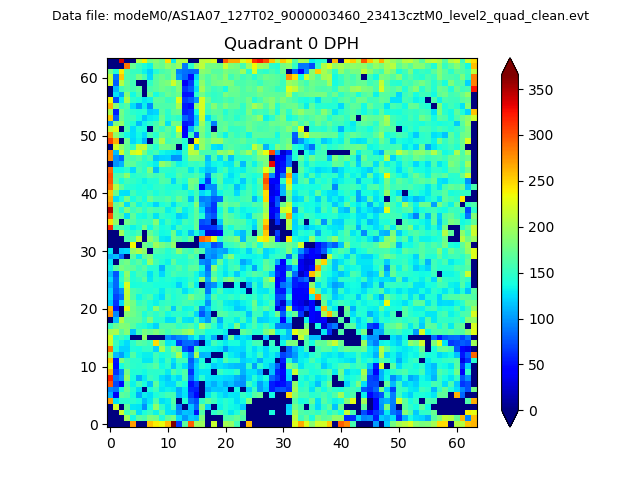 |
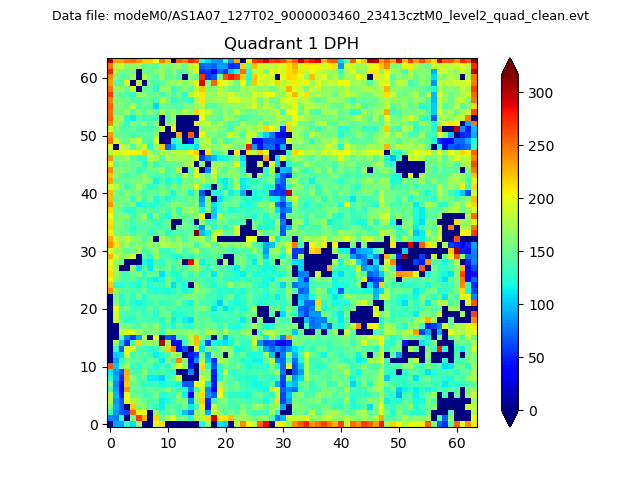 |
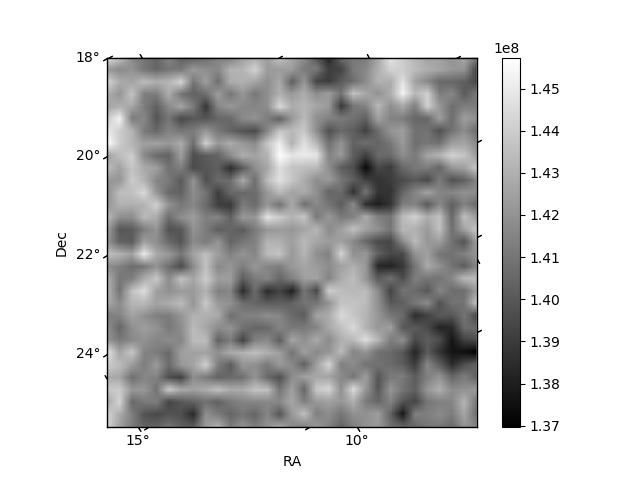
Quadrant B |
|---|---|---|---|
| Quadrant D | 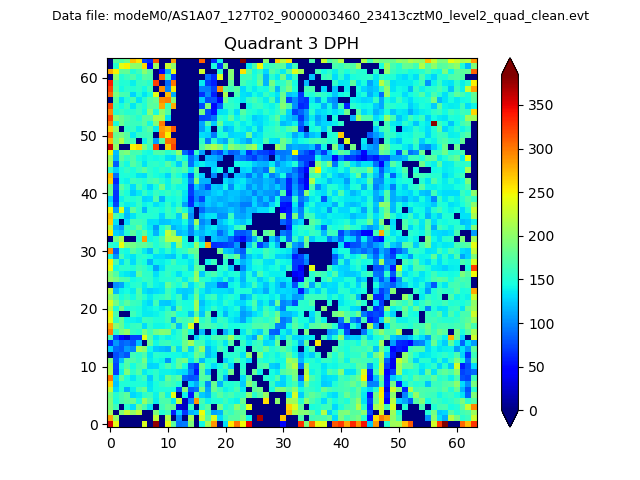 |
 |
Quadrant C |
| Plot type | Count rate plots | Images |
|---|---|---|
| Comparison with Poisson distribution Blue bars denote a histogram of data divided into 1 sec bins. Red curve is a Poisson curve with rate = median count rate of data. |
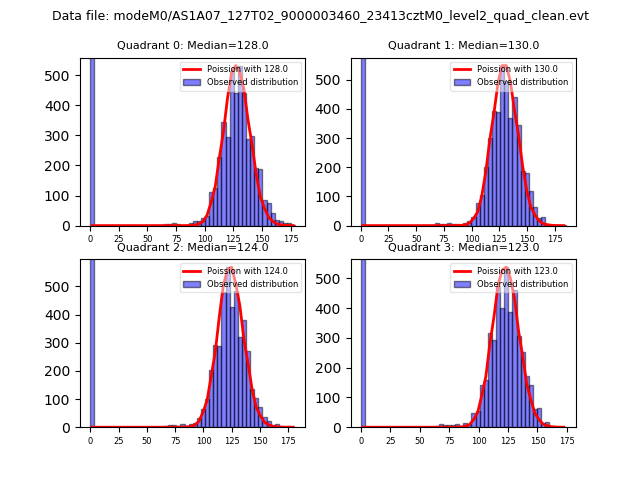 |
 |
| Quadrant-wise count rates Data is divided into 100 sec bins |
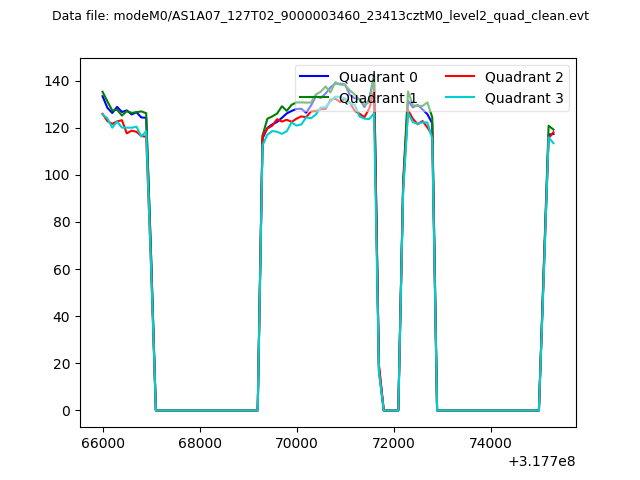 |
|
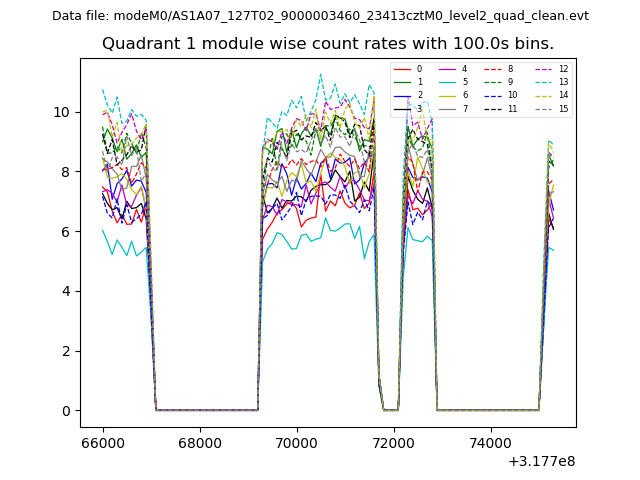
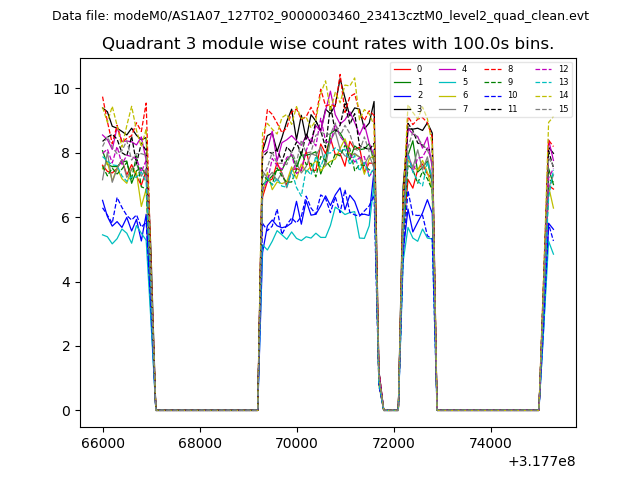
| Module-wise count rates for Quadrant A Data is divided into 100 sec bins |
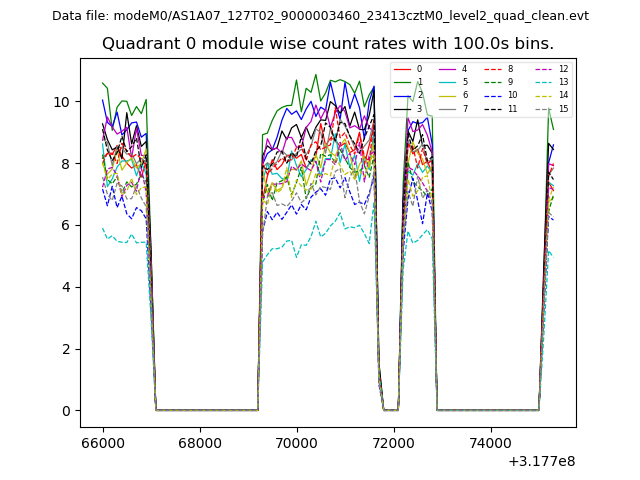 |
 |
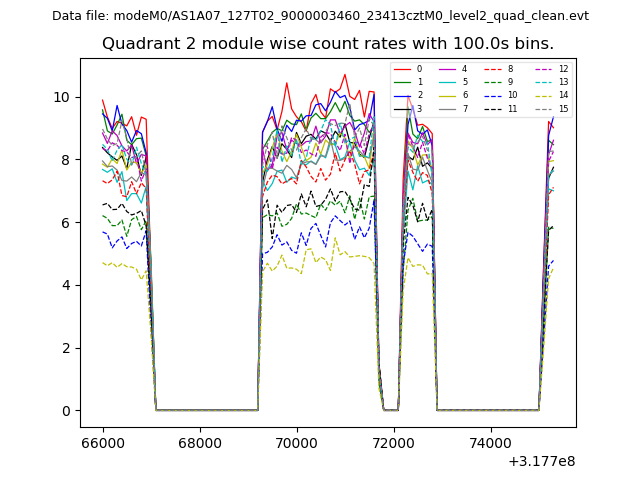
| Module-wise count rates for Quadrant B Data is divided into 100 sec bins |
 |
 |
| Module-wise count rates for Quadrant C Data is divided into 100 sec bins |
 |
 |
| Module-wise count rates for Quadrant D Data is divided into 100 sec bins |
 |
 |
| Parameter | Plot |
|---|---|
| CZT HV Monitor | 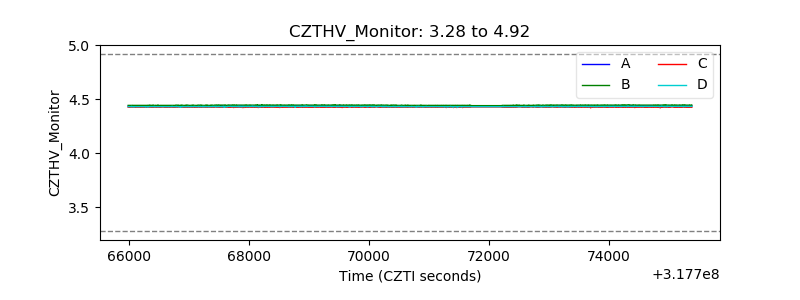 |
| D_VDD | 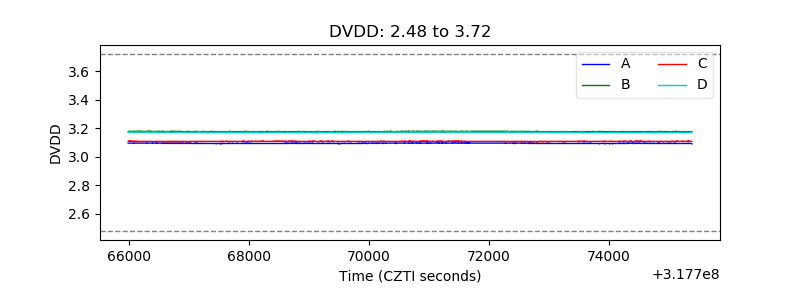 |
| Temperature 1 | 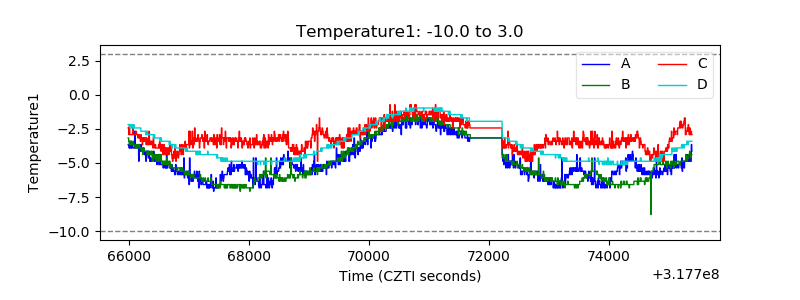 |
| Veto HV Monitor |  |
| Veto LLD |  |
| Alpha Counter | 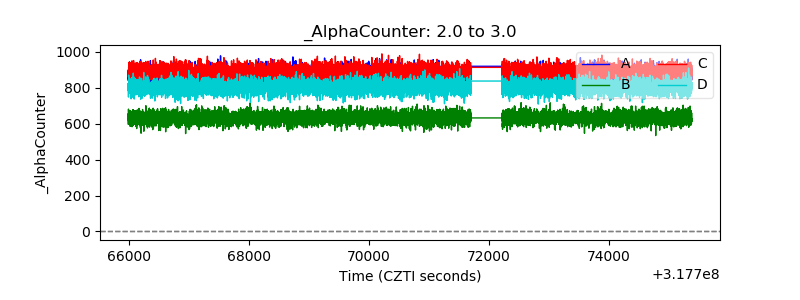 |
| _CPM_Rate | 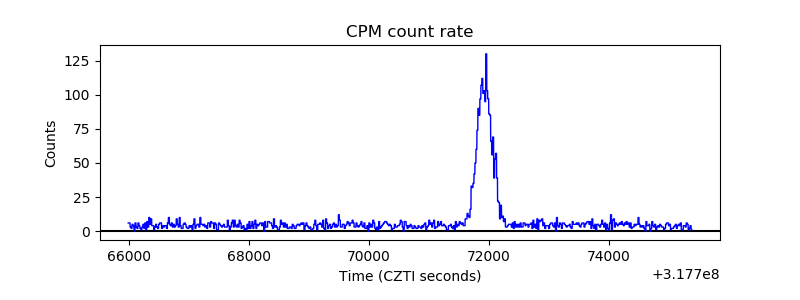 |
| CZT Counter | 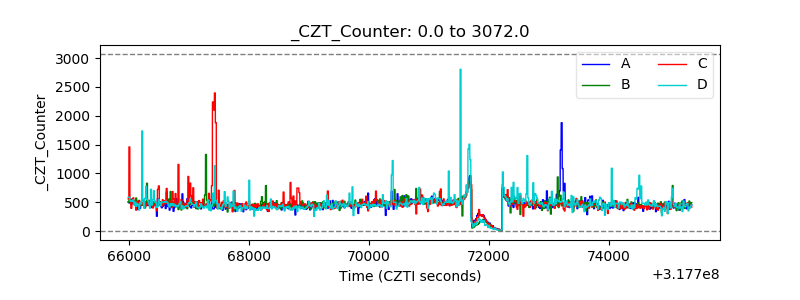 |
| +2.5 Volts monitor |  |
| +5 Volts monitor |  |
| _ROLL_ROT | 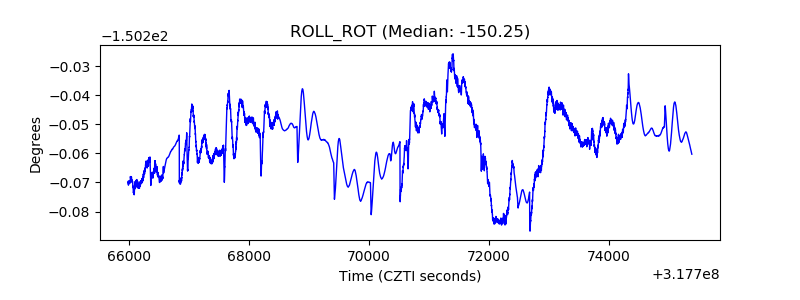 |
| _Roll_DEC | 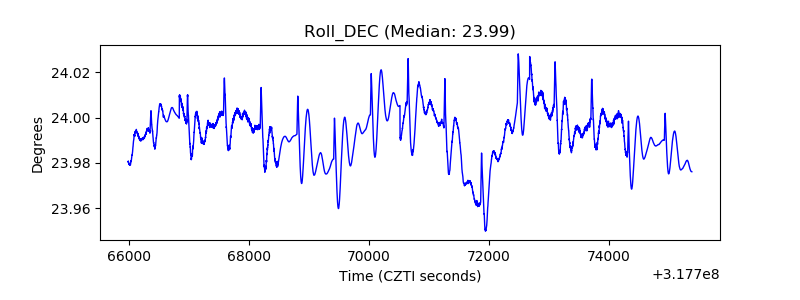 |
| _Roll_RA | 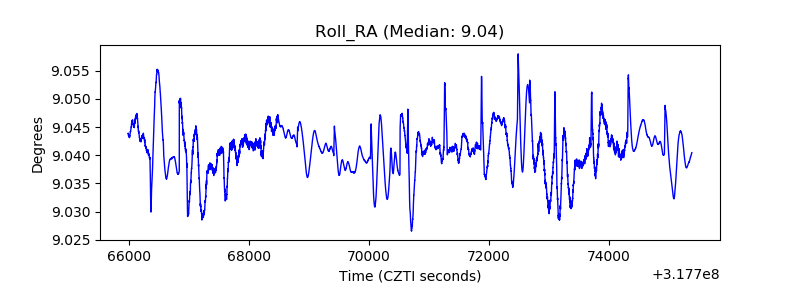 |
| Veto Counter | 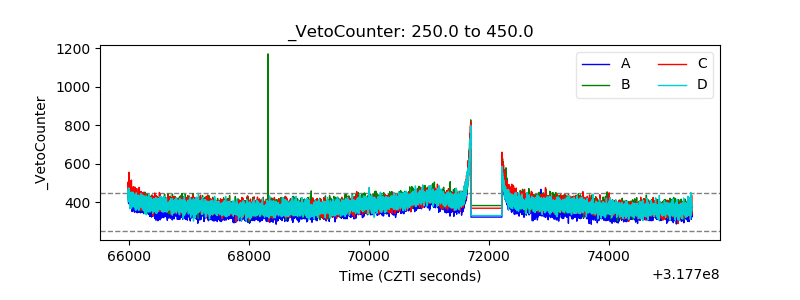 |