| Param | Original file | Final file |
|---|---|---|
| Filename | modeM0/AS1A07_127T02_9000003460_23414cztM0_level2.evt | modeM0/AS1A07_127T02_9000003460_23414cztM0_level2_quad_clean.evt |
| Size (bytes) | 737,383,680 | 119,977,920 |
| Size | 703.2 MB | 114.4 MB |
| Events in quadrant A | 4,753,805 | 748,503 |
| Events in quadrant B | 5,059,251 | 755,820 |
| Events in quadrant C | 5,075,413 | 726,603 |
| Events in quadrant D | 6,771,094 | 714,487 |
| Mode M9 | |||
|---|---|---|---|
| Quadrant | BADHDUFLAG | Total packets | Discarded packets |
| A | 0 | 16 | 0 |
| B | 0 | 16 | 0 |
| C | 0 | 16 | 0 |
| D | 0 | 16 | 0 |
| Mode M0 | |||
|---|---|---|---|
| Quadrant | BADHDUFLAG | Total packets | Discarded packets |
| A | 0 | 20346 | 2 |
| B | 0 | 21164 | 2 |
| C | 0 | 21205 | 2 |
| D | 0 | 26925 | 4 |
| Mode SS | |||
|---|---|---|---|
| Quadrant | BADHDUFLAG | Total packets | Discarded packets |
| A | 0 | 202 | 0 |
| B | 0 | 202 | 0 |
| C | 0 | 202 | 0 |
| D | 0 | 202 | 0 |
| Quadrant | Total seconds | Saturated seconds | Saturation percentage |
|---|---|---|---|
| A | 9930 | 84 | 0.845921% |
| B | 9931 | 114 | 1.147921% |
| C | 9931 | 168 | 1.691673% |
| D | 9930 | 117 | 1.178248% |
Noise dominated data is calculated using 1-second bins in cleaned event files. If a bin has >2000 counts, and if more than 50% of those come from <1% of pixels, then it is considered to be noise-dominated and hence unusable.
| Quadrant | # 1 sec bins | Bins with >0 counts | Bins with >2000 counts | High rate bins dominated by noise | Noise dominated (total time) | Noise dominated (detector-on time) | Marked lightcurve |
|---|---|---|---|---|---|---|---|
| A | 11496 | 9931 | 7 | 7 | 0.06% | 0.07% | 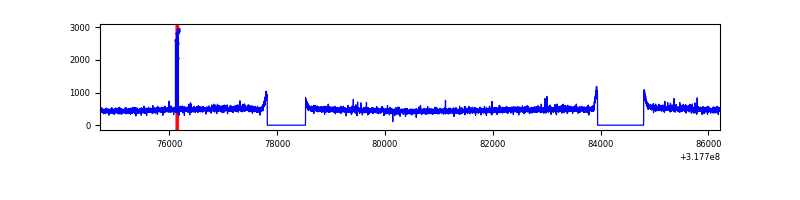 |
| B | 11497 | 9932 | 13 | 13 | 0.11% | 0.13% | 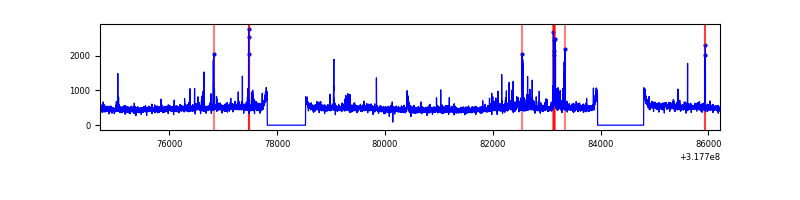 |
| C | 11497 | 9931 | 50 | 50 | 0.43% | 0.50% | 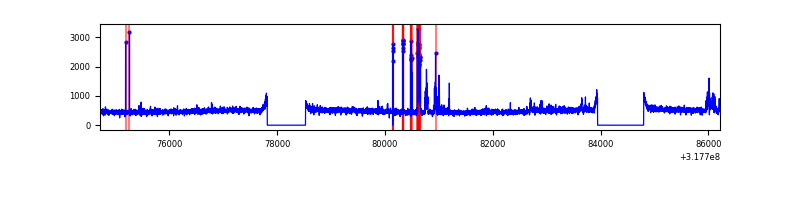 |
| D | 11496 | 9931 | 43 | 43 | 0.37% | 0.43% | 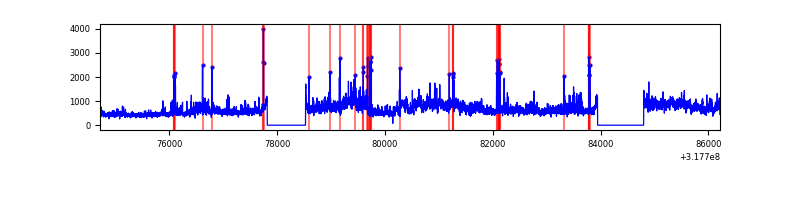 |
Top three noisy pixels from each quadrant. If the there are fewer than three noisy pixels in the level2.evt file, extra rows are filled as -1
| Pixel properties | Quadrant properties | ||||||
|---|---|---|---|---|---|---|---|
| Quadrant | DetID | PixID | Counts | Sigma | Mean | Median | Sigma |
| A | 10 | 253 | 25585 | 98.81 | 1224 | 1200 | 246.8 |
| A | 13 | 254 | 15231 | 56.85 | 1224 | 1200 | 246.8 |
| A | 3 | 137 | 10906 | 39.33 | 1224 | 1200 | 246.8 |
| B | 0 | 189 | 196689 | 830.41 | 1214 | 1183 | 235.4 |
| B | 0 | 190 | 50609 | 209.94 | 1214 | 1183 | 235.4 |
| B | 12 | 111 | 28907 | 117.76 | 1214 | 1183 | 235.4 |
| C | 10 | 9 | 353499 | 1288.8 | 1164 | 1171 | 273.4 |
| C | 14 | 238 | 184222 | 669.59 | 1164 | 1171 | 273.4 |
| C | 13 | 61 | 8021 | 25.06 | 1164 | 1171 | 273.4 |
| D | 7 | 238 | 1534726 | 5314.89 | 1187 | 1154 | 288.5 |
| D | 1 | 52 | 644024 | 2227.99 | 1187 | 1154 | 288.5 |
| D | 2 | 234 | 45079 | 152.23 | 1187 | 1154 | 288.5 |
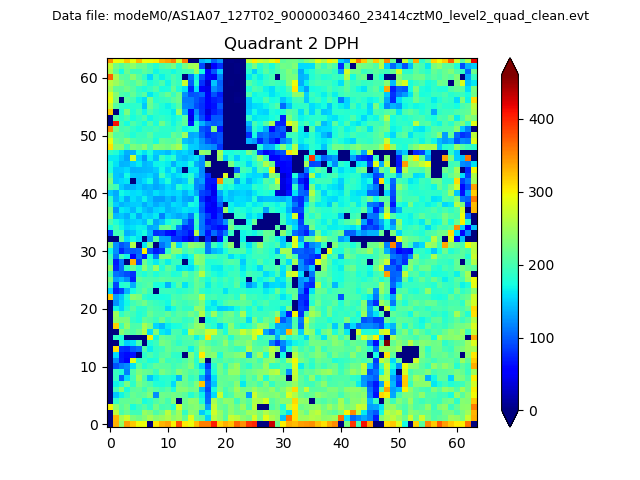
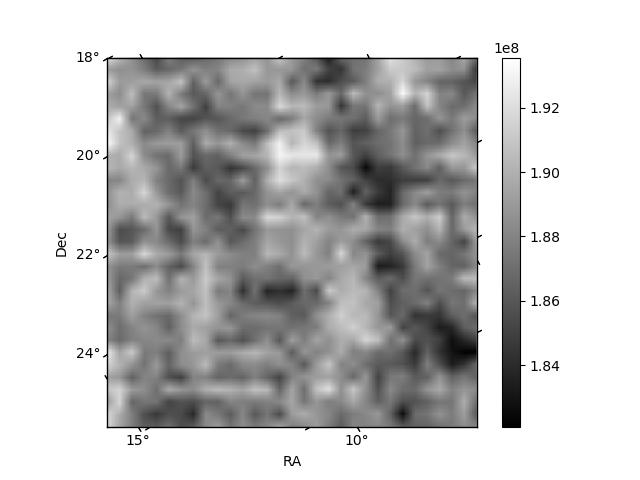
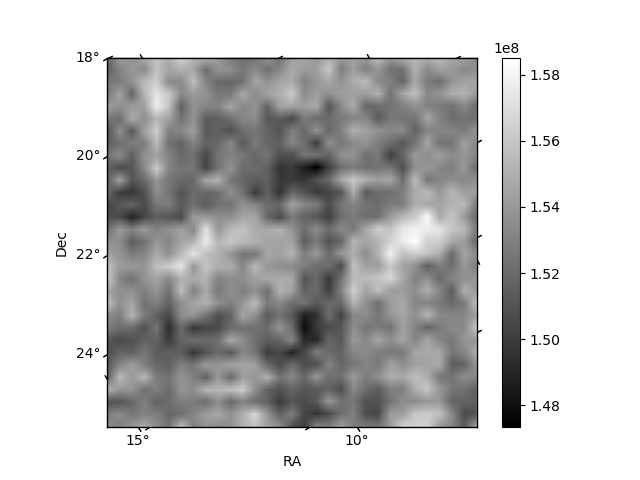
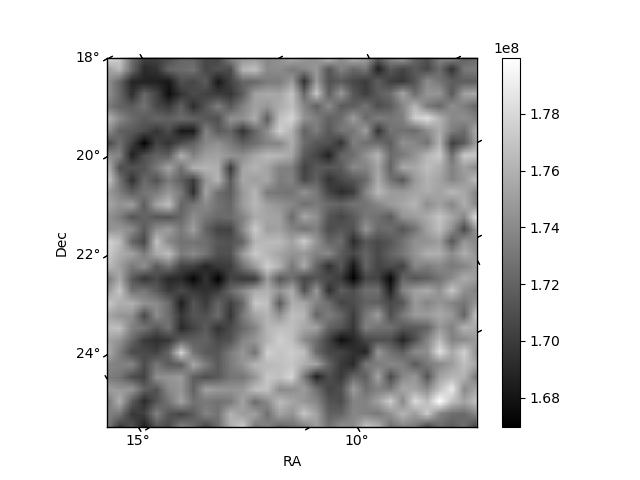
Histogram calculated using DETX and DETY for each event in the final _common_clean file
| Quadrant A | 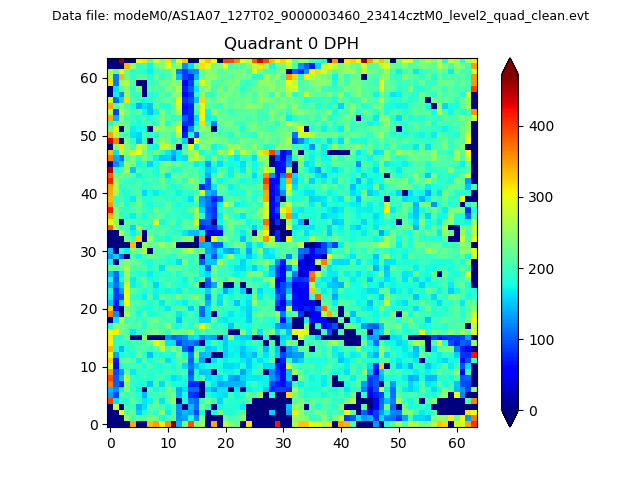 |
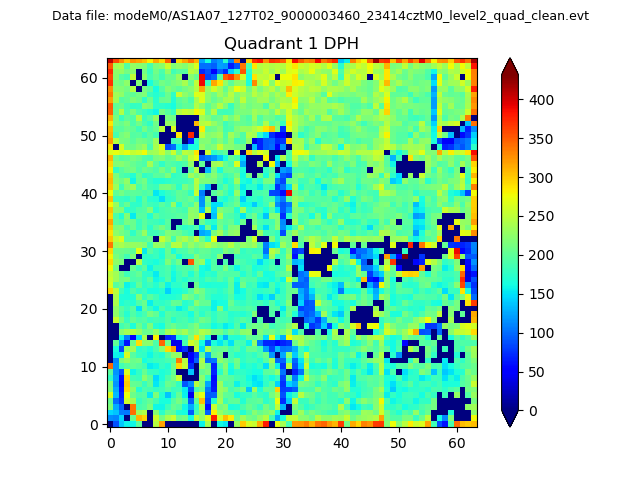 |
Quadrant B |
|---|---|---|---|
| Quadrant D | 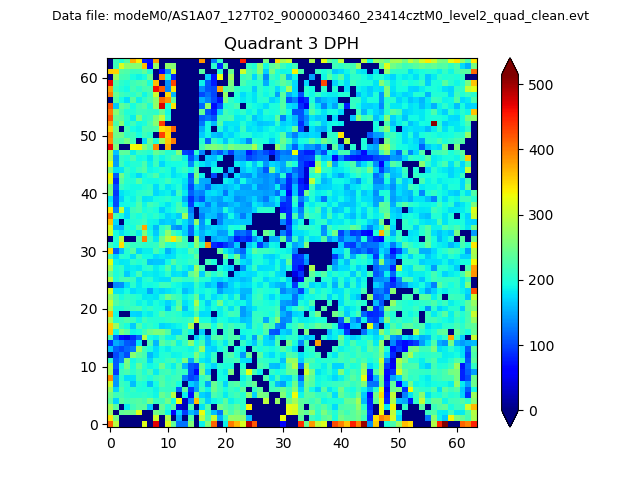 |
 |
Quadrant C |
| Plot type | Count rate plots | Images |
|---|---|---|
| Comparison with Poisson distribution Blue bars denote a histogram of data divided into 1 sec bins. Red curve is a Poisson curve with rate = median count rate of data. |
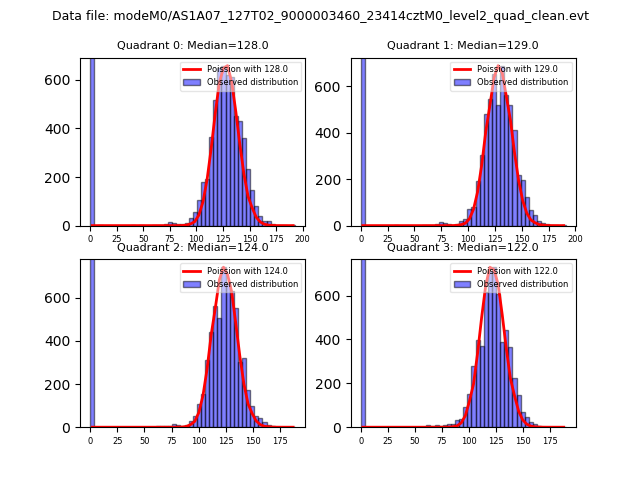 |
 |
| Quadrant-wise count rates Data is divided into 100 sec bins |
 |
|
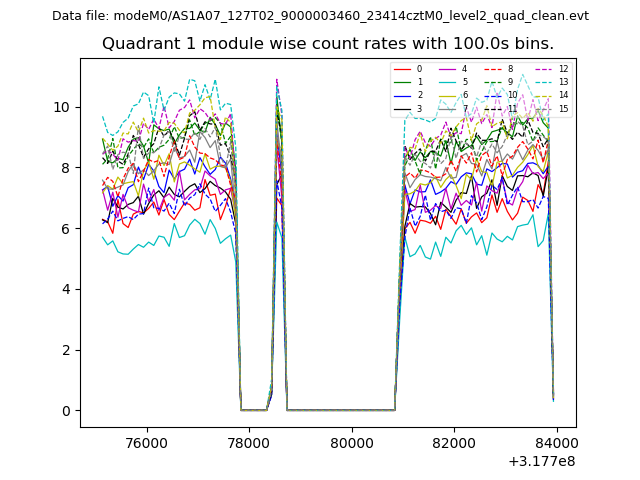
| Module-wise count rates for Quadrant A Data is divided into 100 sec bins |
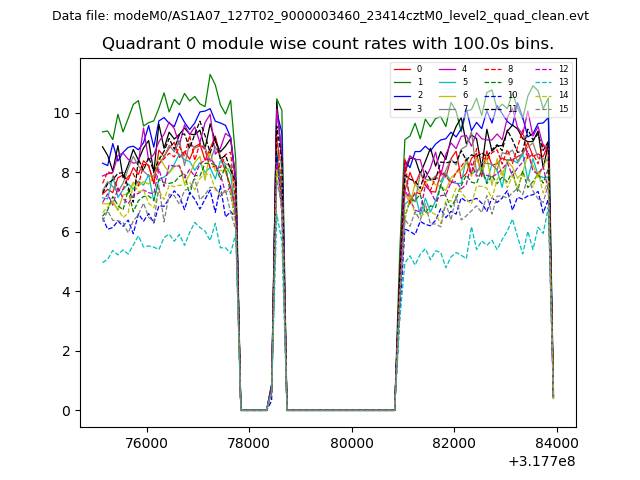 |
 |
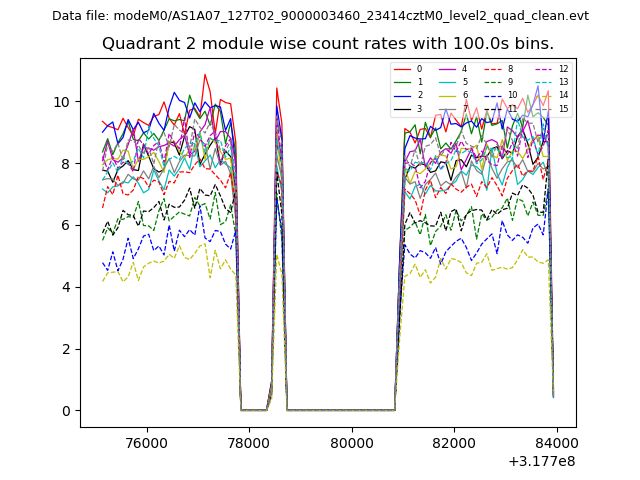
| Module-wise count rates for Quadrant B Data is divided into 100 sec bins |
 |
 |
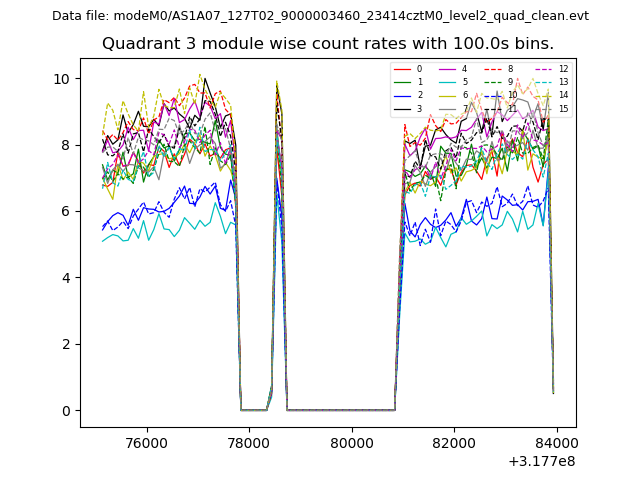
| Module-wise count rates for Quadrant C Data is divided into 100 sec bins |
 |
 |
| Module-wise count rates for Quadrant D Data is divided into 100 sec bins |
 |
 |
| Parameter | Plot |
|---|---|
| CZT HV Monitor | 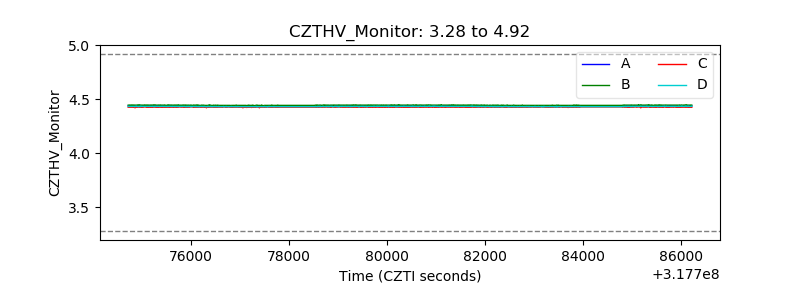 |
| D_VDD | 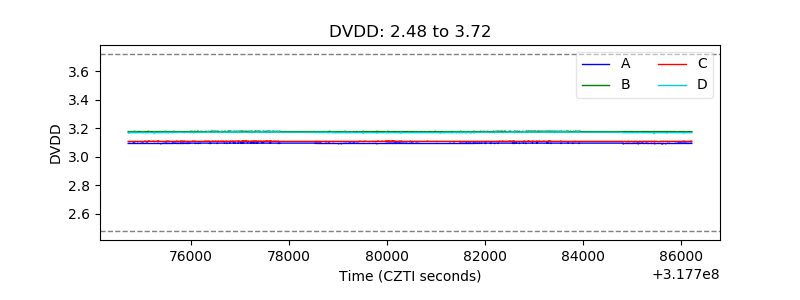 |
| Temperature 1 | 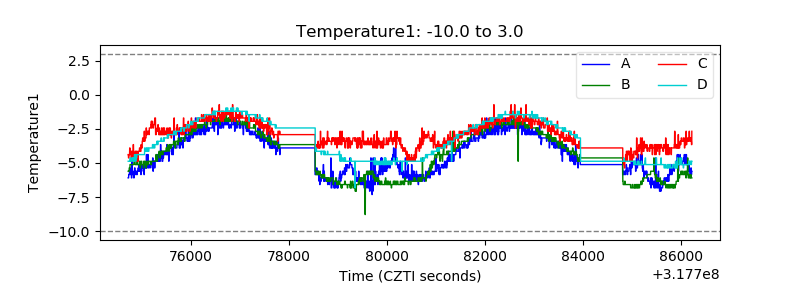 |
| Veto HV Monitor | 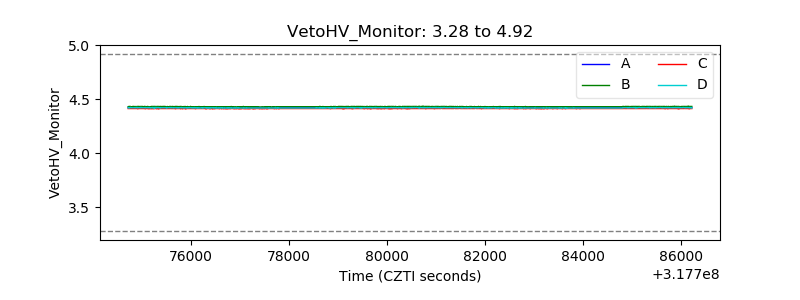 |
| Veto LLD | 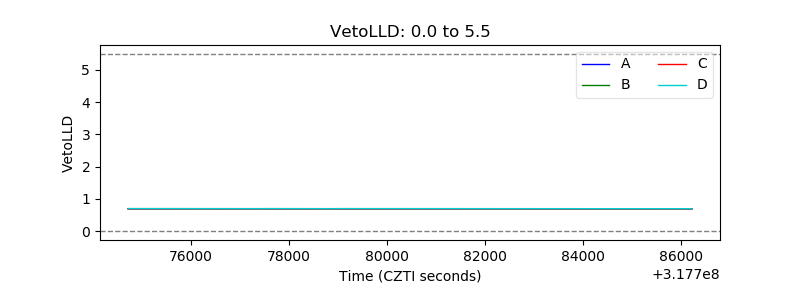 |
| Alpha Counter | 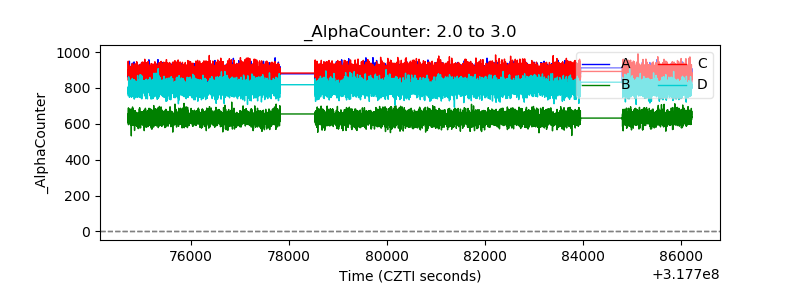 |
| _CPM_Rate | 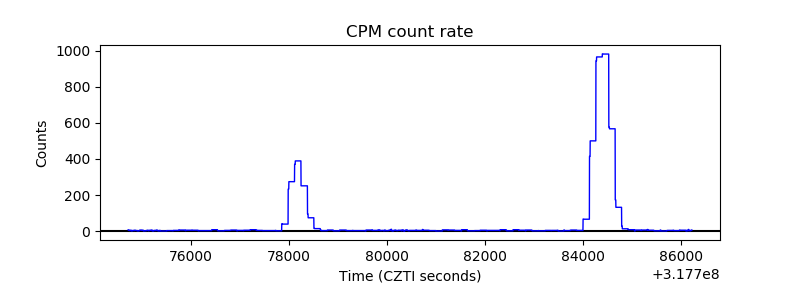 |
| CZT Counter | 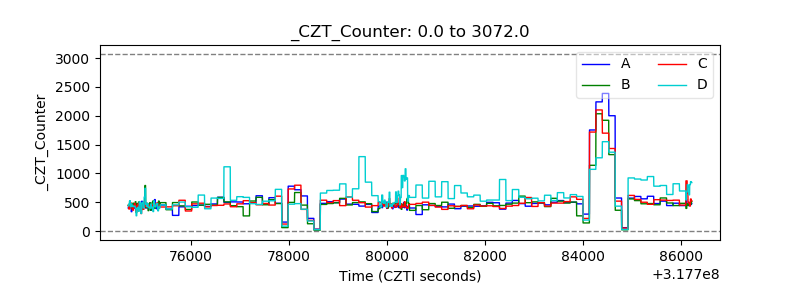 |
| +2.5 Volts monitor |  |
| +5 Volts monitor |  |
| _ROLL_ROT | 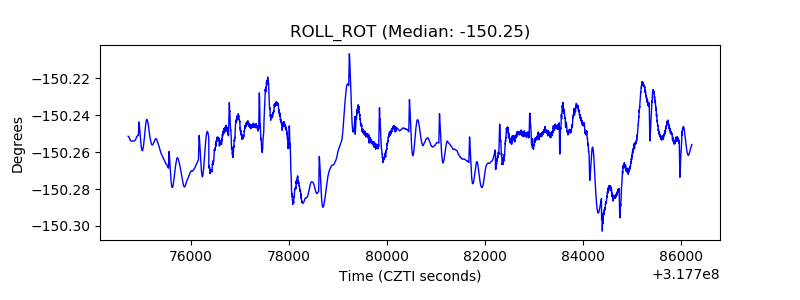 |
| _Roll_DEC | 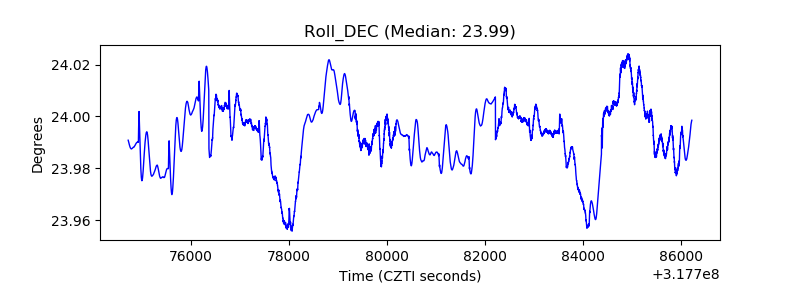 |
| _Roll_RA | 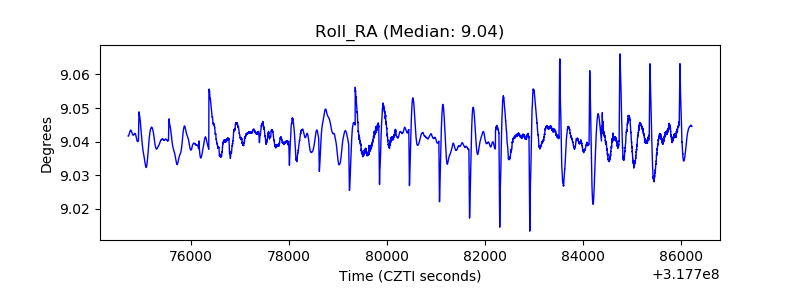 |
| Veto Counter | 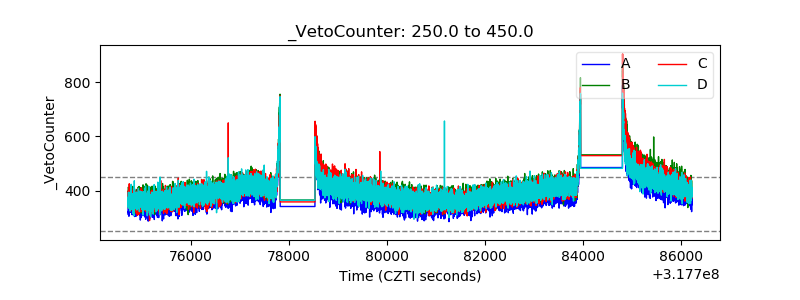 |