| Param | Original file | Final file |
|---|---|---|
| Filename | modeM0/AS1A07_127T02_9000003460_23418cztM0_level2.evt | modeM0/AS1A07_127T02_9000003460_23418cztM0_level2_quad_clean.evt |
| Size (bytes) | 474,577,920 | 93,962,880 |
| Size | 452.6 MB | 89.6 MB |
| Events in quadrant A | 3,434,482 | 617,766 |
| Events in quadrant B | 3,580,539 | 626,057 |
| Events in quadrant C | 3,481,901 | 583,504 |
| Events in quadrant D | 3,446,678 | 577,344 |
| Mode M9 | |||
|---|---|---|---|
| Quadrant | BADHDUFLAG | Total packets | Discarded packets |
| A | 0 | 13 | 0 |
| B | 0 | 14 | 0 |
| C | 0 | 14 | 0 |
| D | 0 | 14 | 0 |
| Mode M0 | |||
|---|---|---|---|
| Quadrant | BADHDUFLAG | Total packets | Discarded packets |
| A | 0 | 14238 | 2 |
| B | 0 | 14709 | 1 |
| C | 0 | 14363 | 1 |
| D | 0 | 14245 | 1 |
| Mode SS | |||
|---|---|---|---|
| Quadrant | BADHDUFLAG | Total packets | Discarded packets |
| A | 0 | 128 | 0 |
| B | 0 | 128 | 0 |
| C | 0 | 128 | 0 |
| D | 0 | 128 | 0 |
| Quadrant | Total seconds | Saturated seconds | Saturation percentage |
|---|---|---|---|
| A | 6320 | 80 | 1.265823% |
| B | 6320 | 111 | 1.756329% |
| C | 6320 | 150 | 2.373418% |
| D | 6320 | 60 | 0.949367% |
Noise dominated data is calculated using 1-second bins in cleaned event files. If a bin has >2000 counts, and if more than 50% of those come from <1% of pixels, then it is considered to be noise-dominated and hence unusable.
| Quadrant | # 1 sec bins | Bins with >0 counts | Bins with >2000 counts | High rate bins dominated by noise | Noise dominated (total time) | Noise dominated (detector-on time) | Marked lightcurve |
|---|---|---|---|---|---|---|---|
| A | 7570 | 6320 | 0 | 0 | 0.00% | 0.00% | 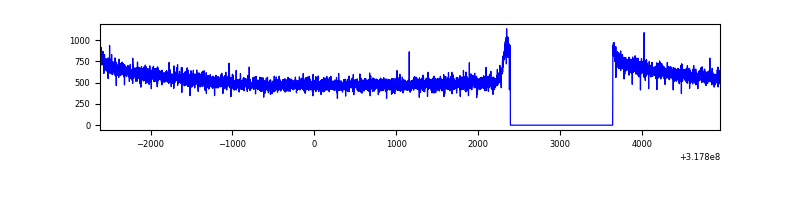 |
| B | 7570 | 6320 | 5 | 5 | 0.07% | 0.08% | 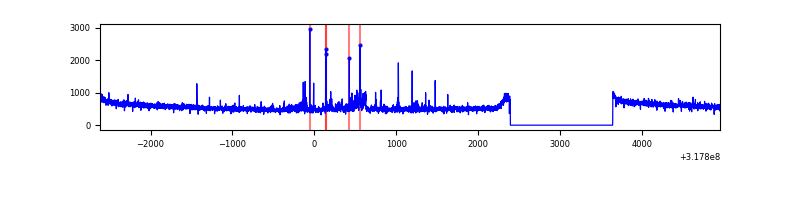 |
| C | 7570 | 6320 | 11 | 11 | 0.15% | 0.17% | 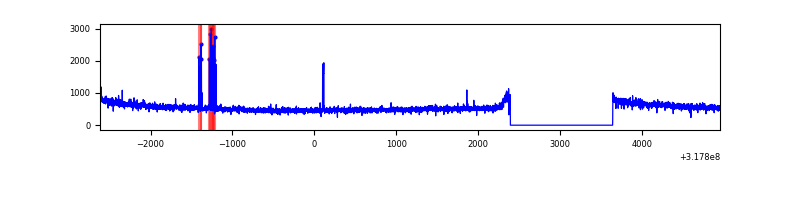 |
| D | 7570 | 6320 | 4 | 4 | 0.05% | 0.06% | 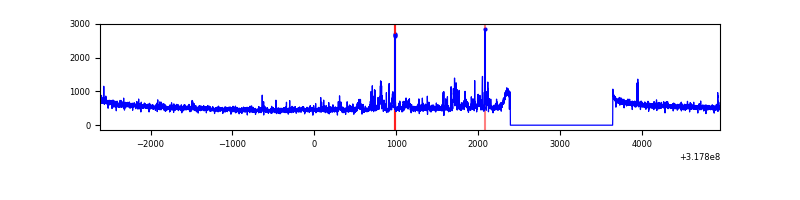 |
Top three noisy pixels from each quadrant. If the there are fewer than three noisy pixels in the level2.evt file, extra rows are filled as -1
| Pixel properties | Quadrant properties | ||||||
|---|---|---|---|---|---|---|---|
| Quadrant | DetID | PixID | Counts | Sigma | Mean | Median | Sigma |
| A | 13 | 254 | 10045 | 51.6 | 891 | 877 | 177.7 |
| A | 0 | 226 | 7925 | 39.67 | 891 | 877 | 177.7 |
| A | 3 | 137 | 7198 | 35.58 | 891 | 877 | 177.7 |
| B | 0 | 190 | 75824 | 451.95 | 884 | 864 | 165.9 |
| B | 0 | 189 | 47380 | 280.46 | 884 | 864 | 165.9 |
| B | 12 | 111 | 19373 | 111.59 | 884 | 864 | 165.9 |
| C | 14 | 238 | 136912 | 710.62 | 831 | 838 | 191.5 |
| C | 10 | 9 | 94337 | 488.28 | 831 | 838 | 191.5 |
| C | 7 | 247 | 13882 | 68.12 | 831 | 838 | 191.5 |
| D | 1 | 52 | 217938 | 1065.8 | 850 | 826 | 203.7 |
| D | 2 | 234 | 25543 | 121.34 | 850 | 826 | 203.7 |
| D | 9 | 35 | 9110 | 40.67 | 850 | 826 | 203.7 |
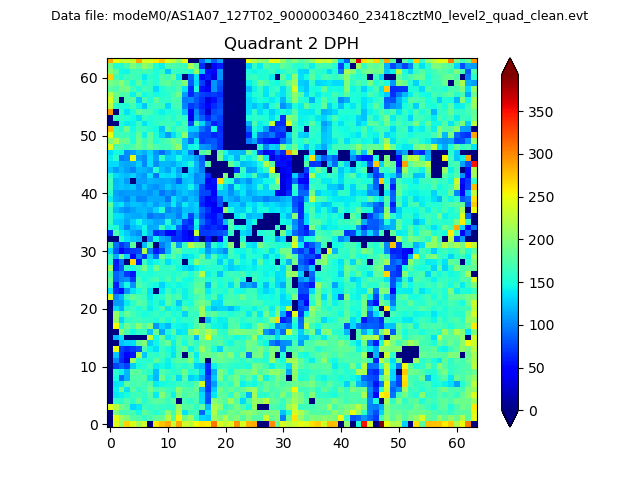
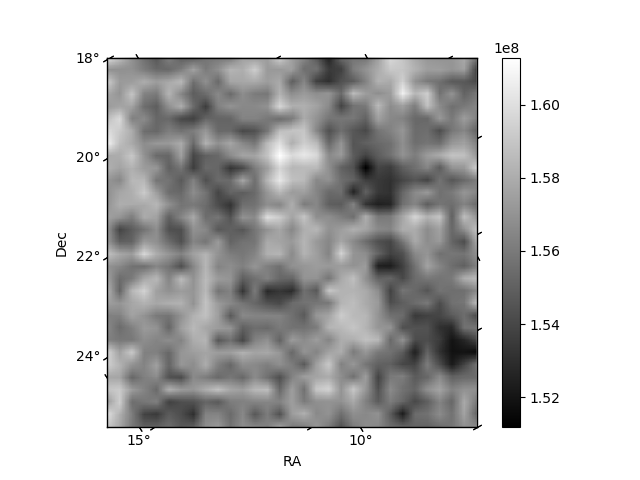
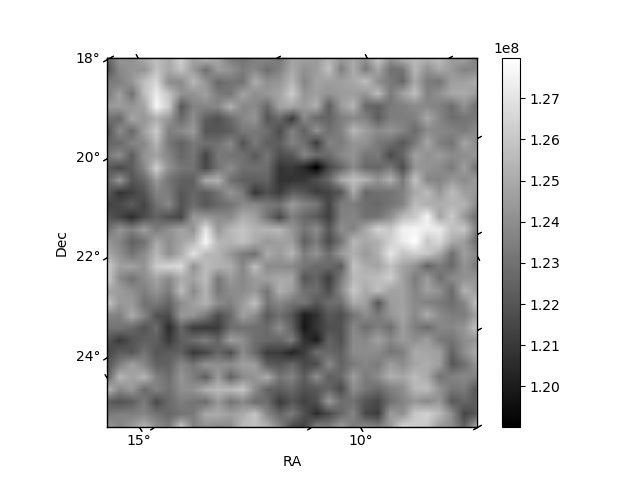
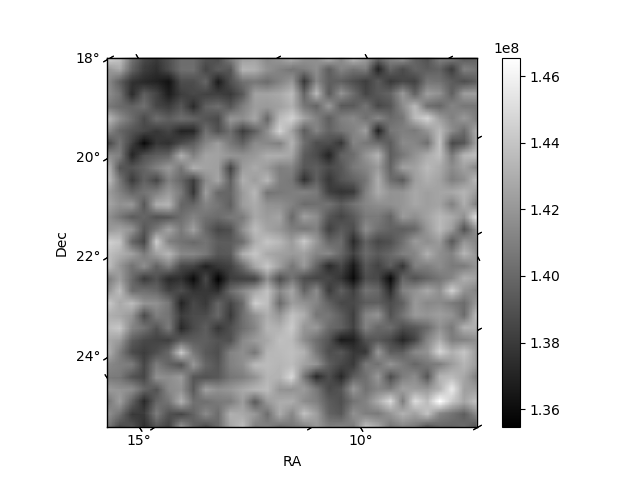
Histogram calculated using DETX and DETY for each event in the final _common_clean file
| Quadrant A | 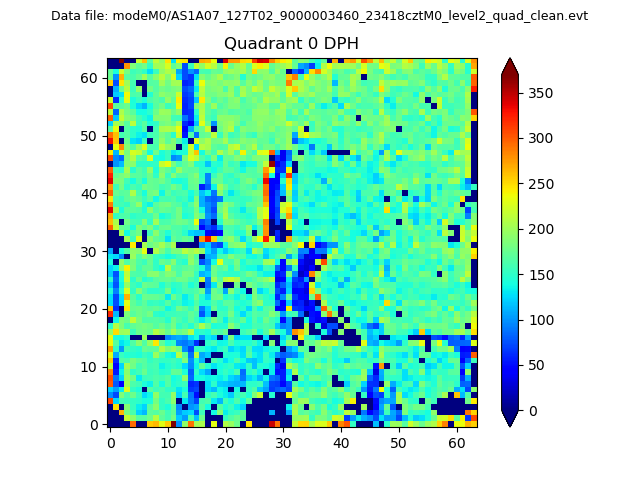 |
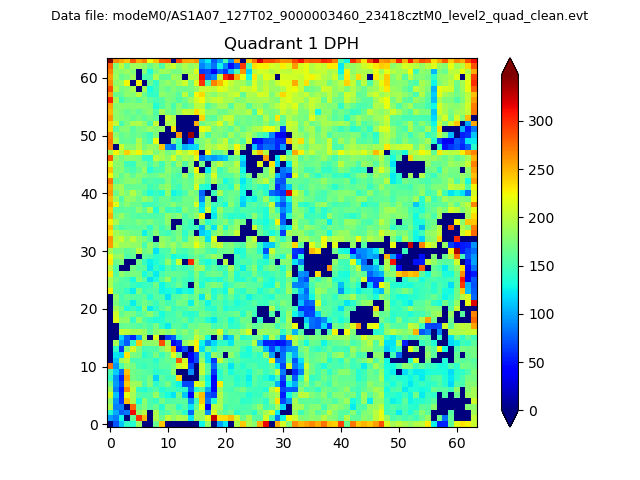 |
Quadrant B |
|---|---|---|---|
| Quadrant D | 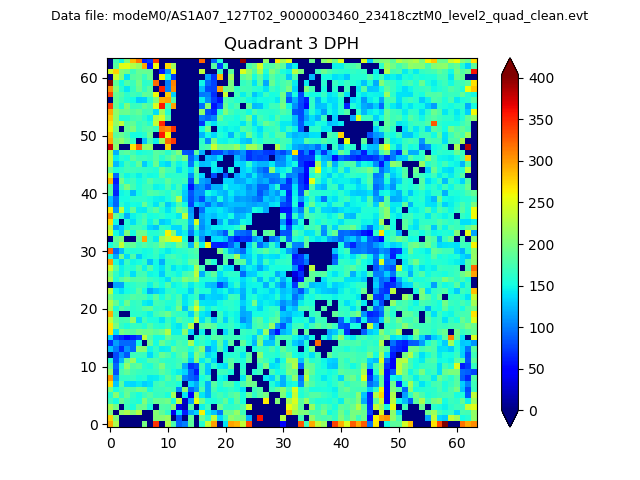 |
 |
Quadrant C |
| Plot type | Count rate plots | Images |
|---|---|---|
| Comparison with Poisson distribution Blue bars denote a histogram of data divided into 1 sec bins. Red curve is a Poisson curve with rate = median count rate of data. |
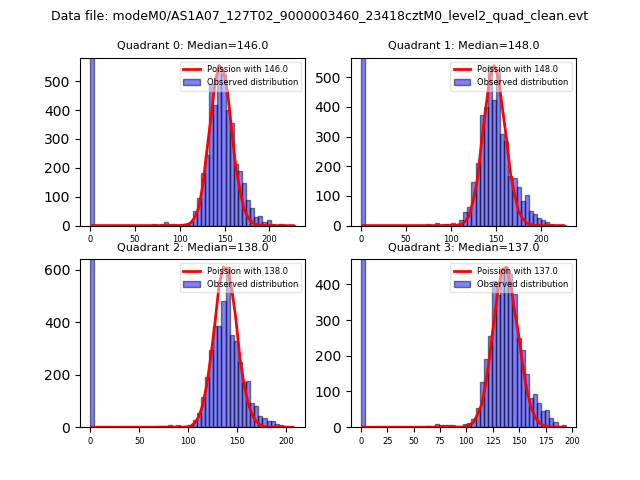 |
 |
| Quadrant-wise count rates Data is divided into 100 sec bins |
 |
|
| Module-wise count rates for Quadrant A Data is divided into 100 sec bins |
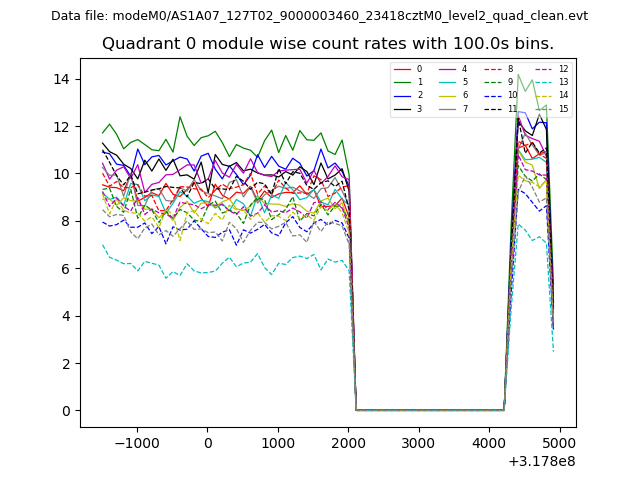 |
 |
| Module-wise count rates for Quadrant B Data is divided into 100 sec bins |
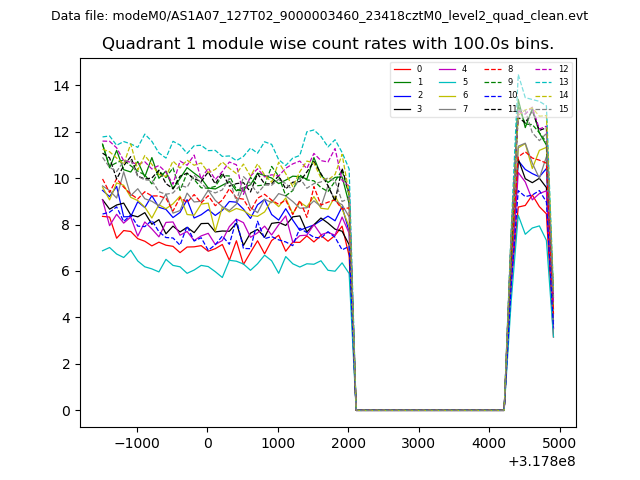 |
 |
| Module-wise count rates for Quadrant C Data is divided into 100 sec bins |
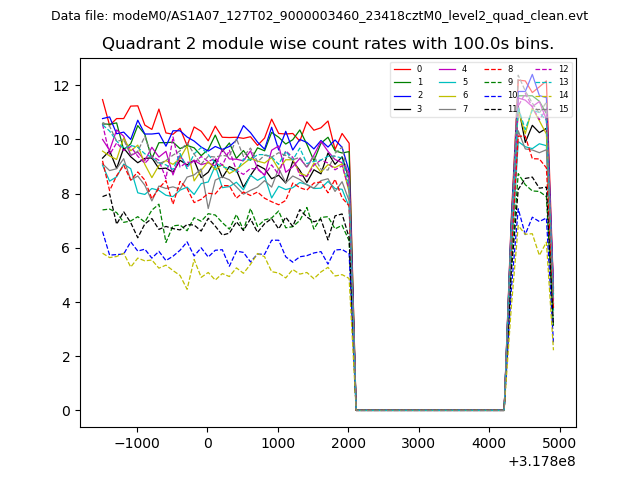 |
 |
| Module-wise count rates for Quadrant D Data is divided into 100 sec bins |
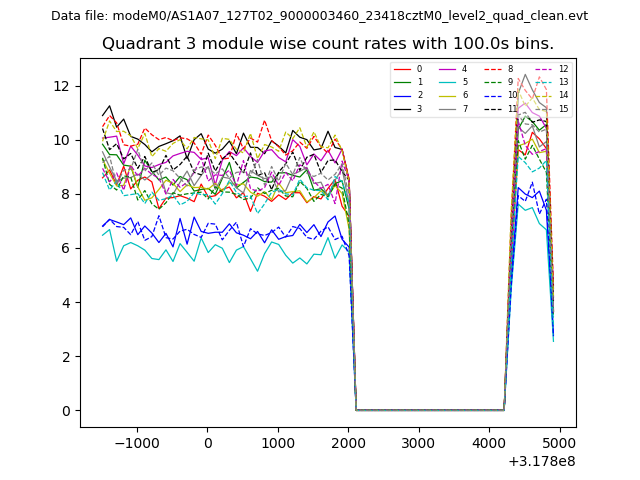 |
 |
| Parameter | Plot |
|---|---|
| CZT HV Monitor | 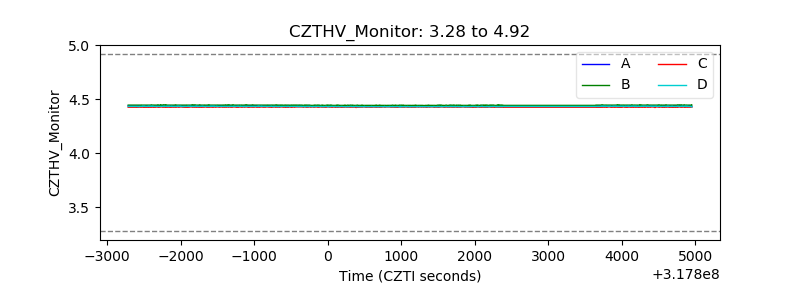 |
| D_VDD | 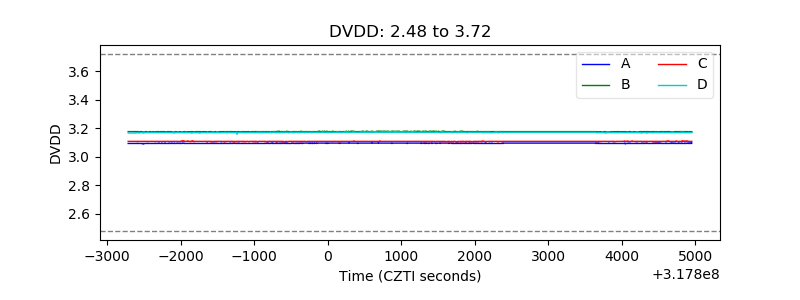 |
| Temperature 1 | 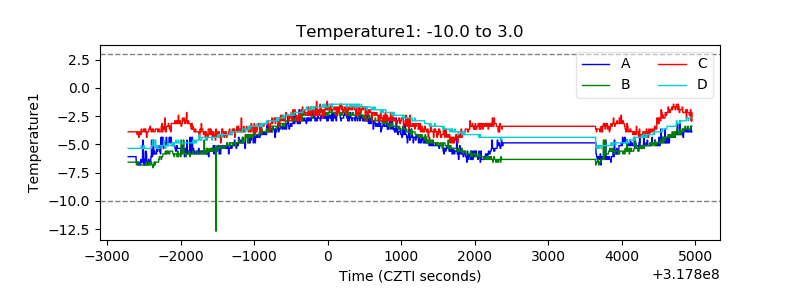 |
| Veto HV Monitor | 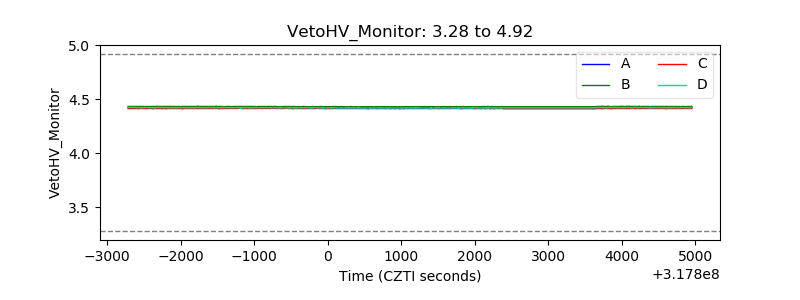 |
| Veto LLD | 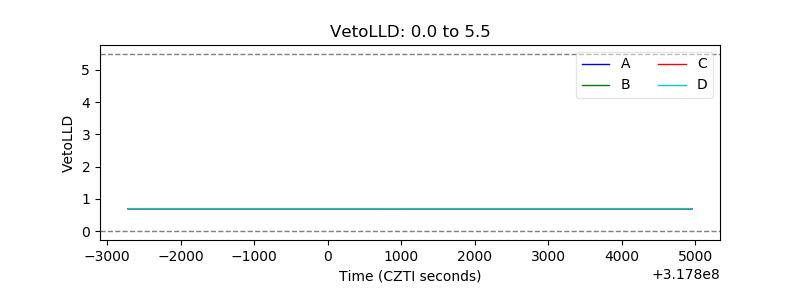 |
| Alpha Counter | 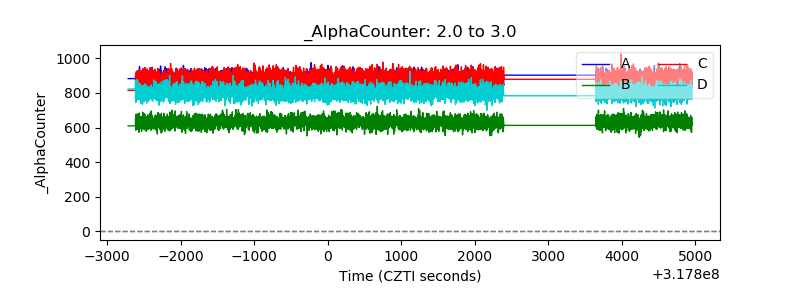 |
| _CPM_Rate | 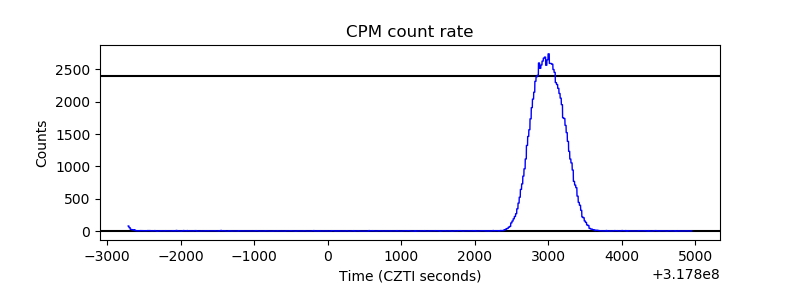 |
| CZT Counter |  |
| +2.5 Volts monitor |  |
| +5 Volts monitor |  |
| _ROLL_ROT | 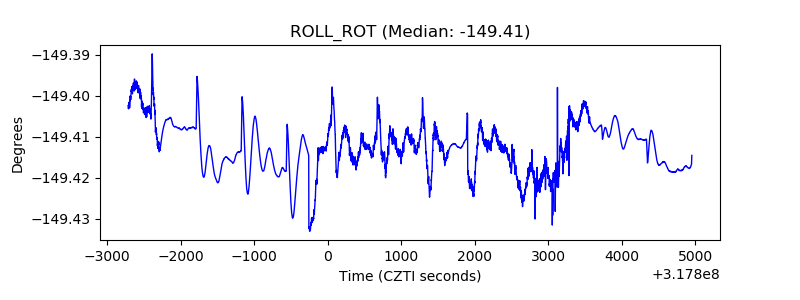 |
| _Roll_DEC | 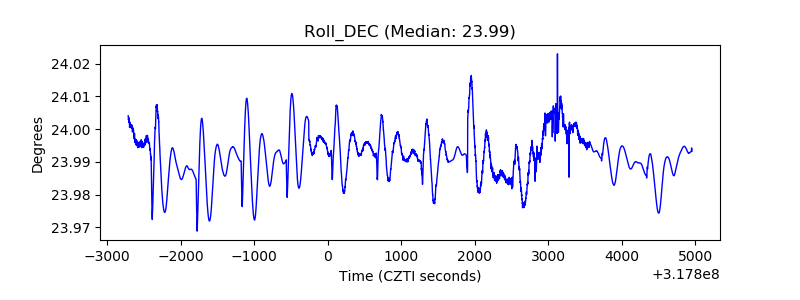 |
| _Roll_RA |  |
| Veto Counter | 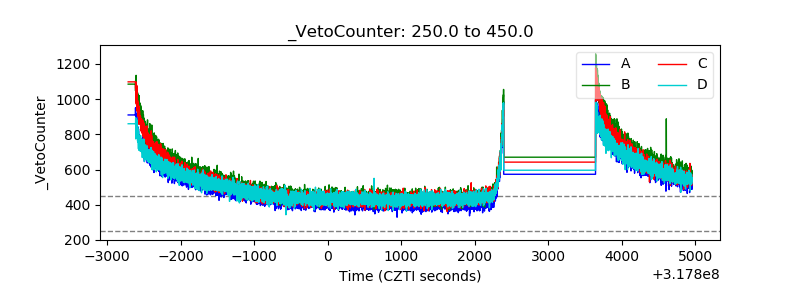 |