| Param | Original file | Final file |
|---|---|---|
| Filename | modeM0/AS1A07_127T02_9000003460_23420cztM0_level2.evt | modeM0/AS1A07_127T02_9000003460_23420cztM0_level2_quad_clean.evt |
| Size (bytes) | 443,439,360 | 116,484,480 |
| Size | 422.9 MB | 111.1 MB |
| Events in quadrant A | 3,215,656 | 807,602 |
| Events in quadrant B | 3,292,639 | 820,266 |
| Events in quadrant C | 3,172,614 | 746,709 |
| Events in quadrant D | 3,349,402 | 742,869 |
| Mode M9 | |||
|---|---|---|---|
| Quadrant | BADHDUFLAG | Total packets | Discarded packets |
| A | 0 | 13 | 0 |
| B | 0 | 13 | 0 |
| C | 0 | 13 | 0 |
| D | 0 | 13 | 0 |
| Mode M0 | |||
|---|---|---|---|
| Quadrant | BADHDUFLAG | Total packets | Discarded packets |
| A | 0 | 13204 | 17 |
| B | 0 | 13453 | 11 |
| C | 0 | 12948 | 11 |
| D | 0 | 13458 | 26 |
| Mode SS | |||
|---|---|---|---|
| Quadrant | BADHDUFLAG | Total packets | Discarded packets |
| A | 0 | 118 | 2 |
| B | 0 | 118 | 0 |
| C | 0 | 118 | 0 |
| D | 0 | 118 | 2 |
| Quadrant | Total seconds | Saturated seconds | Saturation percentage |
|---|---|---|---|
| A | 5879 | 112 | 1.905086% |
| B | 5881 | 139 | 2.363544% |
| C | 5881 | 117 | 1.989458% |
| D | 5876 | 92 | 1.565691% |
Noise dominated data is calculated using 1-second bins in cleaned event files. If a bin has >2000 counts, and if more than 50% of those come from <1% of pixels, then it is considered to be noise-dominated and hence unusable.
| Quadrant | # 1 sec bins | Bins with >0 counts | Bins with >2000 counts | High rate bins dominated by noise | Noise dominated (total time) | Noise dominated (detector-on time) | Marked lightcurve |
|---|---|---|---|---|---|---|---|
| A | 7226 | 5886 | 0 | 0 | 0.00% | 0.00% | 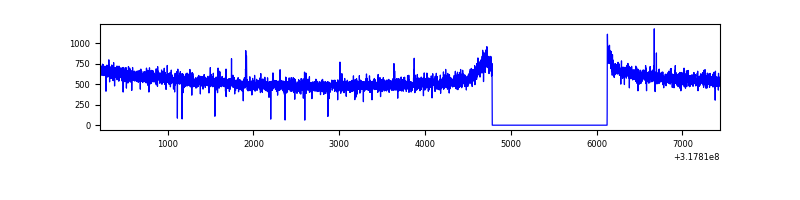 |
| B | 7226 | 5885 | 2 | 2 | 0.03% | 0.03% | 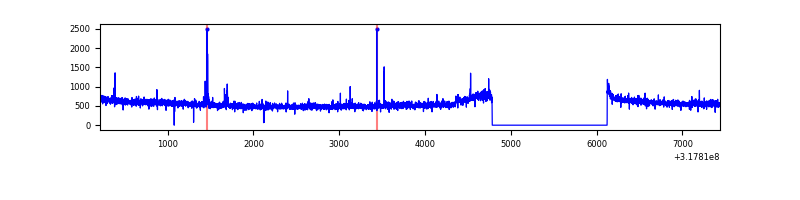 |
| C | 7226 | 5886 | 0 | 0 | 0.00% | 0.00% | 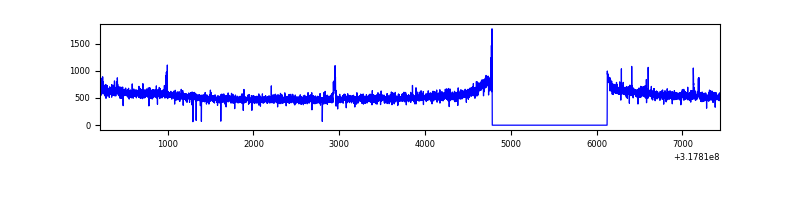 |
| D | 7226 | 5886 | 6 | 6 | 0.08% | 0.10% | 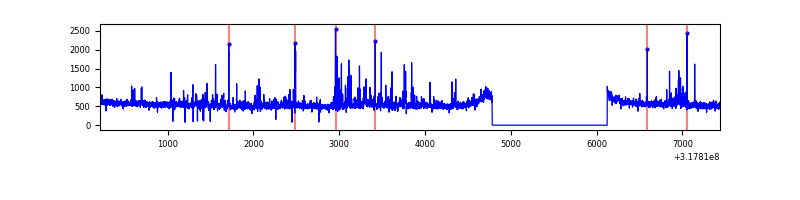 |
Top three noisy pixels from each quadrant. If the there are fewer than three noisy pixels in the level2.evt file, extra rows are filled as -1
| Pixel properties | Quadrant properties | ||||||
|---|---|---|---|---|---|---|---|
| Quadrant | DetID | PixID | Counts | Sigma | Mean | Median | Sigma |
| A | 13 | 254 | 9314 | 51.48 | 833 | 818 | 165.0 |
| A | 0 | 226 | 7356 | 39.61 | 833 | 818 | 165.0 |
| A | 3 | 137 | 6419 | 33.94 | 833 | 818 | 165.0 |
| B | 12 | 0 | 31239 | 199.47 | 820 | 804 | 152.6 |
| B | 0 | 190 | 30075 | 191.84 | 820 | 804 | 152.6 |
| B | 12 | 111 | 17383 | 108.66 | 820 | 804 | 152.6 |
| C | 14 | 238 | 125306 | 702.68 | 767 | 774 | 177.2 |
| C | 10 | 9 | 46075 | 255.62 | 767 | 774 | 177.2 |
| C | 3 | 233 | 10372 | 54.16 | 767 | 774 | 177.2 |
| D | 1 | 52 | 198558 | 1033.37 | 793 | 772 | 191.4 |
| D | 9 | 35 | 59902 | 308.94 | 793 | 772 | 191.4 |
| D | 12 | 227 | 47252 | 242.84 | 793 | 772 | 191.4 |
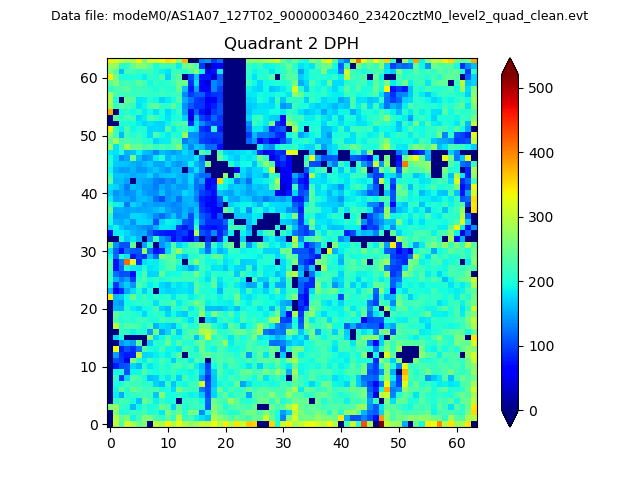
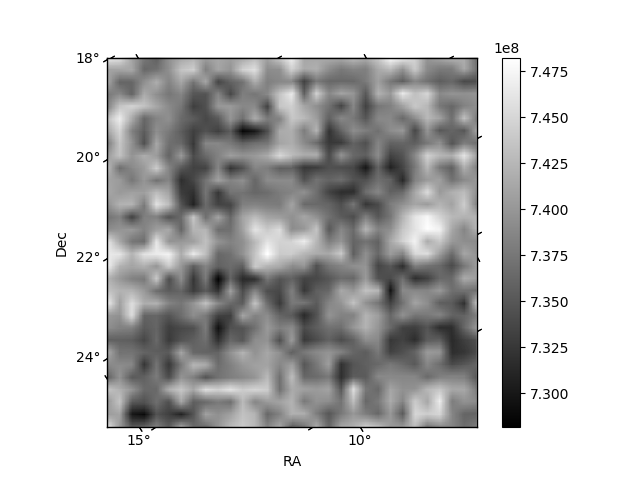
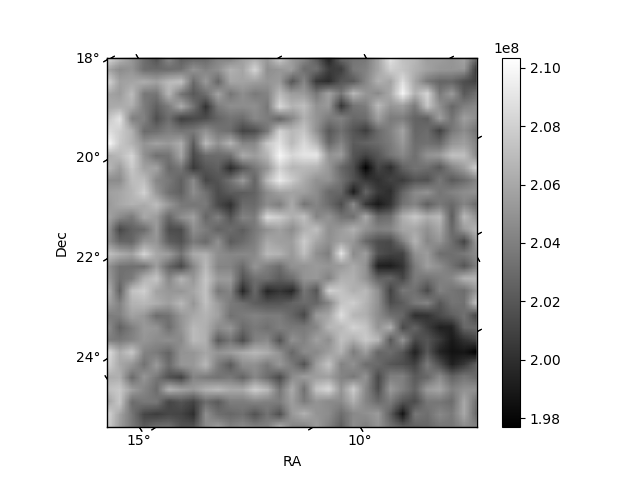
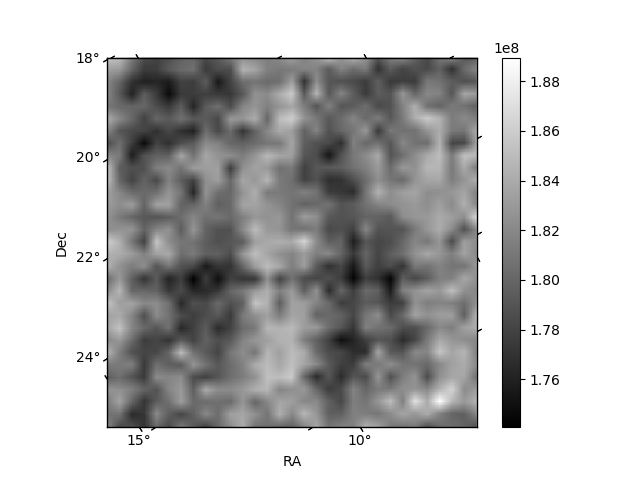
Histogram calculated using DETX and DETY for each event in the final _common_clean file
| Quadrant A | 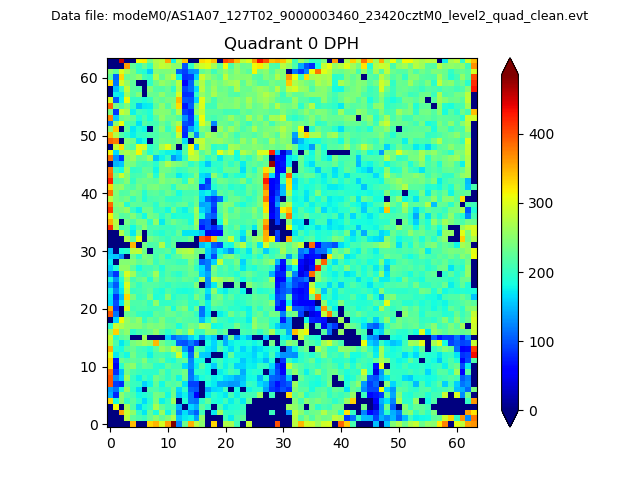 |
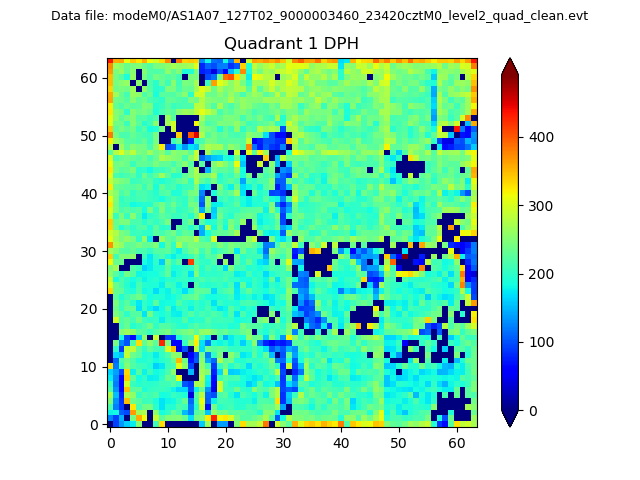 |
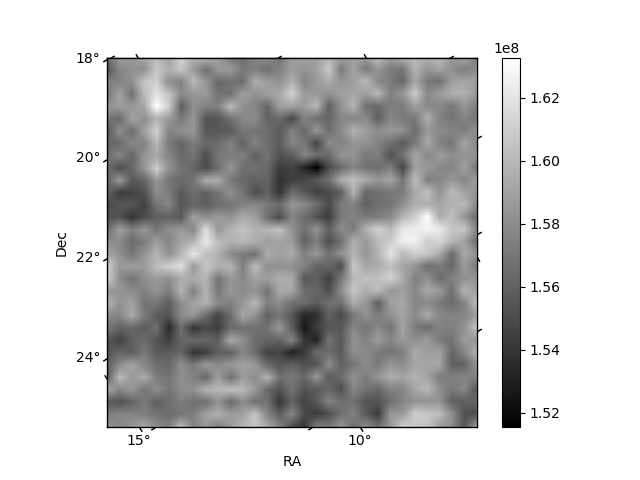
Quadrant B |
|---|---|---|---|
| Quadrant D | 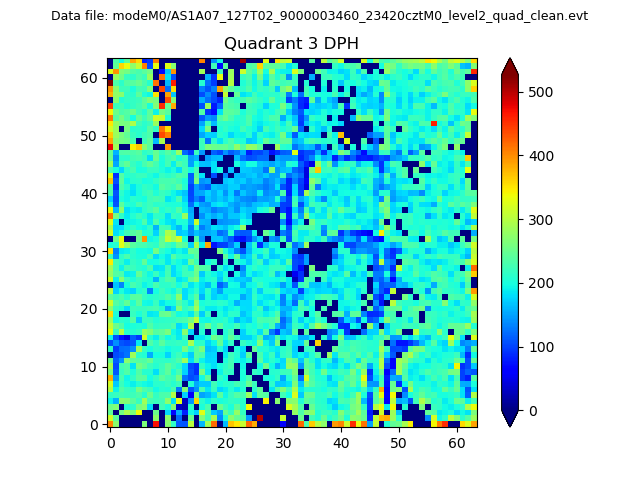 |
 |
Quadrant C |
| Plot type | Count rate plots | Images |
|---|---|---|
| Comparison with Poisson distribution Blue bars denote a histogram of data divided into 1 sec bins. Red curve is a Poisson curve with rate = median count rate of data. |
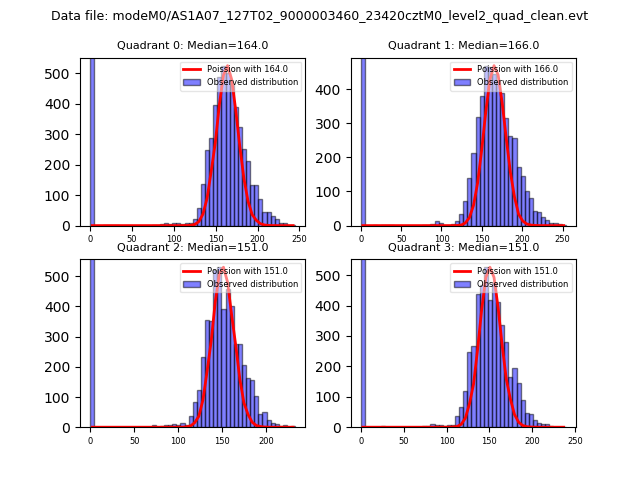 |
 |
| Quadrant-wise count rates Data is divided into 100 sec bins |
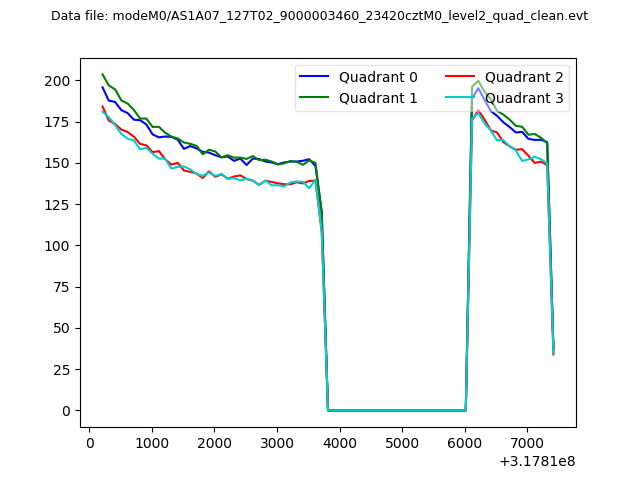 |
|
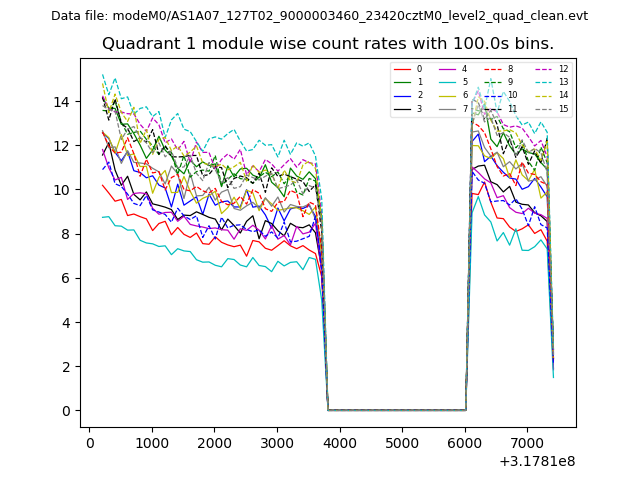
| Module-wise count rates for Quadrant A Data is divided into 100 sec bins |
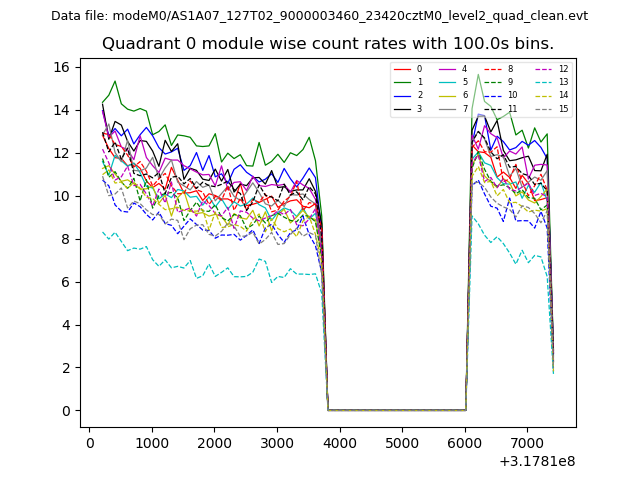 |
 |
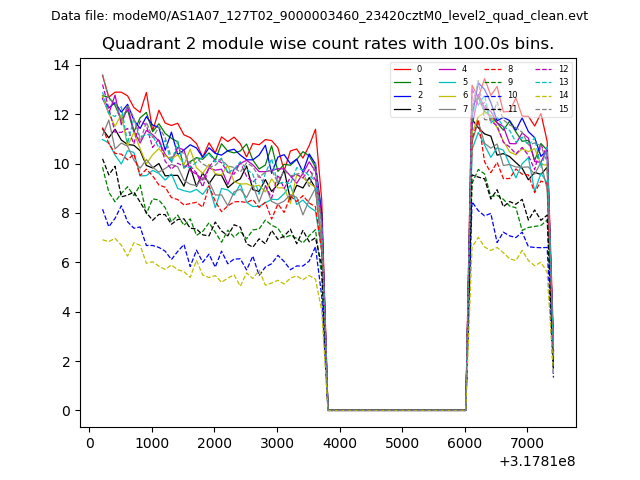
| Module-wise count rates for Quadrant B Data is divided into 100 sec bins |
 |
 |
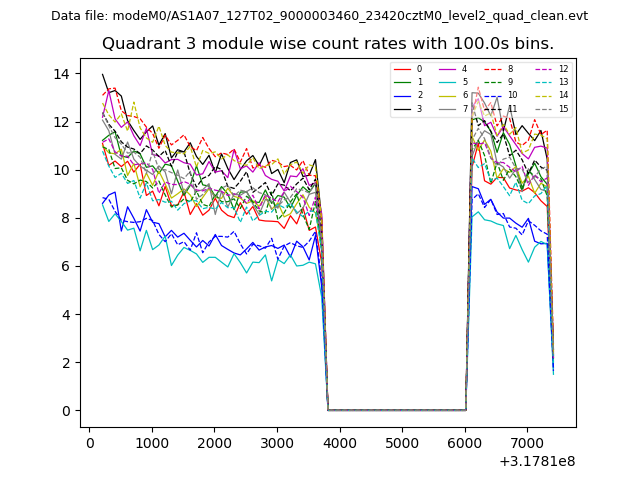
| Module-wise count rates for Quadrant C Data is divided into 100 sec bins |
 |
 |
| Module-wise count rates for Quadrant D Data is divided into 100 sec bins |
 |
 |
| Parameter | Plot |
|---|---|
| CZT HV Monitor | 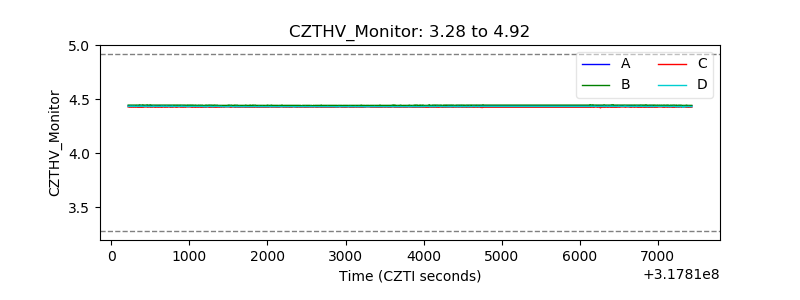 |
| D_VDD | 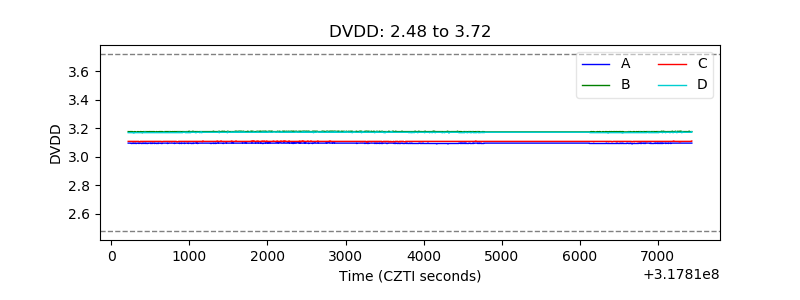 |
| Temperature 1 | 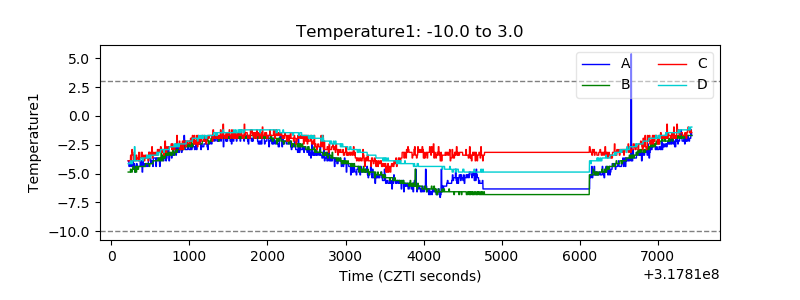 |
| Veto HV Monitor | 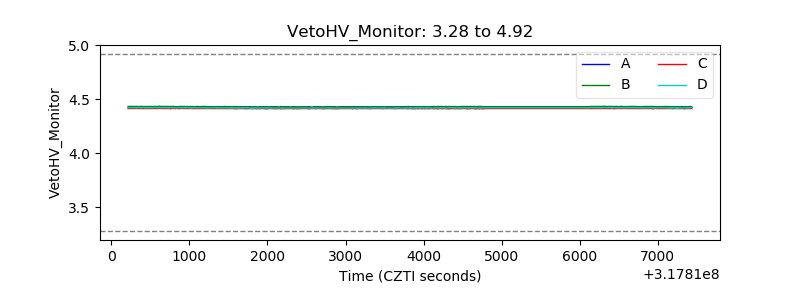 |
| Veto LLD | 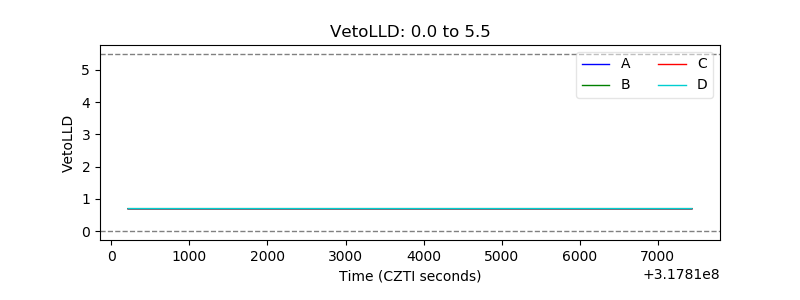 |
| Alpha Counter | 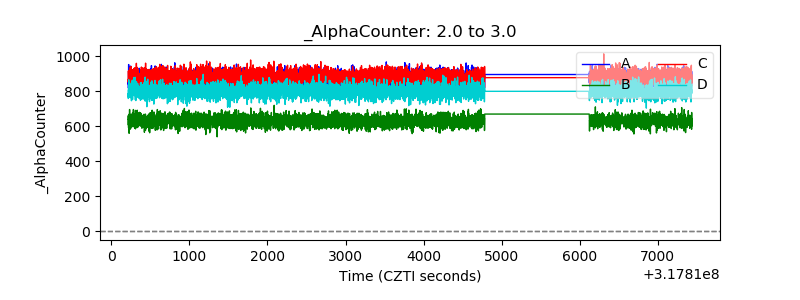 |
| _CPM_Rate | 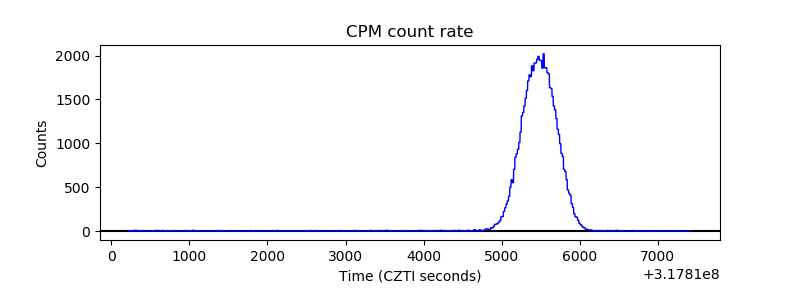 |
| CZT Counter | 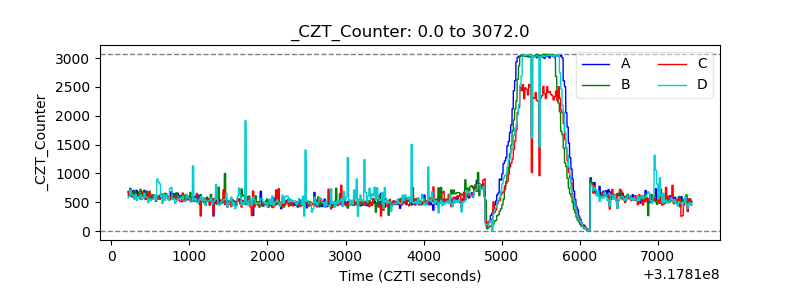 |
| +2.5 Volts monitor |  |
| +5 Volts monitor | 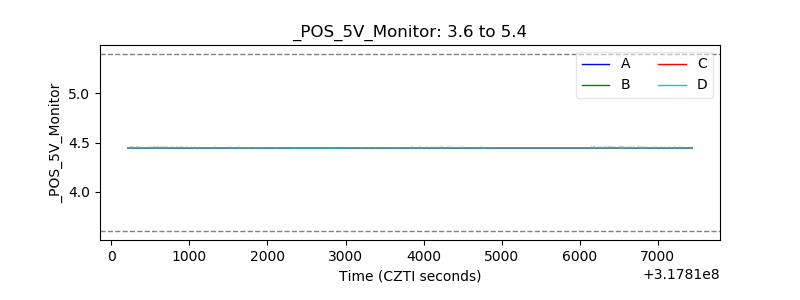 |
| _ROLL_ROT | 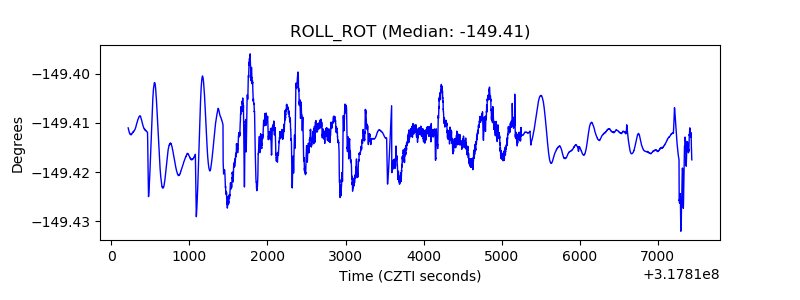 |
| _Roll_DEC | 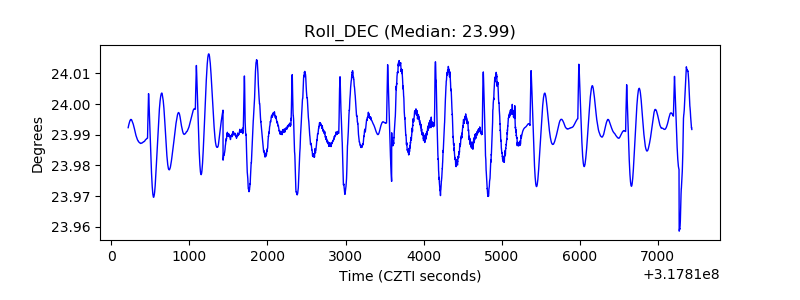 |
| _Roll_RA | 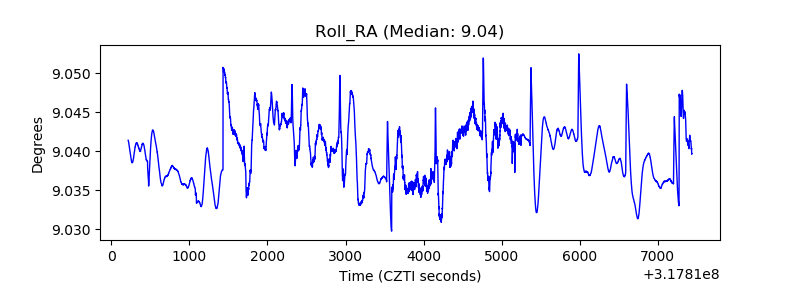 |
| Veto Counter | 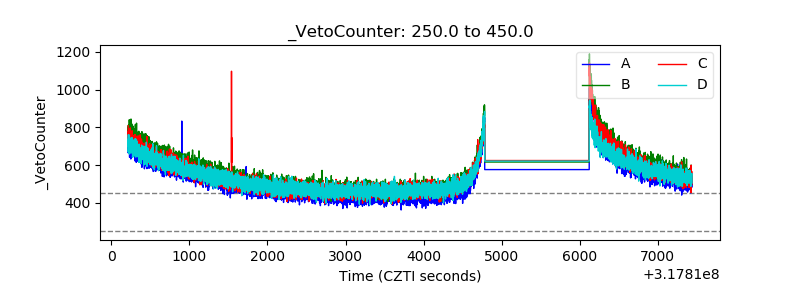 |