| Param | Original file | Final file |
|---|---|---|
| Filename | modeM0/AS1A07_127T02_9000003460_23421cztM0_level2.evt | modeM0/AS1A07_127T02_9000003460_23421cztM0_level2_quad_clean.evt |
| Size (bytes) | 210,813,120 | 66,997,440 |
| Size | 201.0 MB | 63.9 MB |
| Events in quadrant A | 1,534,403 | 470,592 |
| Events in quadrant B | 1,565,868 | 475,209 |
| Events in quadrant C | 1,507,964 | 435,480 |
| Events in quadrant D | 1,573,547 | 437,051 |
| Mode M0 | |||
|---|---|---|---|
| Quadrant | BADHDUFLAG | Total packets | Discarded packets |
| A | 0 | 6421 | 0 |
| B | 0 | 6496 | 0 |
| C | 0 | 6271 | 0 |
| D | 0 | 6506 | 0 |
| Mode SS | |||
|---|---|---|---|
| Quadrant | BADHDUFLAG | Total packets | Discarded packets |
| A | 0 | 58 | 0 |
| B | 0 | 58 | 0 |
| C | 0 | 58 | 0 |
| D | 0 | 58 | 0 |
| Quadrant | Total seconds | Saturated seconds | Saturation percentage |
|---|---|---|---|
| A | 2957 | 4 | 0.135272% |
| B | 2957 | 6 | 0.202908% |
| C | 2957 | 6 | 0.202908% |
| D | 2957 | 3 | 0.101454% |
Noise dominated data is calculated using 1-second bins in cleaned event files. If a bin has >2000 counts, and if more than 50% of those come from <1% of pixels, then it is considered to be noise-dominated and hence unusable.
| Quadrant | # 1 sec bins | Bins with >0 counts | Bins with >2000 counts | High rate bins dominated by noise | Noise dominated (total time) | Noise dominated (detector-on time) | Marked lightcurve |
|---|---|---|---|---|---|---|---|
| A | 2957 | 2957 | 0 | 0 | 0.00% | 0.00% | 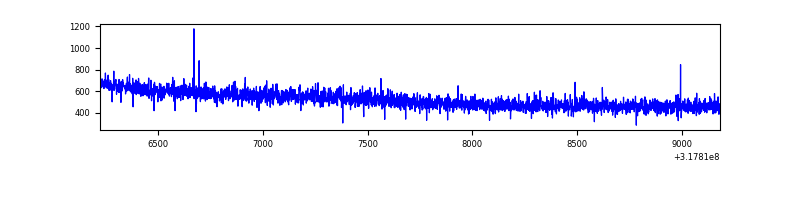 |
| B | 2957 | 2957 | 2 | 2 | 0.07% | 0.07% | 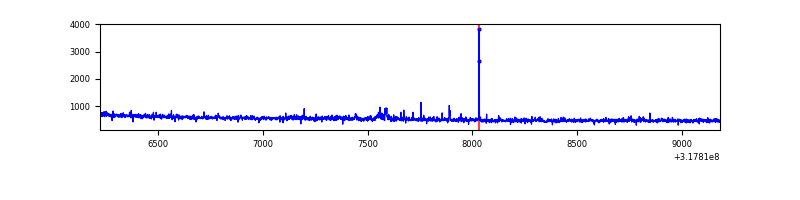 |
| C | 2957 | 2957 | 0 | 0 | 0.00% | 0.00% | 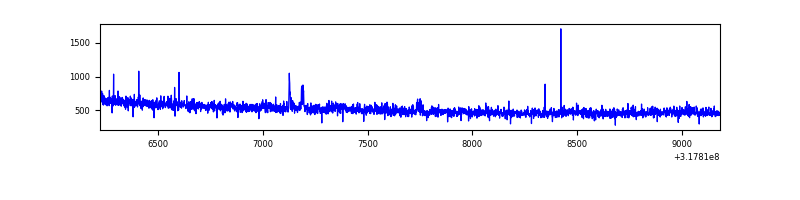 |
| D | 2957 | 2957 | 3 | 3 | 0.10% | 0.10% | 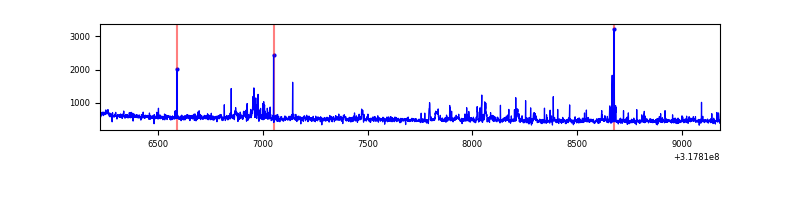 |
Top three noisy pixels from each quadrant. If the there are fewer than three noisy pixels in the level2.evt file, extra rows are filled as -1
| Pixel properties | Quadrant properties | ||||||
|---|---|---|---|---|---|---|---|
| Quadrant | DetID | PixID | Counts | Sigma | Mean | Median | Sigma |
| A | 13 | 254 | 4352 | 50.01 | 398 | 391 | 79.2 |
| A | 0 | 226 | 3522 | 39.53 | 398 | 391 | 79.2 |
| A | 3 | 137 | 3020 | 33.19 | 398 | 391 | 79.2 |
| B | 0 | 189 | 20399 | 273.15 | 391 | 383 | 73.3 |
| B | 0 | 190 | 13430 | 178.05 | 391 | 383 | 73.3 |
| B | 12 | 111 | 8078 | 105.01 | 391 | 383 | 73.3 |
| C | 14 | 238 | 59660 | 699.91 | 364 | 367 | 84.7 |
| C | 10 | 9 | 25698 | 299.02 | 364 | 367 | 84.7 |
| C | 13 | 61 | 2601 | 26.37 | 364 | 367 | 84.7 |
| D | 1 | 52 | 79010 | 839.63 | 380 | 370 | 93.7 |
| D | 12 | 227 | 40412 | 427.53 | 380 | 370 | 93.7 |
| D | 2 | 234 | 13318 | 138.24 | 380 | 370 | 93.7 |
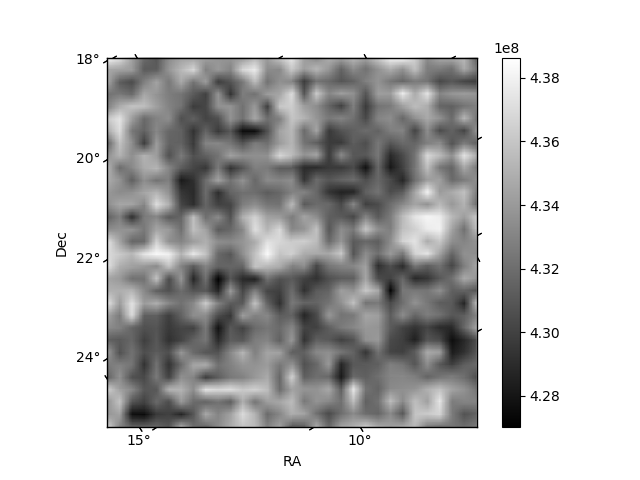
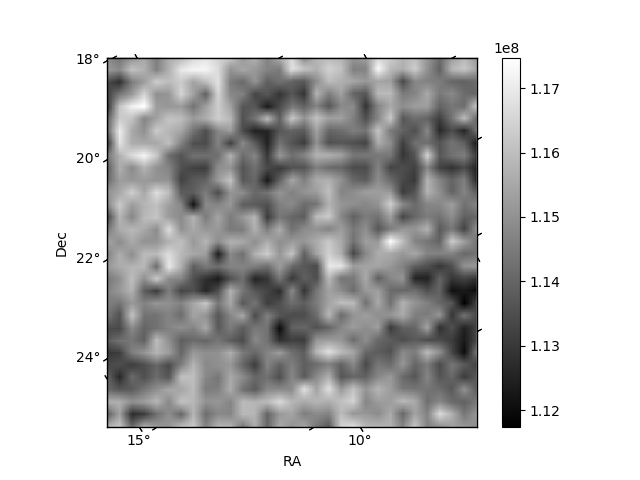
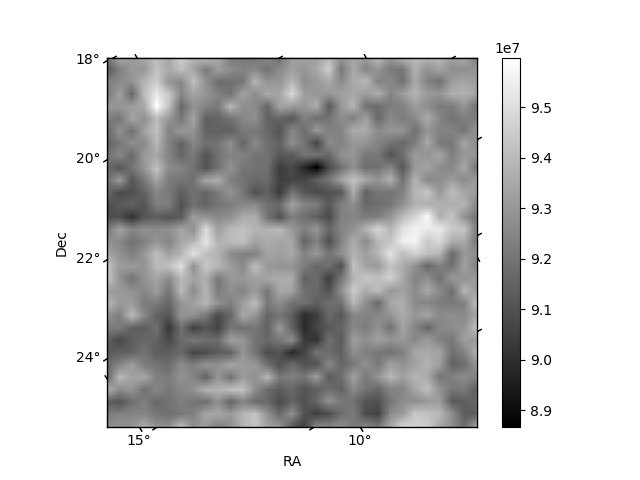
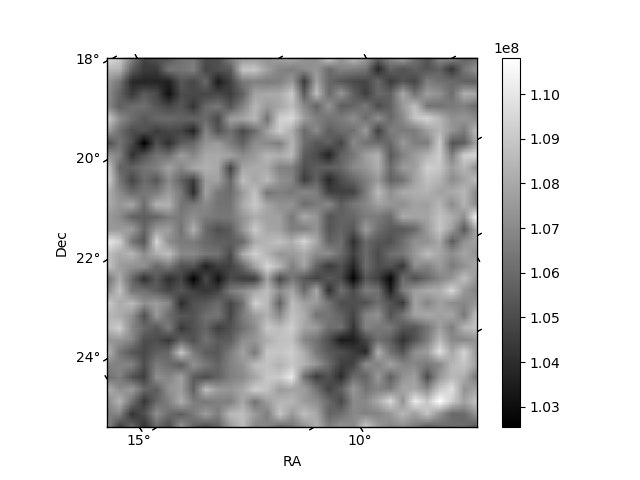
Histogram calculated using DETX and DETY for each event in the final _common_clean file
| Quadrant A | 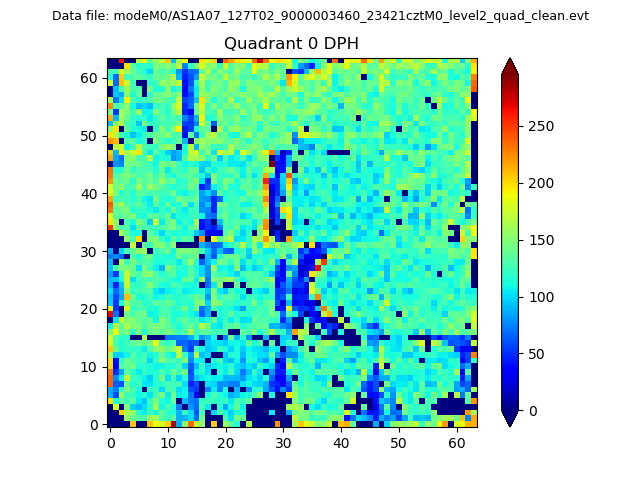 |
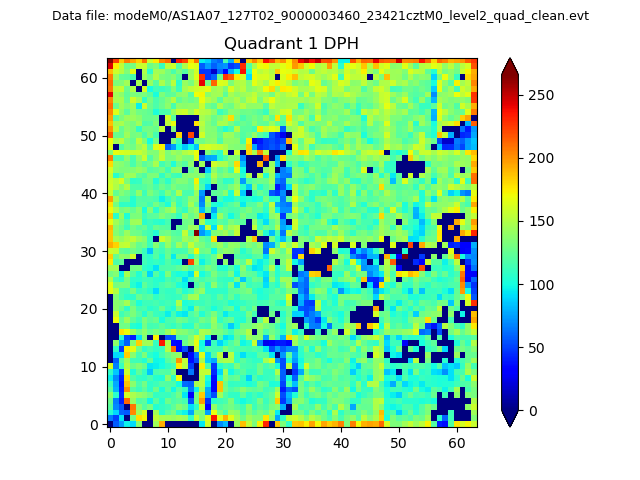 |
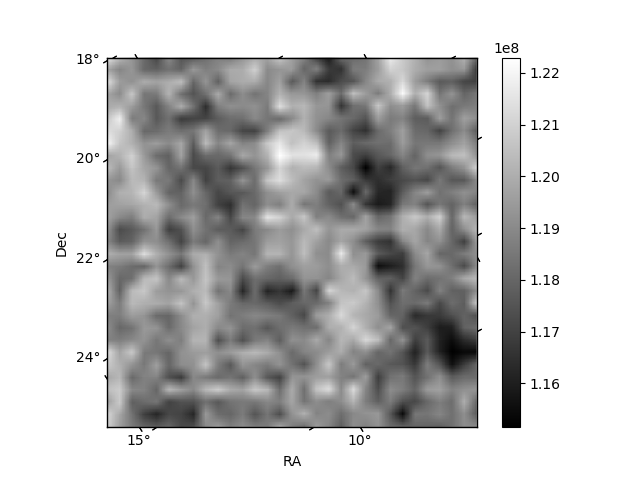
Quadrant B |
|---|---|---|---|
| Quadrant D | 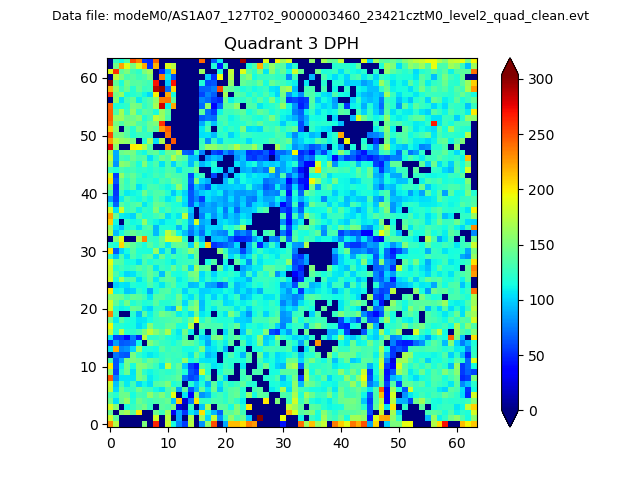 |
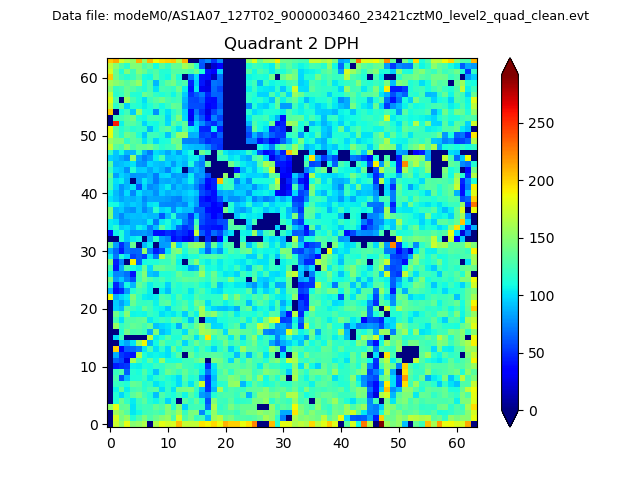 |
Quadrant C |
| Plot type | Count rate plots | Images |
|---|---|---|
| Comparison with Poisson distribution Blue bars denote a histogram of data divided into 1 sec bins. Red curve is a Poisson curve with rate = median count rate of data. |
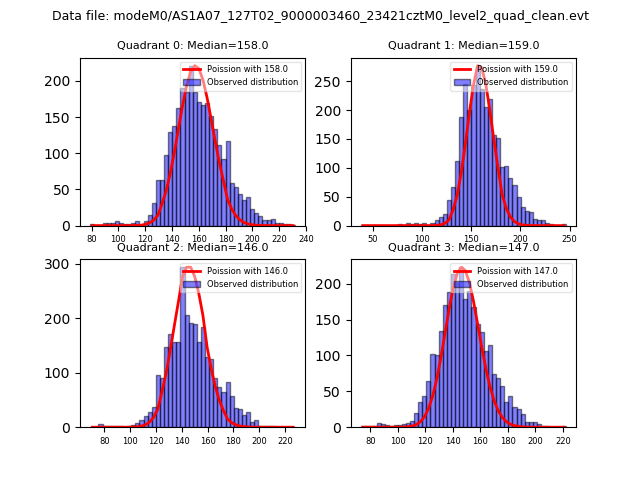 |
 |
| Quadrant-wise count rates Data is divided into 100 sec bins |
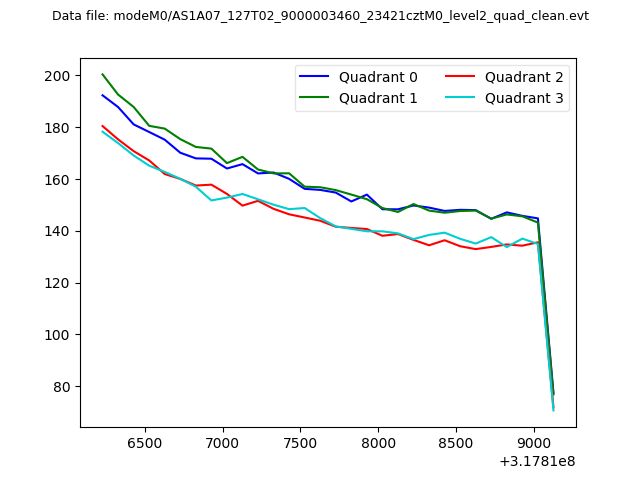 |
|
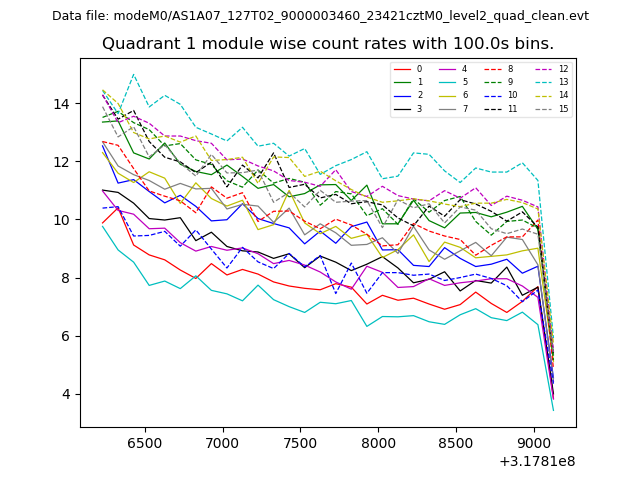
| Module-wise count rates for Quadrant A Data is divided into 100 sec bins |
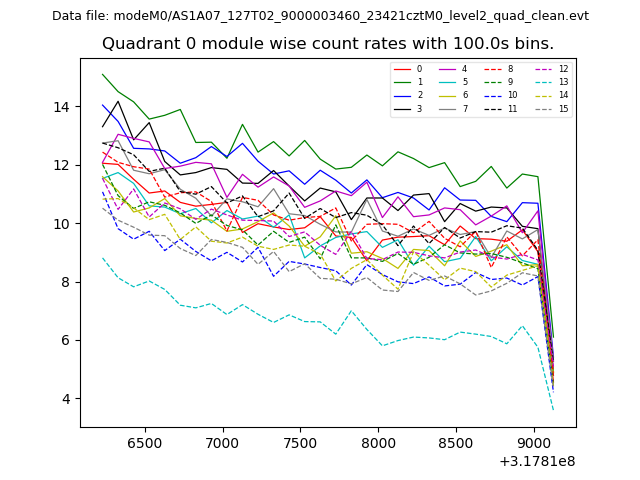 |
 |
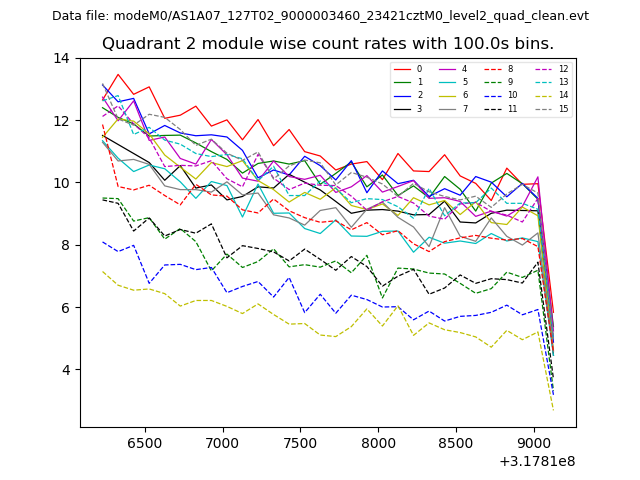
| Module-wise count rates for Quadrant B Data is divided into 100 sec bins |
 |
 |
| Module-wise count rates for Quadrant C Data is divided into 100 sec bins |
 |
 |
| Module-wise count rates for Quadrant D Data is divided into 100 sec bins |
 |
 |
| Parameter | Plot |
|---|---|
| CZT HV Monitor | 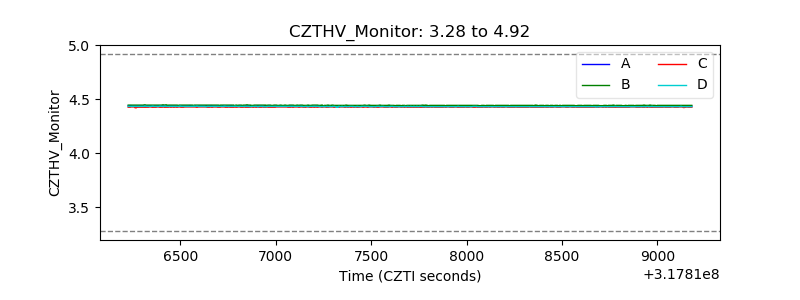 |
| D_VDD | 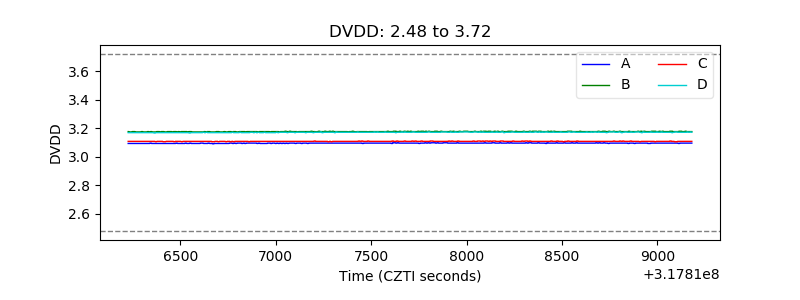 |
| Temperature 1 | 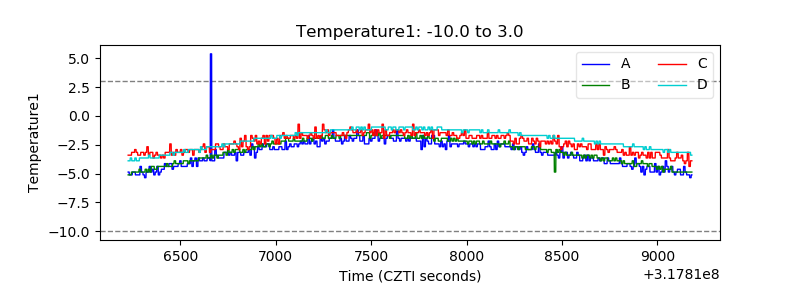 |
| Veto HV Monitor | 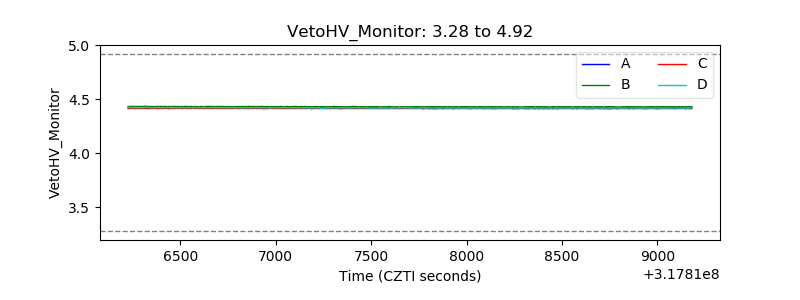 |
| Veto LLD | 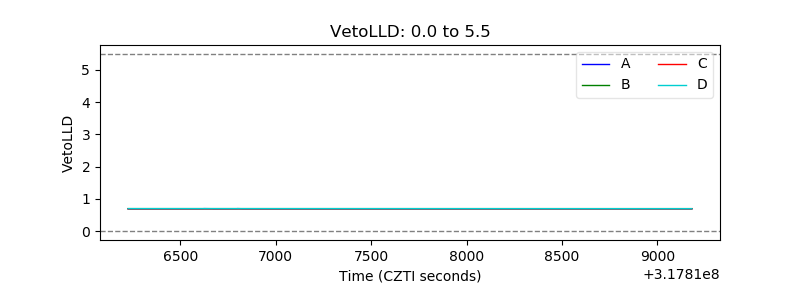 |
| Alpha Counter | 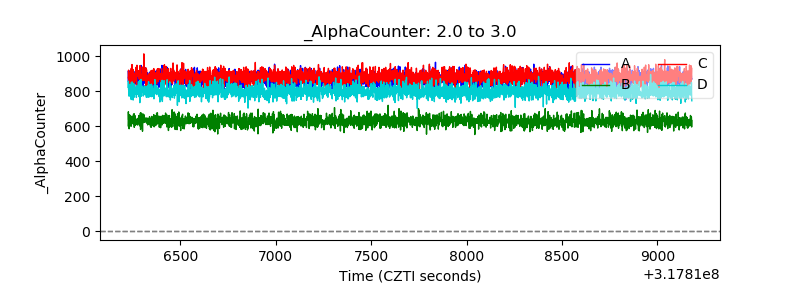 |
| _CPM_Rate | 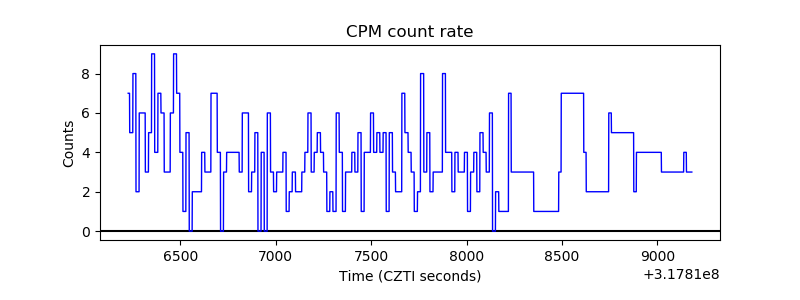 |
| CZT Counter | 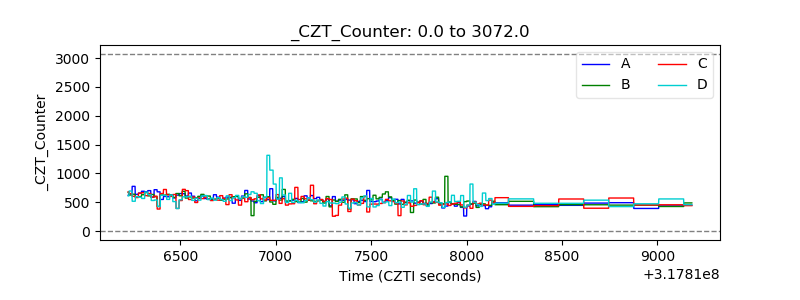 |
| +2.5 Volts monitor |  |
| +5 Volts monitor |  |
| _ROLL_ROT | 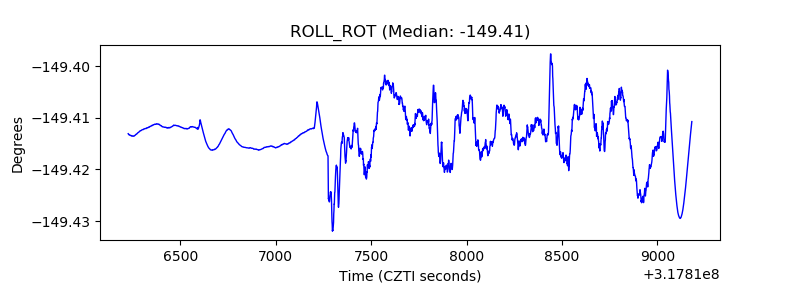 |
| _Roll_DEC | 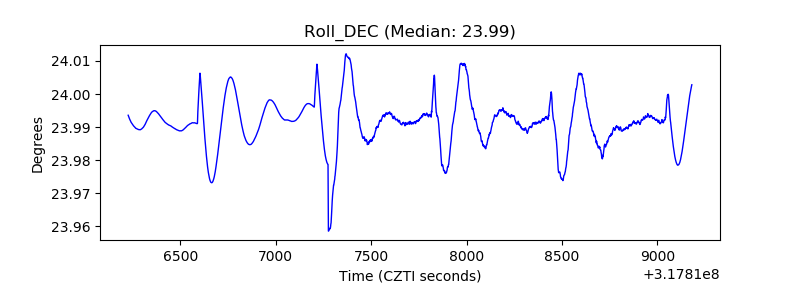 |
| _Roll_RA | 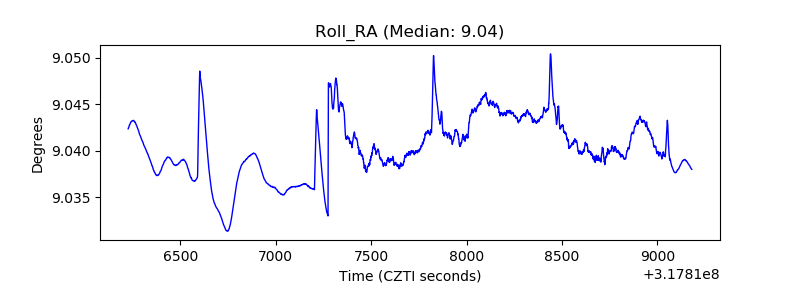 |
| Veto Counter | 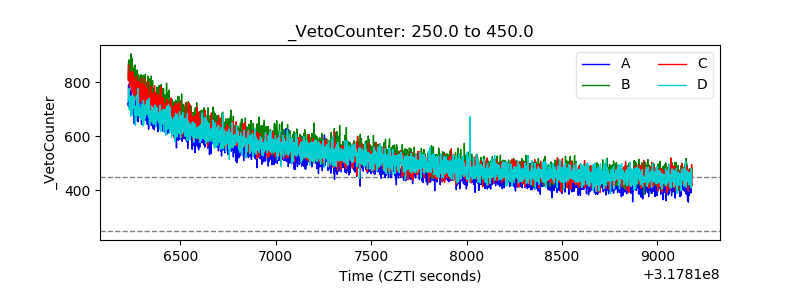 |