| Param | Original file | Final file |
|---|---|---|
| Filename | modeM0/AS1A07_138T01_9000003466cztM0_level2.fits | modeM0/AS1A07_138T01_9000003466cztM0_level2_quad_clean.evt |
| Size (bytes) | 311,788,800 | 191,188,800 |
| Size | 297.3 MB | 182.3 MB |
| Events in quadrant A | 1,960,848 | 961,607 |
| Events in quadrant B | 1,814,522 | 952,161 |
| Events in quadrant C | 1,882,740 | 913,140 |
| Events in quadrant D | 1,663,278 | 840,243 |
| Mode SS | |||
|---|---|---|---|
| Quadrant | BADHDUFLAG | Total packets | Discarded packets |
| A | 0 | 619 | 0 |
| B | 0 | 620 | 0 |
| C | 0 | 625 | 0 |
| D | 0 | 628 | 0 |
| Mode M0 | |||
|---|---|---|---|
| Quadrant | BADHDUFLAG | Total packets | Discarded packets |
| A | 0 | 64574 | 0 |
| B | 0 | 72916 | 0 |
| C | 0 | 65636 | 0 |
| D | 0 | 71298 | 0 |
| Mode M9 | |||
|---|---|---|---|
| Quadrant | BADHDUFLAG | Total packets | Discarded packets |
| A | 0 | 56 | 0 |
| B | 0 | 57 | 0 |
| C | 0 | 58 | 0 |
| D | 0 | 57 | 0 |
| Quadrant | Total seconds | Saturated seconds | Saturation percentage |
|---|---|---|---|
| A | 30885 | 321 | 1.039339% |
| B | 30764 | 1201 | 3.903914% |
| C | 30949 | 532 | 1.718957% |
| D | 30917 | 638 | 2.063590% |
Noise dominated data is calculated using 1-second bins in cleaned event files. If a bin has >2000 counts, and if more than 50% of those come from <1% of pixels, then it is considered to be noise-dominated and hence unusable.
| Quadrant | # 1 sec bins | Bins with >0 counts | Bins with >2000 counts | High rate bins dominated by noise | Noise dominated (total time) | Noise dominated (detector-on time) | Marked lightcurve |
|---|---|---|---|---|---|---|---|
| A | 31368 | 27260 | 0 | 0 | 0.00% | 0.00% | 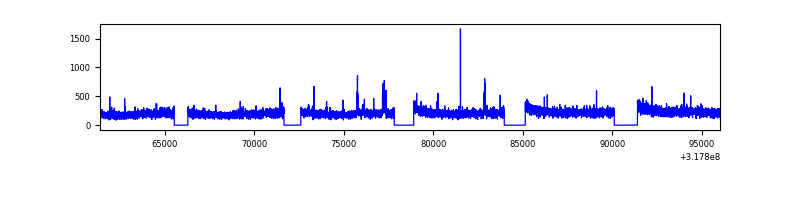 |
| B | 31368 | 27173 | 0 | 0 | 0.00% | 0.00% | 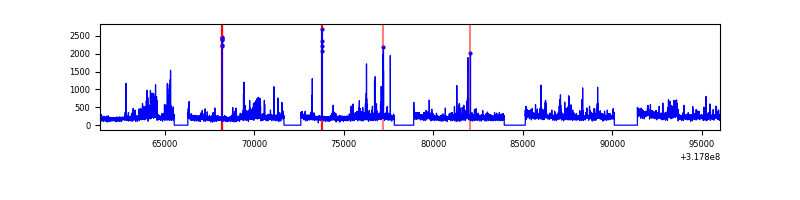 |
| C | 31368 | 27259 | 0 | 0 | 0.00% | 0.00% |  |
| D | 31368 | 27248 | 0 | 0 | 0.00% | 0.00% |  |
Top three noisy pixels from each quadrant. If the there are fewer than three noisy pixels in the level2.evt file, extra rows are filled as -1
| Pixel properties | Quadrant properties | ||||||
|---|---|---|---|---|---|---|---|
| Quadrant | DetID | PixID | Counts | Sigma | Mean | Median | Sigma |
| A | 0 | 29 | 1930 | 11.59 | 509 | 479 | 125.2 |
| A | 7 | 110 | 1591 | 8.88 | 509 | 479 | 125.2 |
| A | 0 | 30 | 1461 | 7.84 | 509 | 479 | 125.2 |
| B | 2 | 9 | 1498 | 10.76 | 480 | 458 | 96.7 |
| B | 2 | 8 | 1239 | 8.08 | 480 | 458 | 96.7 |
| B | 5 | 232 | 1197 | 7.64 | 480 | 458 | 96.7 |
| C | 12 | 241 | 1292 | 6.52 | 497 | 466 | 126.7 |
| C | 12 | 249 | 1269 | 6.34 | 497 | 466 | 126.7 |
| C | 9 | 209 | 1259 | 6.26 | 497 | 466 | 126.7 |
| D | 6 | 231 | 1211 | 6.15 | 475 | 433 | 126.5 |
| D | 3 | 14 | 1180 | 5.91 | 475 | 433 | 126.5 |
| D | 10 | 189 | 1178 | 5.89 | 475 | 433 | 126.5 |
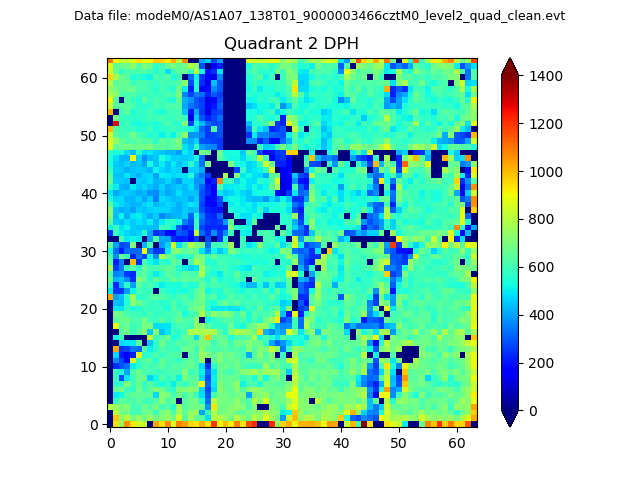
Histogram calculated using DETX and DETY for each event in the final _common_clean file
| Quadrant A | 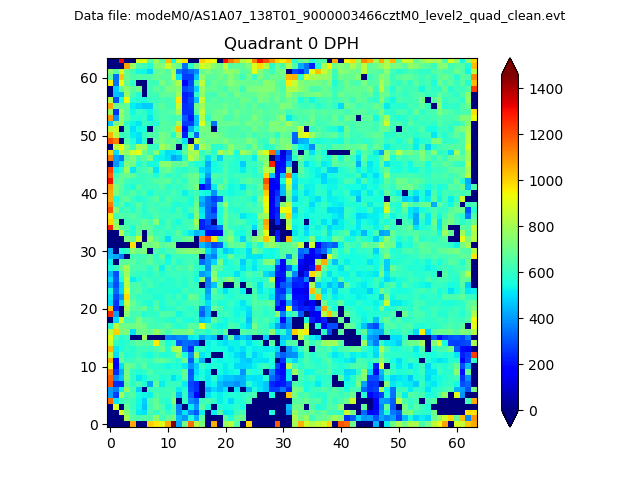 |
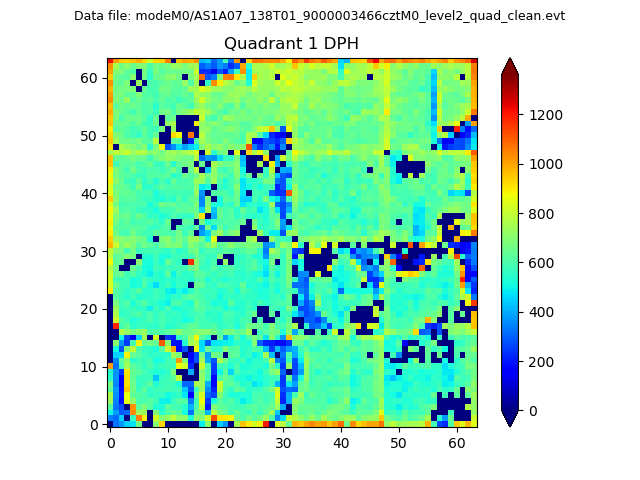 |
Quadrant B |
|---|---|---|---|
| Quadrant D |  |
 |
Quadrant C |
| Plot type | Count rate plots | Images |
|---|---|---|
| Comparison with Poisson distribution Blue bars denote a histogram of data divided into 1 sec bins. Red curve is a Poisson curve with rate = median count rate of data. |
 |
 |
| Quadrant-wise count rates Data is divided into 100 sec bins |
 |
|
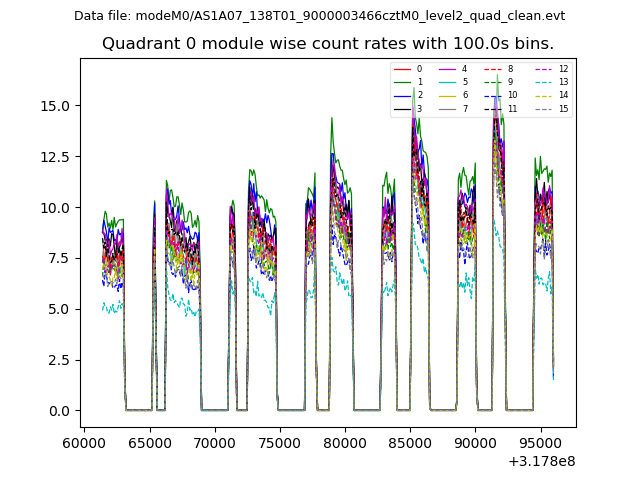
| Module-wise count rates for Quadrant A Data is divided into 100 sec bins |
 |
 |
| Module-wise count rates for Quadrant B Data is divided into 100 sec bins |
 |
 |
| Module-wise count rates for Quadrant C Data is divided into 100 sec bins |
 |
 |
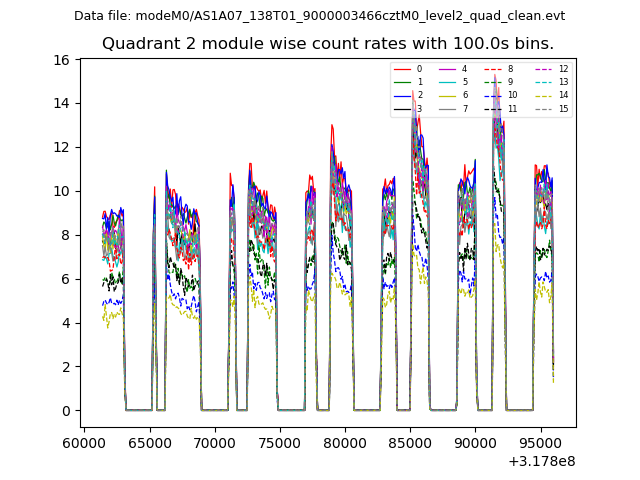
| Module-wise count rates for Quadrant D Data is divided into 100 sec bins |
 |
 |
| Parameter | Plot |
|---|---|
| CZT HV Monitor |  |
| D_VDD |  |
| Temperature 1 |  |
| Veto HV Monitor |  |
| Veto LLD |  |
| Alpha Counter | 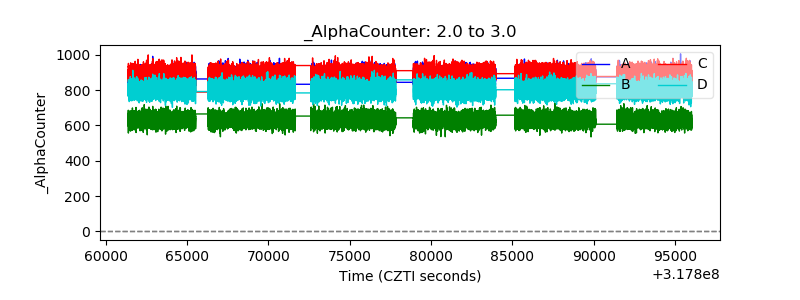 |
| _CPM_Rate |  |
| CZT Counter |  |
| +2.5 Volts monitor | 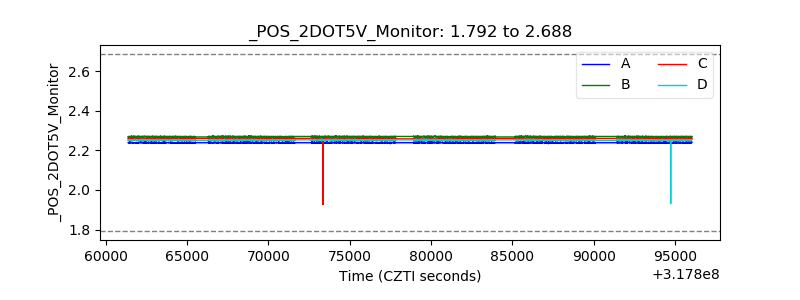 |
| +5 Volts monitor |  |
| _ROLL_ROT | 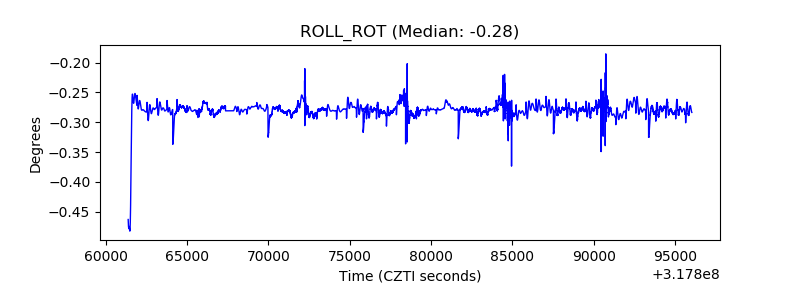 |
| _Roll_DEC | 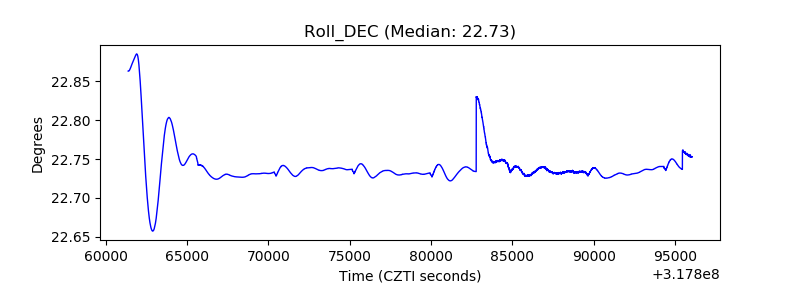 |
| _Roll_RA |  |
| Veto Counter |  |