| Param | Original file | Final file |
|---|---|---|
| Filename | modeM0/AS1A07_138T01_9000003466_23429cztM0_level2.evt | modeM0/AS1A07_138T01_9000003466_23429cztM0_level2_quad_clean.evt |
| Size (bytes) | 394,421,760 | 78,606,720 |
| Size | 376.1 MB | 75.0 MB |
| Events in quadrant A | 2,748,824 | 501,297 |
| Events in quadrant B | 3,001,587 | 507,029 |
| Events in quadrant C | 2,875,282 | 480,887 |
| Events in quadrant D | 2,914,382 | 475,666 |
| Mode SS | |||
|---|---|---|---|
| Quadrant | BADHDUFLAG | Total packets | Discarded packets |
| A | 0 | 126 | 4 |
| B | 0 | 126 | 8 |
| C | 0 | 126 | 4 |
| D | 0 | 126 | 2 |
| Mode M0 | |||
|---|---|---|---|
| Quadrant | BADHDUFLAG | Total packets | Discarded packets |
| A | 0 | 12870 | 750 |
| B | 0 | 13633 | 843 |
| C | 0 | 13072 | 807 |
| D | 0 | 13650 | 845 |
| Mode M9 | |||
|---|---|---|---|
| Quadrant | BADHDUFLAG | Total packets | Discarded packets |
| A | 0 | 10 | 0 |
| B | 0 | 10 | 0 |
| C | 0 | 10 | 0 |
| D | 0 | 10 | 1 |
| Quadrant | Total seconds | Saturated seconds | Saturation percentage |
|---|---|---|---|
| A | 5952 | 23 | 0.386425% |
| B | 5948 | 52 | 0.874243% |
| C | 5936 | 51 | 0.859164% |
| D | 5943 | 30 | 0.504796% |
Noise dominated data is calculated using 1-second bins in cleaned event files. If a bin has >2000 counts, and if more than 50% of those come from <1% of pixels, then it is considered to be noise-dominated and hence unusable.
| Quadrant | # 1 sec bins | Bins with >0 counts | Bins with >2000 counts | High rate bins dominated by noise | Noise dominated (total time) | Noise dominated (detector-on time) | Marked lightcurve |
|---|---|---|---|---|---|---|---|
| A | 7263 | 6117 | 0 | 0 | 0.00% | 0.00% | 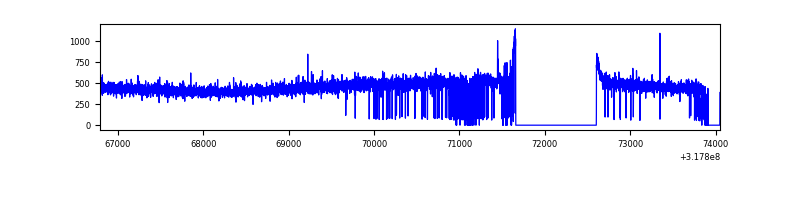 |
| B | 7263 | 6102 | 14 | 14 | 0.19% | 0.23% | 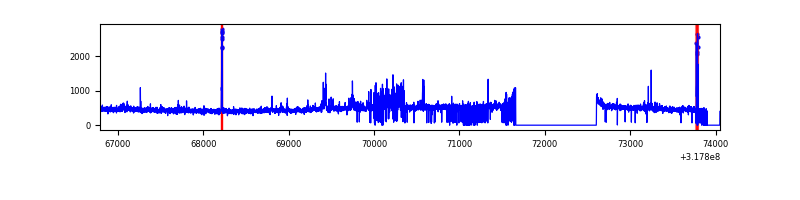 |
| C | 7183 | 6111 | 2 | 2 | 0.03% | 0.03% | 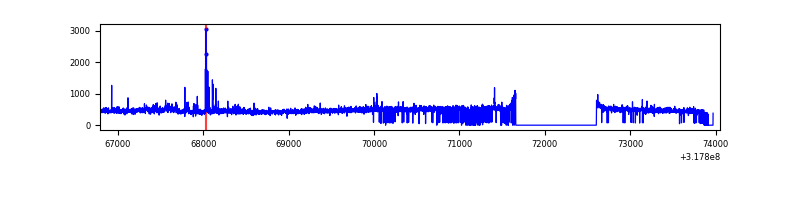 |
| D | 7126 | 6102 | 25 | 25 | 0.35% | 0.41% | 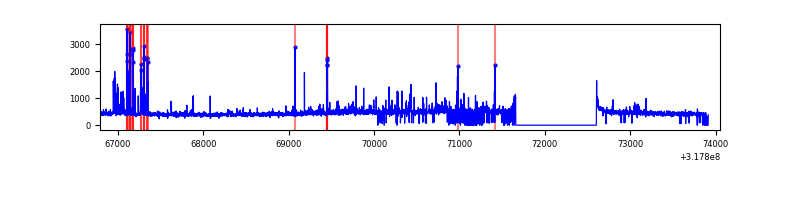 |
Top three noisy pixels from each quadrant. If the there are fewer than three noisy pixels in the level2.evt file, extra rows are filled as -1
| Pixel properties | Quadrant properties | ||||||
|---|---|---|---|---|---|---|---|
| Quadrant | DetID | PixID | Counts | Sigma | Mean | Median | Sigma |
| A | 13 | 254 | 9336 | 60.15 | 711 | 694 | 143.7 |
| A | 15 | 174 | 7105 | 44.62 | 711 | 694 | 143.7 |
| A | 3 | 137 | 6283 | 38.9 | 711 | 694 | 143.7 |
| B | 0 | 190 | 113286 | 824.23 | 708 | 689 | 136.6 |
| B | 0 | 189 | 56951 | 411.85 | 708 | 689 | 136.6 |
| B | 5 | 172 | 50293 | 363.11 | 708 | 689 | 136.6 |
| C | 14 | 238 | 108477 | 678.94 | 675 | 679 | 158.8 |
| C | 10 | 9 | 102894 | 643.78 | 675 | 679 | 158.8 |
| C | 0 | 207 | 19341 | 117.54 | 675 | 679 | 158.8 |
| D | 1 | 52 | 285133 | 1698.28 | 686 | 667 | 167.5 |
| D | 2 | 234 | 23441 | 135.96 | 686 | 667 | 167.5 |
| D | 13 | 249 | 11813 | 66.54 | 686 | 667 | 167.5 |
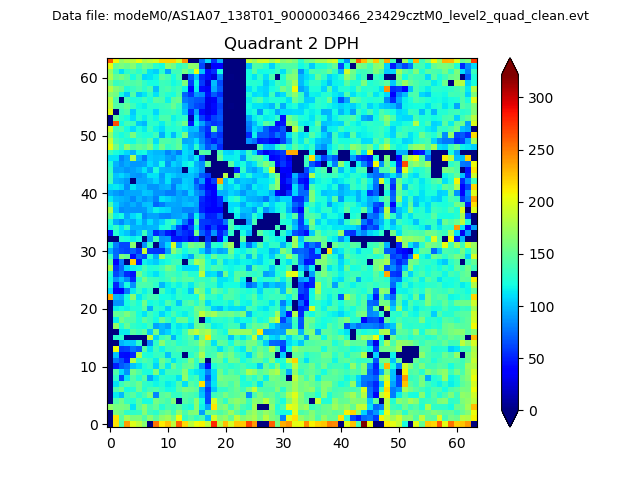
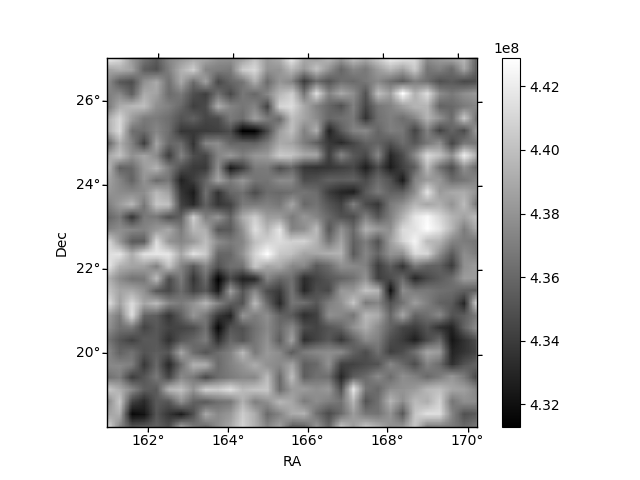
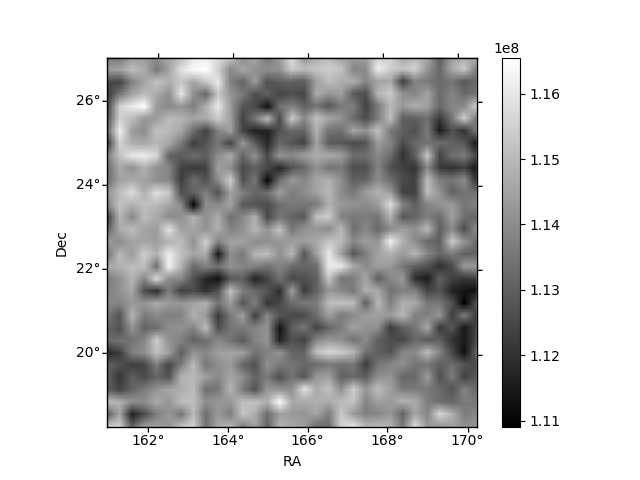
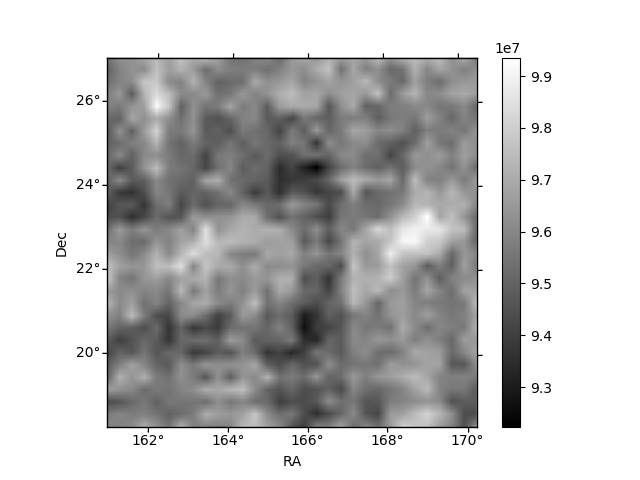
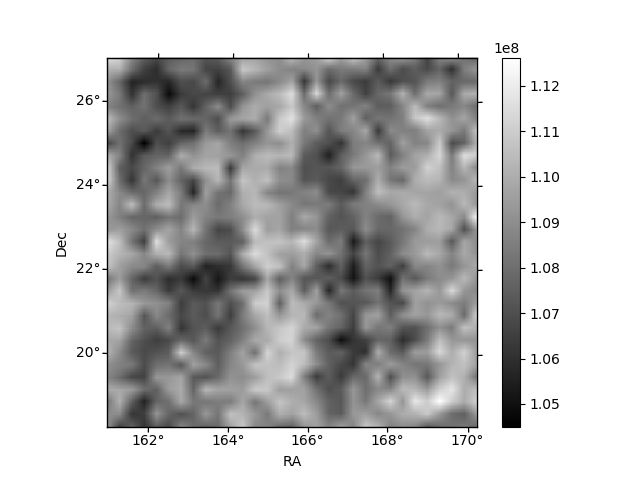
Histogram calculated using DETX and DETY for each event in the final _common_clean file
| Quadrant A | 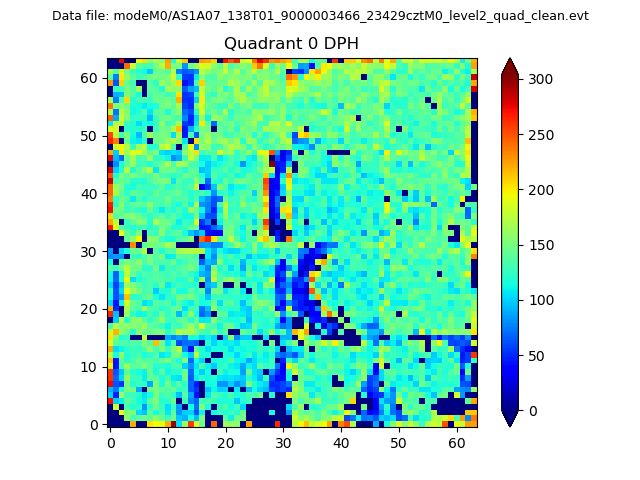 |
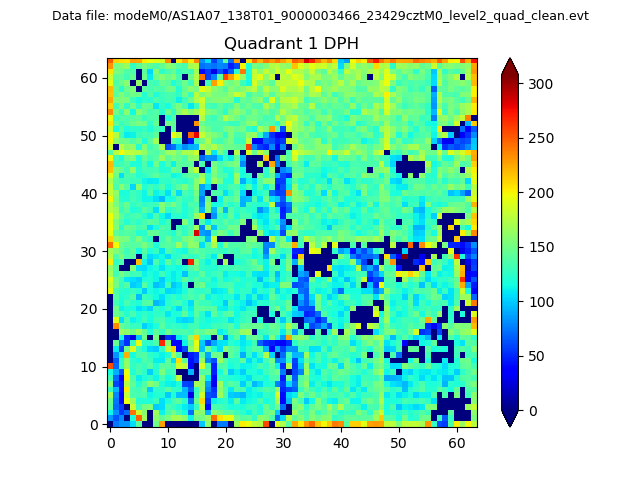 |
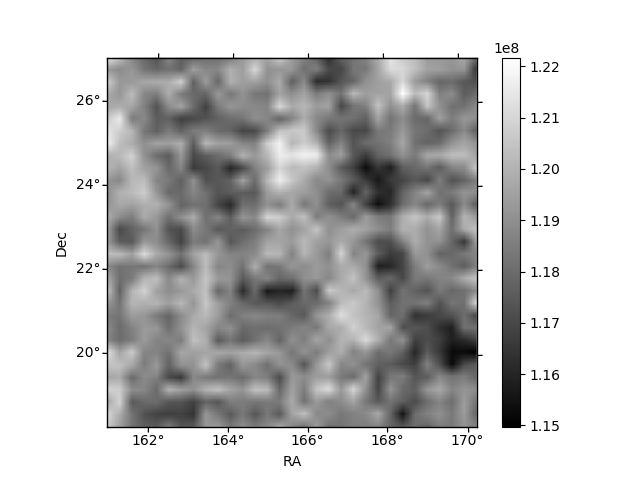
Quadrant B |
|---|---|---|---|
| Quadrant D | 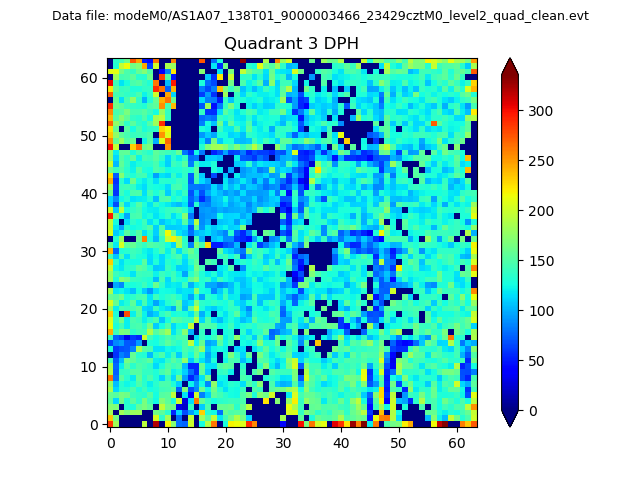 |
 |
Quadrant C |
| Plot type | Count rate plots | Images |
|---|---|---|
| Comparison with Poisson distribution Blue bars denote a histogram of data divided into 1 sec bins. Red curve is a Poisson curve with rate = median count rate of data. |
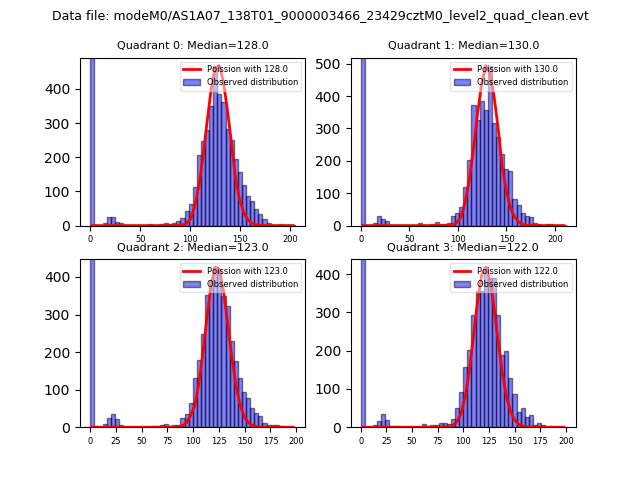 |
 |
| Quadrant-wise count rates Data is divided into 100 sec bins |
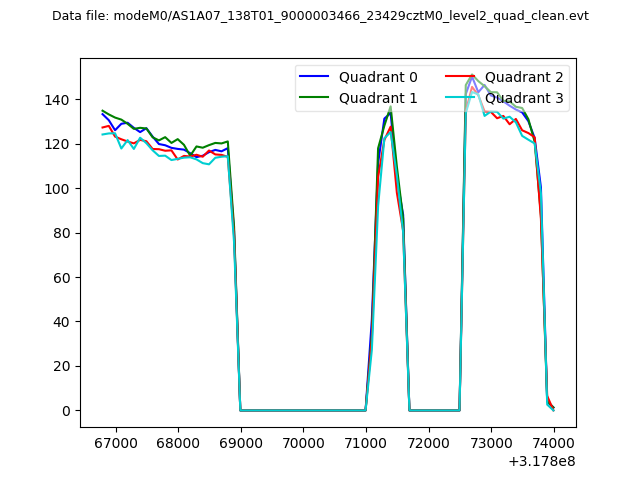 |
|
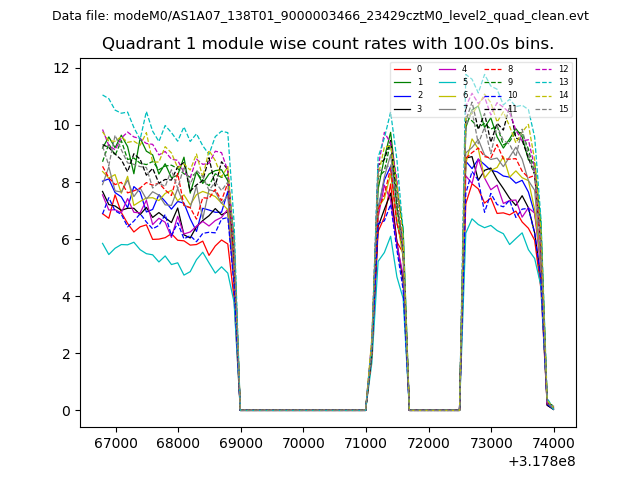
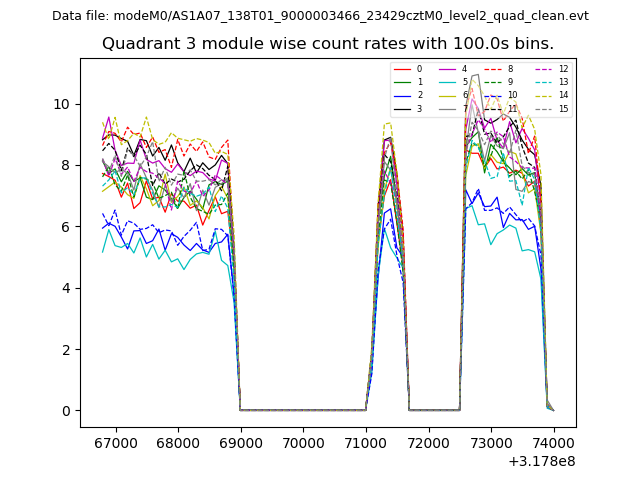
| Module-wise count rates for Quadrant A Data is divided into 100 sec bins |
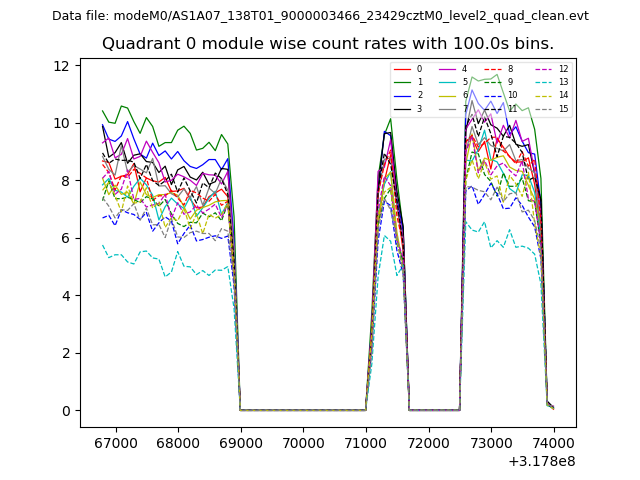 |
 |
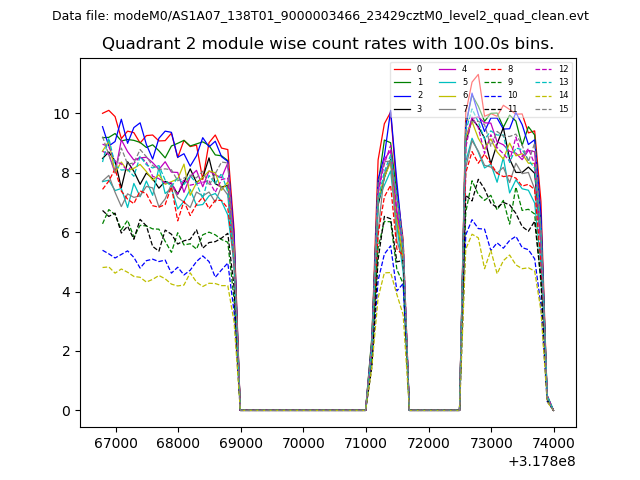
| Module-wise count rates for Quadrant B Data is divided into 100 sec bins |
 |
 |
| Module-wise count rates for Quadrant C Data is divided into 100 sec bins |
 |
 |
| Module-wise count rates for Quadrant D Data is divided into 100 sec bins |
 |
 |
| Parameter | Plot |
|---|---|
| CZT HV Monitor | 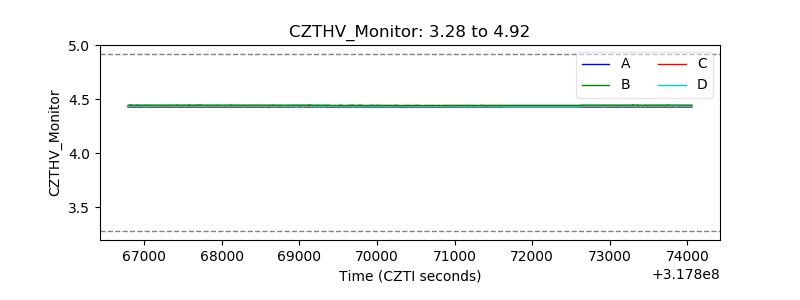 |
| D_VDD | 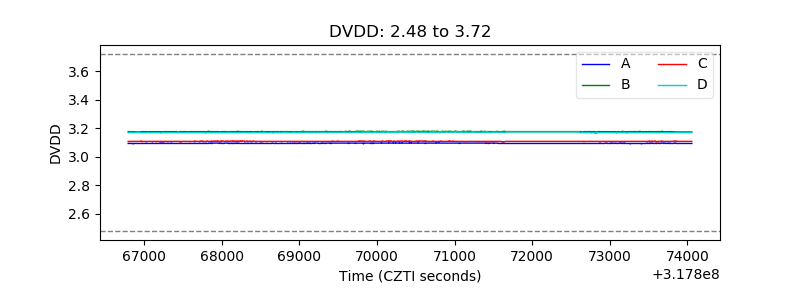 |
| Temperature 1 | 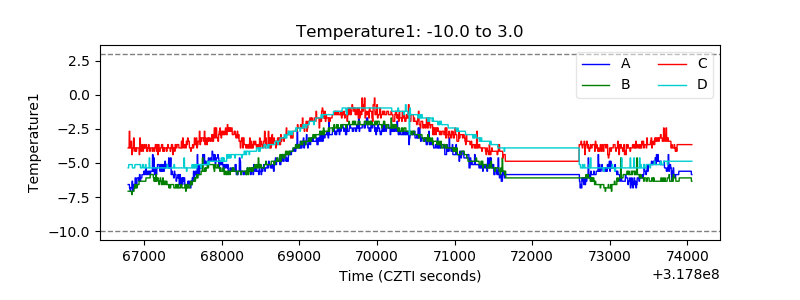 |
| Veto HV Monitor | 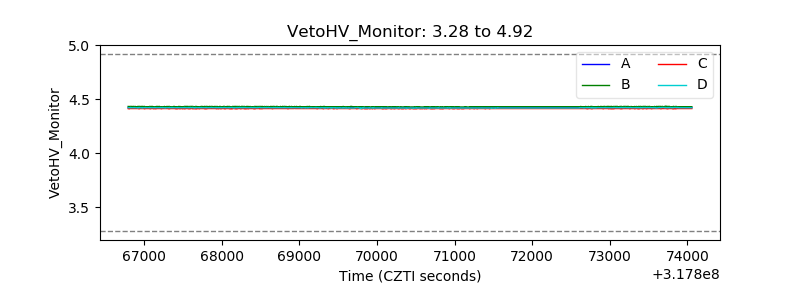 |
| Veto LLD | 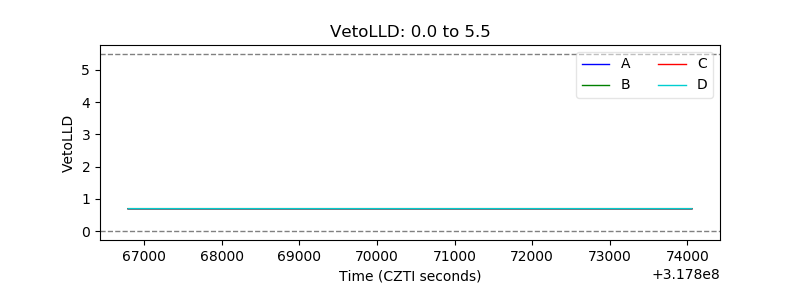 |
| Alpha Counter | 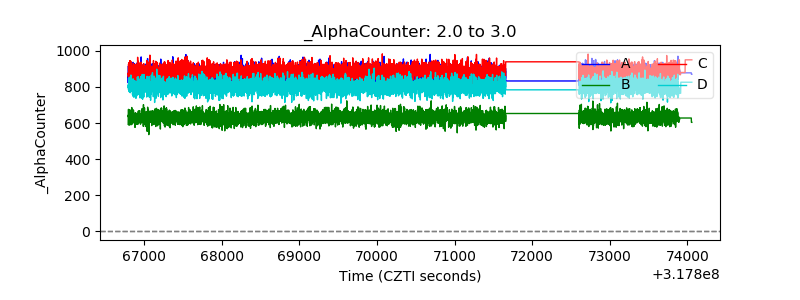 |
| _CPM_Rate | 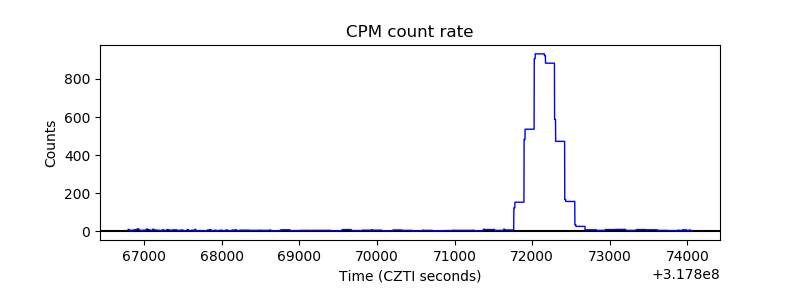 |
| CZT Counter | 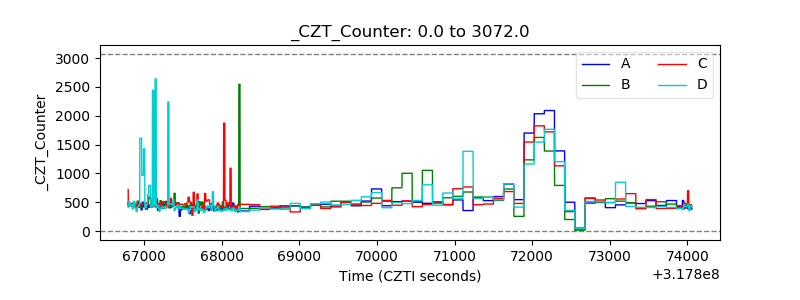 |
| +2.5 Volts monitor |  |
| +5 Volts monitor |  |
| _ROLL_ROT | 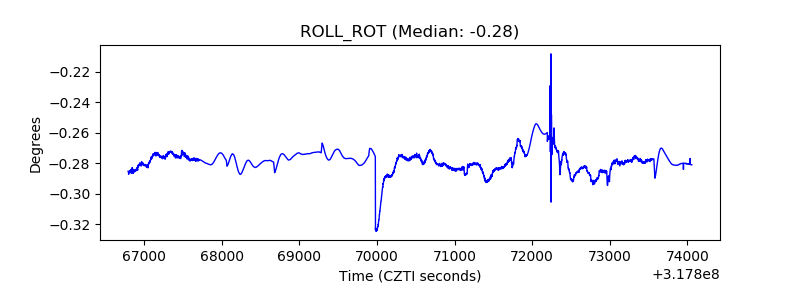 |
| _Roll_DEC | 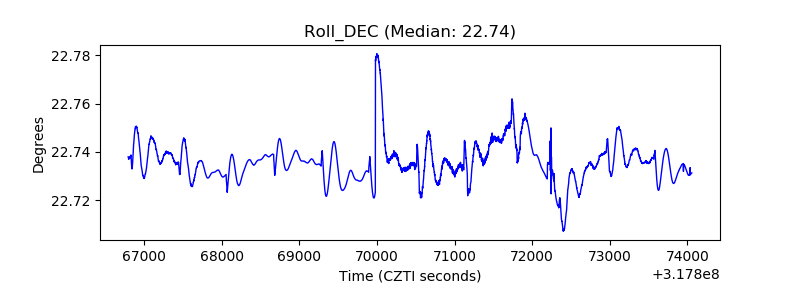 |
| _Roll_RA | 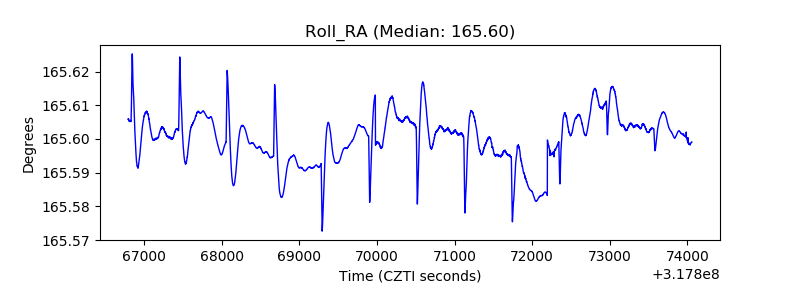 |
| Veto Counter | 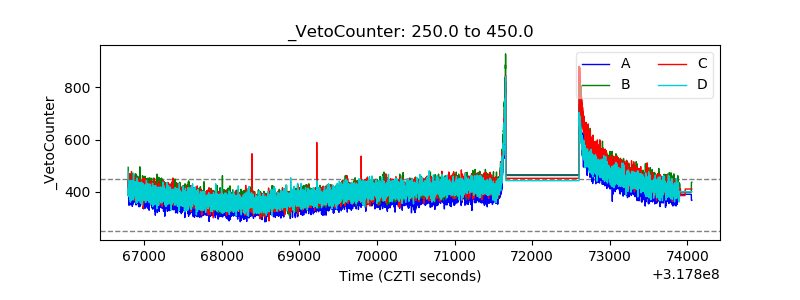 |