| Param | Original file | Final file |
|---|---|---|
| Filename | modeM0/AS1A07_138T01_9000003466_23430cztM0_level2.evt | modeM0/AS1A07_138T01_9000003466_23430cztM0_level2_quad_clean.evt |
| Size (bytes) | 1,132,608,960 | 204,661,440 |
| Size | 1.1 GB | 195.2 MB |
| Events in quadrant A | 7,768,015 | 1,289,346 |
| Events in quadrant B | 8,469,217 | 1,307,769 |
| Events in quadrant C | 8,198,223 | 1,248,038 |
| Events in quadrant D | 8,759,946 | 1,225,884 |
| Mode SS | |||
|---|---|---|---|
| Quadrant | BADHDUFLAG | Total packets | Discarded packets |
| A | 0 | 330 | 0 |
| B | 0 | 330 | 0 |
| C | 0 | 330 | 0 |
| D | 0 | 330 | 0 |
| Mode M0 | |||
|---|---|---|---|
| Quadrant | BADHDUFLAG | Total packets | Discarded packets |
| A | 0 | 33660 | 4 |
| B | 0 | 35664 | 3 |
| C | 0 | 34649 | 3 |
| D | 0 | 37162 | 3 |
| Mode M9 | |||
|---|---|---|---|
| Quadrant | BADHDUFLAG | Total packets | Discarded packets |
| A | 0 | 29 | 0 |
| B | 0 | 29 | 0 |
| C | 0 | 29 | 0 |
| D | 0 | 29 | 0 |
| Quadrant | Total seconds | Saturated seconds | Saturation percentage |
|---|---|---|---|
| A | 16358 | 93 | 0.568529% |
| B | 16358 | 224 | 1.369361% |
| C | 16358 | 260 | 1.589436% |
| D | 16358 | 290 | 1.772833% |
Noise dominated data is calculated using 1-second bins in cleaned event files. If a bin has >2000 counts, and if more than 50% of those come from <1% of pixels, then it is considered to be noise-dominated and hence unusable.
| Quadrant | # 1 sec bins | Bins with >0 counts | Bins with >2000 counts | High rate bins dominated by noise | Noise dominated (total time) | Noise dominated (detector-on time) | Marked lightcurve |
|---|---|---|---|---|---|---|---|
| A | 19148 | 16358 | 0 | 0 | 0.00% | 0.00% | 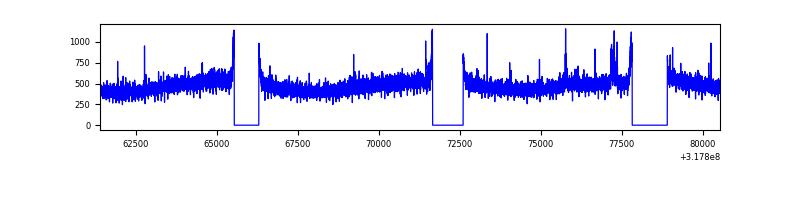 |
| B | 19148 | 16358 | 44 | 44 | 0.23% | 0.27% | 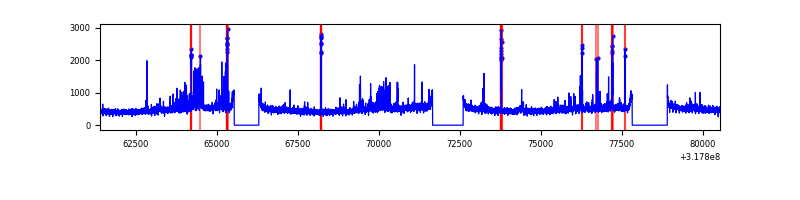 |
| C | 19148 | 16359 | 32 | 32 | 0.17% | 0.20% | 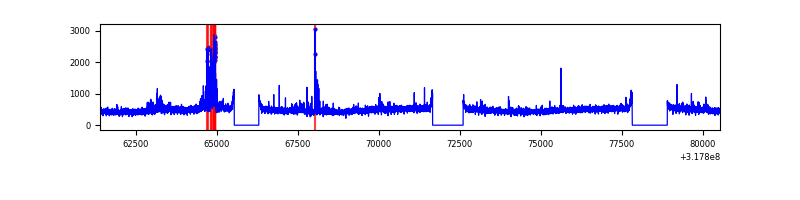 |
| D | 19148 | 16360 | 197 | 197 | 1.03% | 1.20% | 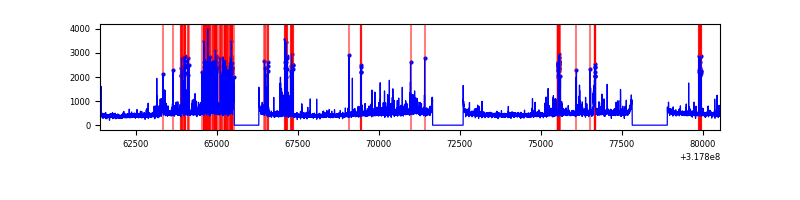 |
Top three noisy pixels from each quadrant. If the there are fewer than three noisy pixels in the level2.evt file, extra rows are filled as -1
| Pixel properties | Quadrant properties | ||||||
|---|---|---|---|---|---|---|---|
| Quadrant | DetID | PixID | Counts | Sigma | Mean | Median | Sigma |
| A | 15 | 174 | 60355 | 145.71 | 2000 | 1957 | 400.8 |
| A | 13 | 254 | 25113 | 57.78 | 2000 | 1957 | 400.8 |
| A | 3 | 137 | 17444 | 38.64 | 2000 | 1957 | 400.8 |
| B | 0 | 190 | 308060 | 817.11 | 1981 | 1934 | 374.6 |
| B | 0 | 189 | 249501 | 660.8 | 1981 | 1934 | 374.6 |
| B | 5 | 172 | 72638 | 188.72 | 1981 | 1934 | 374.6 |
| C | 10 | 9 | 433946 | 974.58 | 1899 | 1907 | 443.3 |
| C | 14 | 238 | 302499 | 678.06 | 1899 | 1907 | 443.3 |
| C | 7 | 247 | 32878 | 69.86 | 1899 | 1907 | 443.3 |
| D | 1 | 52 | 1170633 | 2494.57 | 1929 | 1877 | 468.5 |
| D | 12 | 233 | 97357 | 203.79 | 1929 | 1877 | 468.5 |
| D | 13 | 104 | 70202 | 145.83 | 1929 | 1877 | 468.5 |
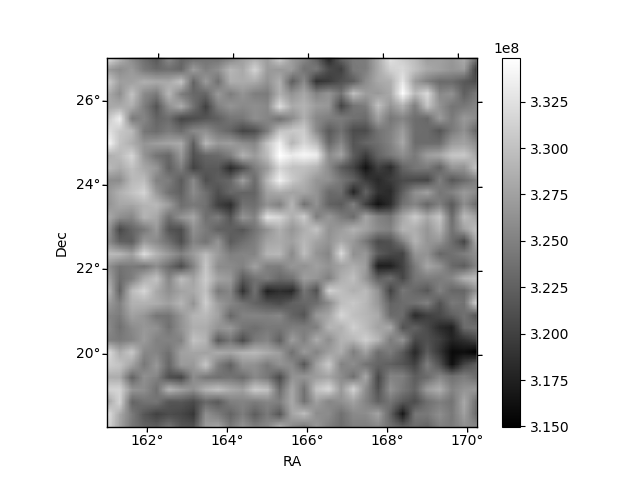
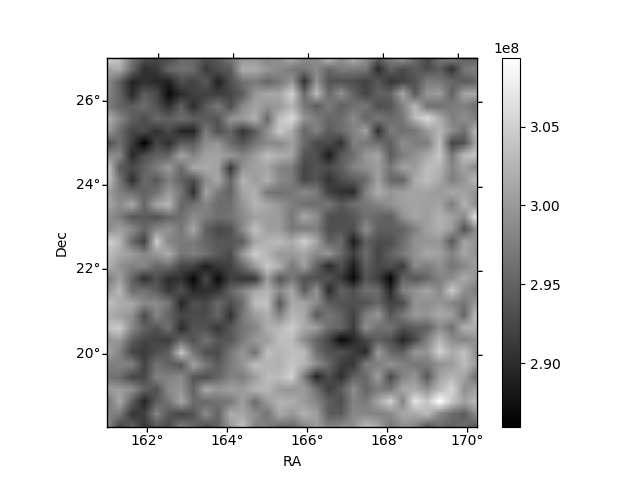
Histogram calculated using DETX and DETY for each event in the final _common_clean file
| Quadrant A | 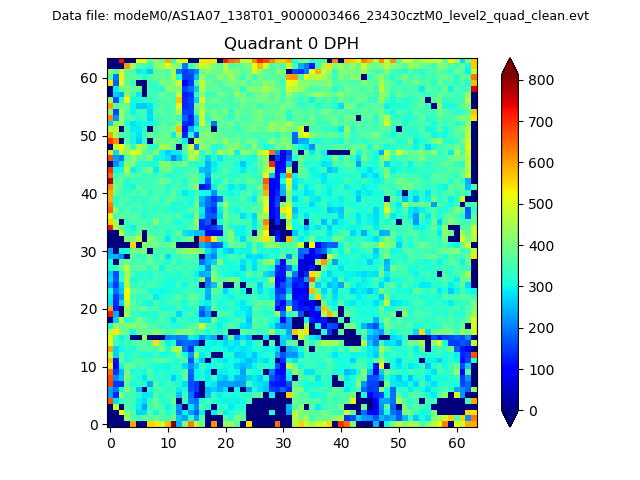 |
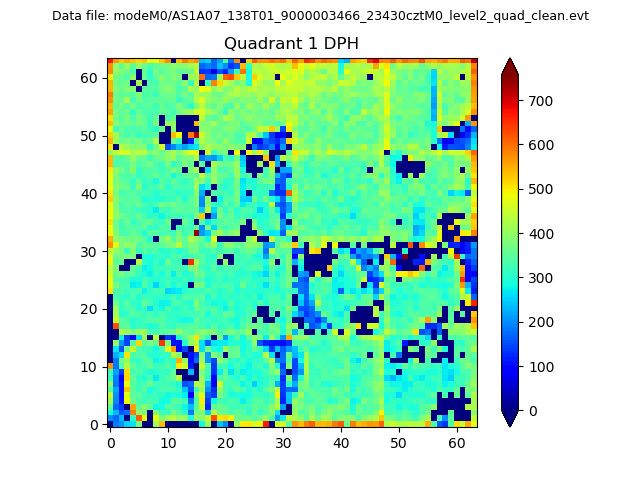 |
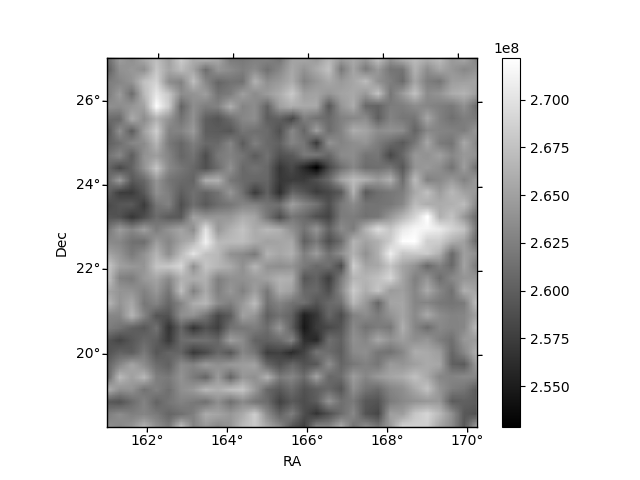
Quadrant B |
|---|---|---|---|
| Quadrant D | 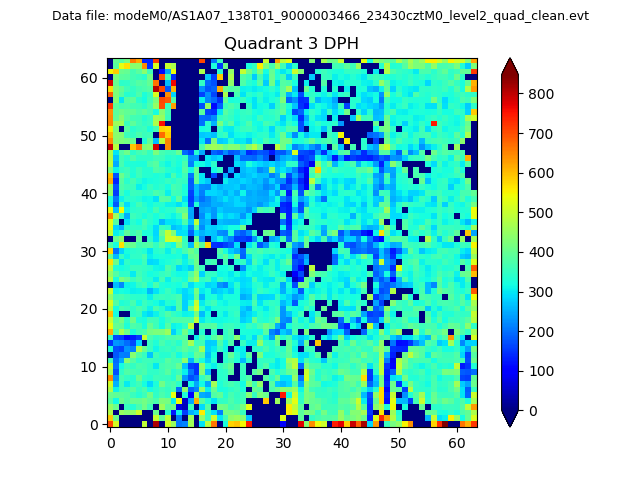 |
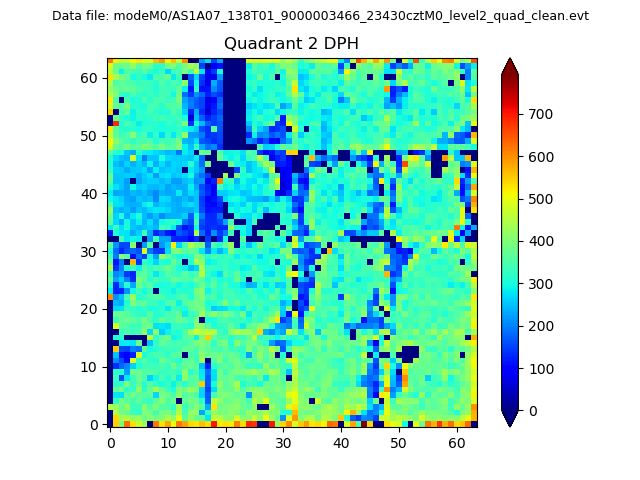 |
Quadrant C |
| Plot type | Count rate plots | Images |
|---|---|---|
| Comparison with Poisson distribution Blue bars denote a histogram of data divided into 1 sec bins. Red curve is a Poisson curve with rate = median count rate of data. |
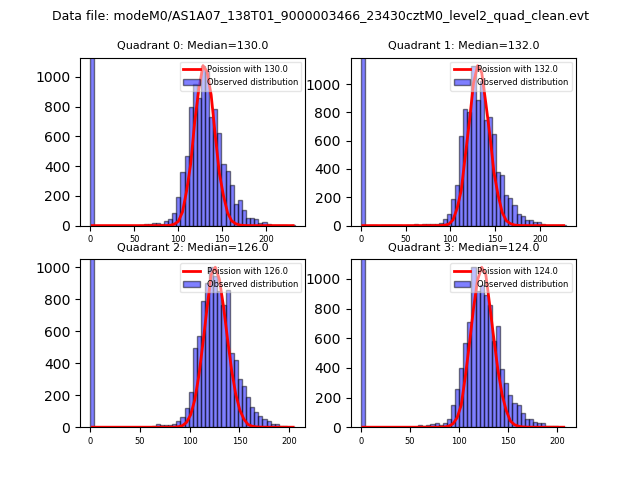 |
 |
| Quadrant-wise count rates Data is divided into 100 sec bins |
 |
|
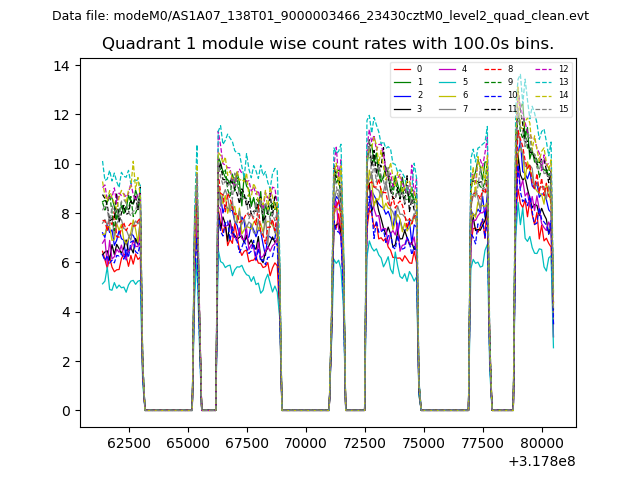
| Module-wise count rates for Quadrant A Data is divided into 100 sec bins |
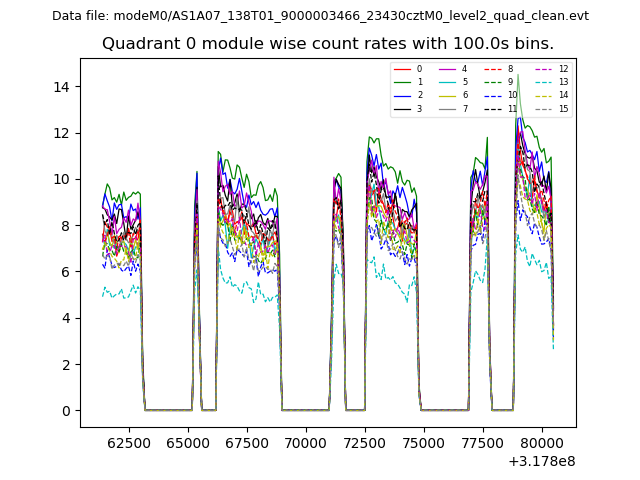 |
 |
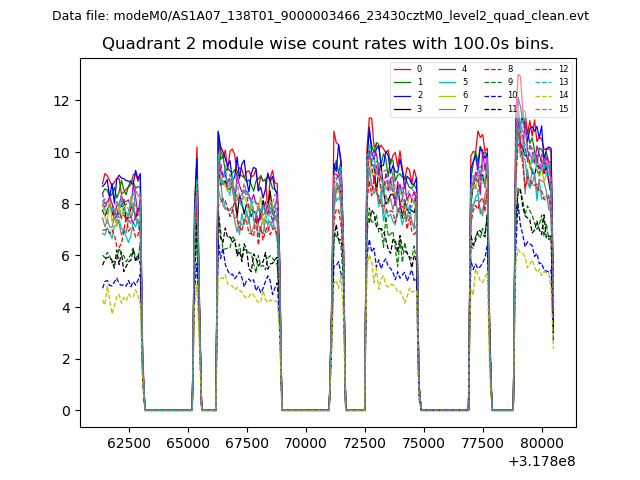
| Module-wise count rates for Quadrant B Data is divided into 100 sec bins |
 |
 |
| Module-wise count rates for Quadrant C Data is divided into 100 sec bins |
 |
 |
| Module-wise count rates for Quadrant D Data is divided into 100 sec bins |
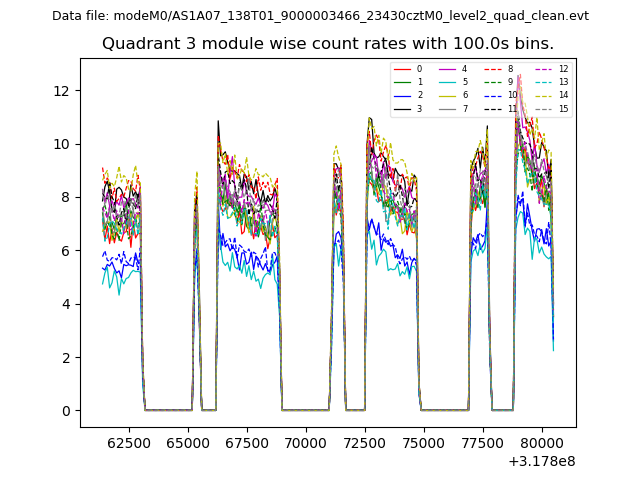 |
 |
| Parameter | Plot |
|---|---|
| CZT HV Monitor | 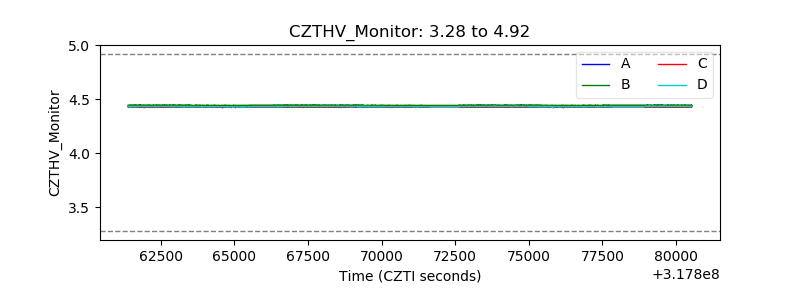 |
| D_VDD | 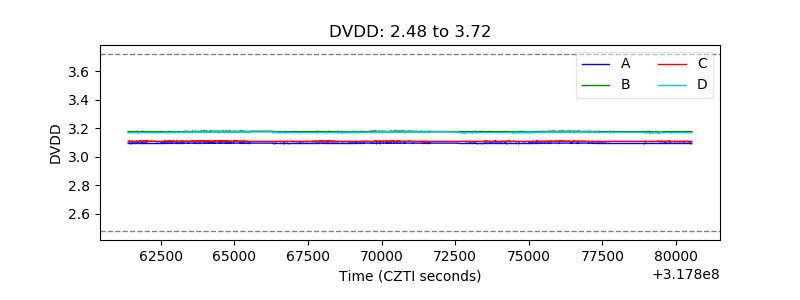 |
| Temperature 1 | 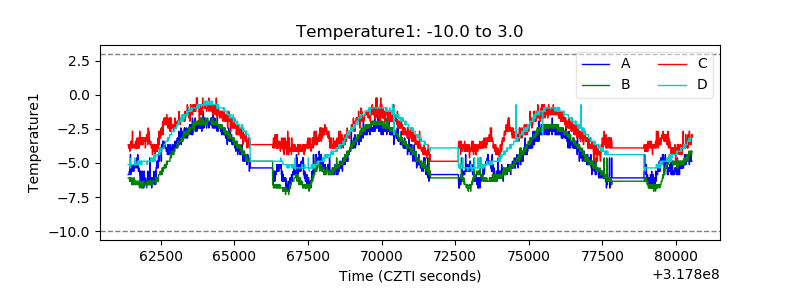 |
| Veto HV Monitor | 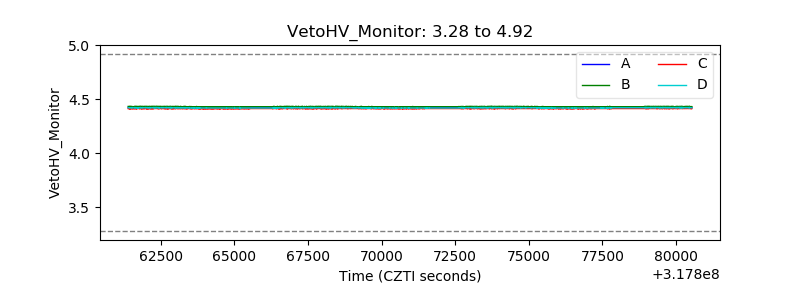 |
| Veto LLD | 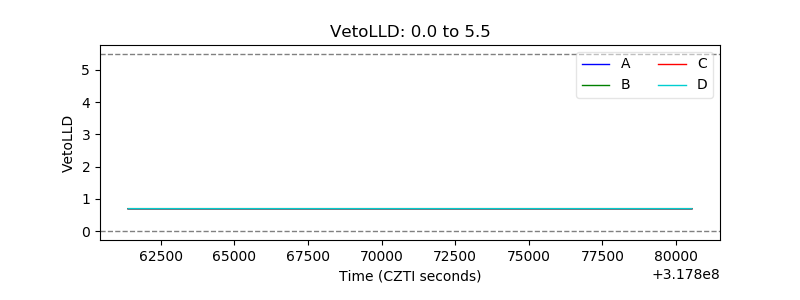 |
| Alpha Counter |  |
| _CPM_Rate |  |
| CZT Counter | 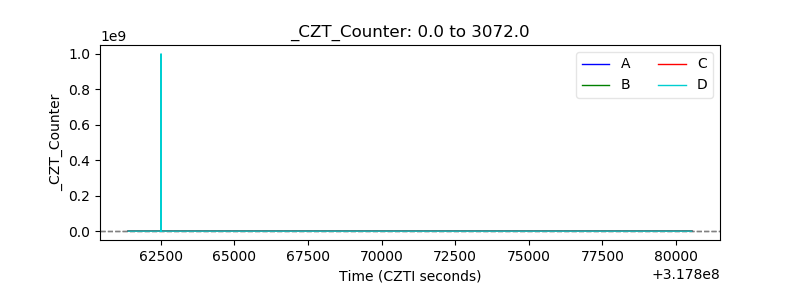 |
| +2.5 Volts monitor |  |
| +5 Volts monitor |  |
| _ROLL_ROT | 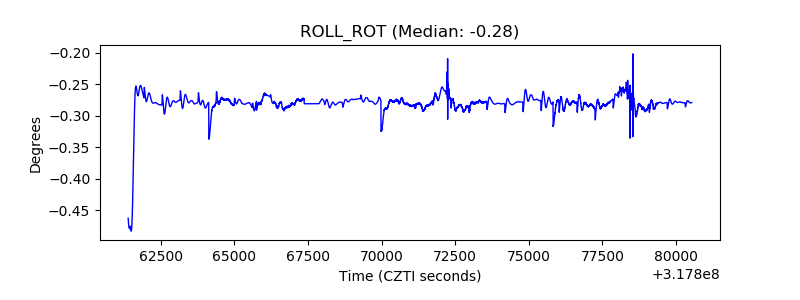 |
| _Roll_DEC | 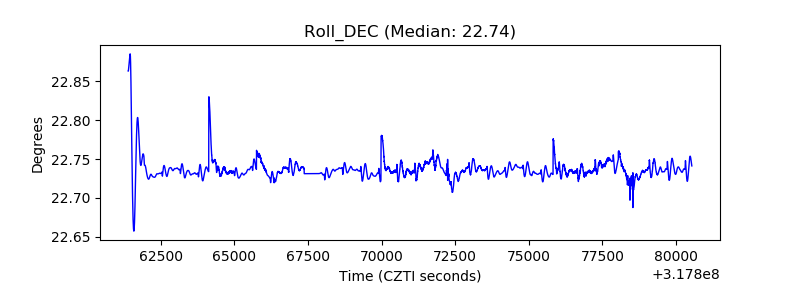 |
| _Roll_RA | 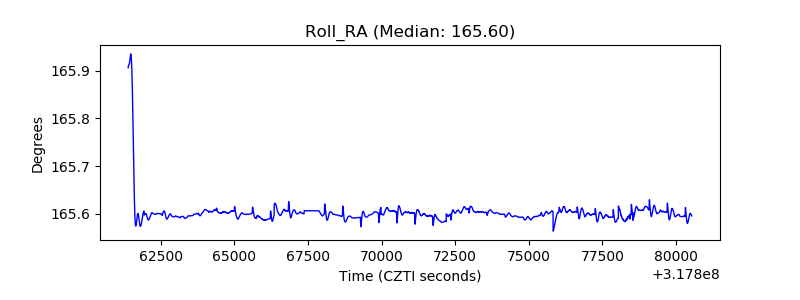 |
| Veto Counter | 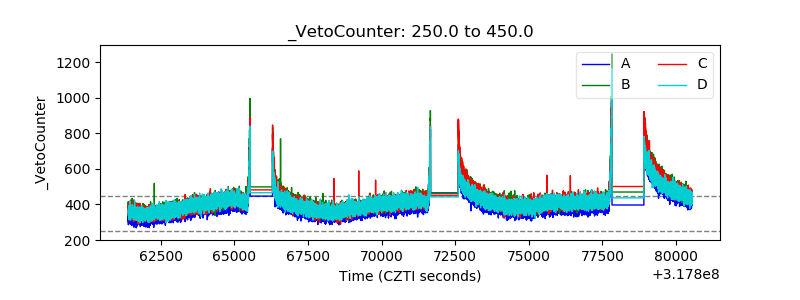 |