| Param | Original file | Final file |
|---|---|---|
| Filename | modeM0/AS1A07_138T01_9000003466_23433cztM0_level2.evt | modeM0/AS1A07_138T01_9000003466_23433cztM0_level2_quad_clean.evt |
| Size (bytes) | 495,665,280 | 95,414,400 |
| Size | 472.7 MB | 91.0 MB |
| Events in quadrant A | 3,438,760 | 628,671 |
| Events in quadrant B | 3,564,945 | 632,215 |
| Events in quadrant C | 3,434,612 | 600,803 |
| Events in quadrant D | 4,144,153 | 586,590 |
| Mode SS | |||
|---|---|---|---|
| Quadrant | BADHDUFLAG | Total packets | Discarded packets |
| A | 0 | 128 | 0 |
| B | 0 | 128 | 0 |
| C | 0 | 128 | 0 |
| D | 0 | 128 | 0 |
| Mode M0 | |||
|---|---|---|---|
| Quadrant | BADHDUFLAG | Total packets | Discarded packets |
| A | 0 | 13989 | 2 |
| B | 0 | 14445 | 2 |
| C | 0 | 13939 | 2 |
| D | 0 | 16192 | 2 |
| Mode M9 | |||
|---|---|---|---|
| Quadrant | BADHDUFLAG | Total packets | Discarded packets |
| A | 0 | 17 | 0 |
| B | 0 | 18 | 0 |
| C | 0 | 18 | 0 |
| D | 0 | 18 | 0 |
| Quadrant | Total seconds | Saturated seconds | Saturation percentage |
|---|---|---|---|
| A | 6323 | 78 | 1.233592% |
| B | 6323 | 83 | 1.312668% |
| C | 6323 | 89 | 1.407560% |
| D | 6323 | 181 | 2.862565% |
Noise dominated data is calculated using 1-second bins in cleaned event files. If a bin has >2000 counts, and if more than 50% of those come from <1% of pixels, then it is considered to be noise-dominated and hence unusable.
| Quadrant | # 1 sec bins | Bins with >0 counts | Bins with >2000 counts | High rate bins dominated by noise | Noise dominated (total time) | Noise dominated (detector-on time) | Marked lightcurve |
|---|---|---|---|---|---|---|---|
| A | 7618 | 6323 | 0 | 0 | 0.00% | 0.00% | 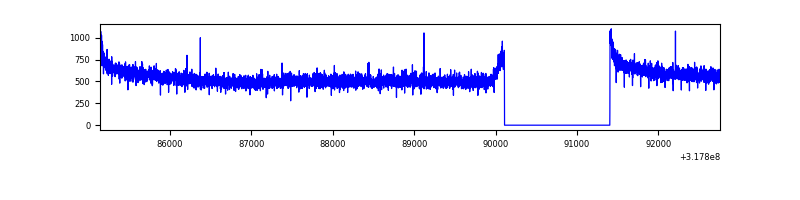 |
| B | 7618 | 6323 | 2 | 2 | 0.03% | 0.03% | 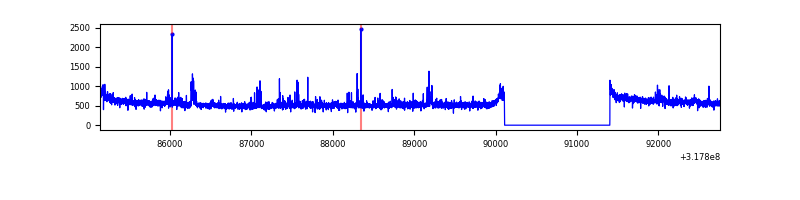 |
| C | 7618 | 6323 | 0 | 0 | 0.00% | 0.00% | 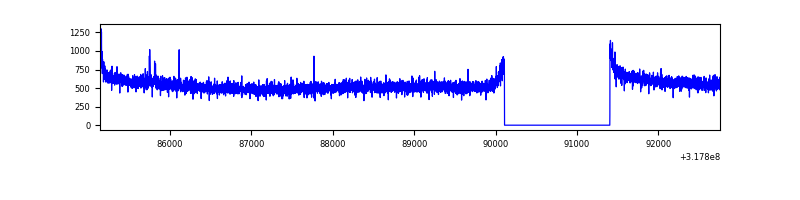 |
| D | 7618 | 6323 | 133 | 133 | 1.75% | 2.10% | 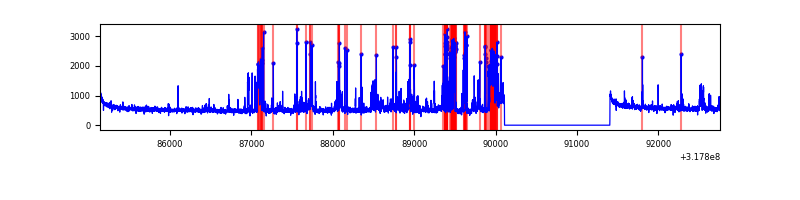 |
Top three noisy pixels from each quadrant. If the there are fewer than three noisy pixels in the level2.evt file, extra rows are filled as -1
| Pixel properties | Quadrant properties | ||||||
|---|---|---|---|---|---|---|---|
| Quadrant | DetID | PixID | Counts | Sigma | Mean | Median | Sigma |
| A | 13 | 254 | 9950 | 50.9 | 892 | 876 | 178.3 |
| A | 0 | 226 | 7854 | 39.14 | 892 | 876 | 178.3 |
| A | 3 | 137 | 7080 | 34.8 | 892 | 876 | 178.3 |
| B | 0 | 189 | 92109 | 562.21 | 870 | 852 | 162.3 |
| B | 0 | 229 | 43765 | 264.37 | 870 | 852 | 162.3 |
| B | 12 | 111 | 18772 | 110.4 | 870 | 852 | 162.3 |
| C | 14 | 238 | 136842 | 708.01 | 839 | 848 | 192.1 |
| C | 7 | 247 | 17254 | 85.41 | 839 | 848 | 192.1 |
| C | 13 | 61 | 5777 | 25.66 | 839 | 848 | 192.1 |
| D | 1 | 52 | 847132 | 4138.06 | 856 | 834 | 204.5 |
| D | 2 | 234 | 26653 | 126.24 | 856 | 834 | 204.5 |
| D | 9 | 85 | 15412 | 71.28 | 856 | 834 | 204.5 |
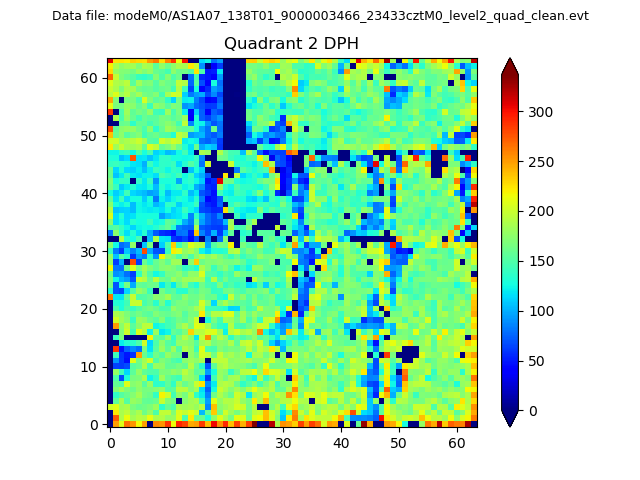
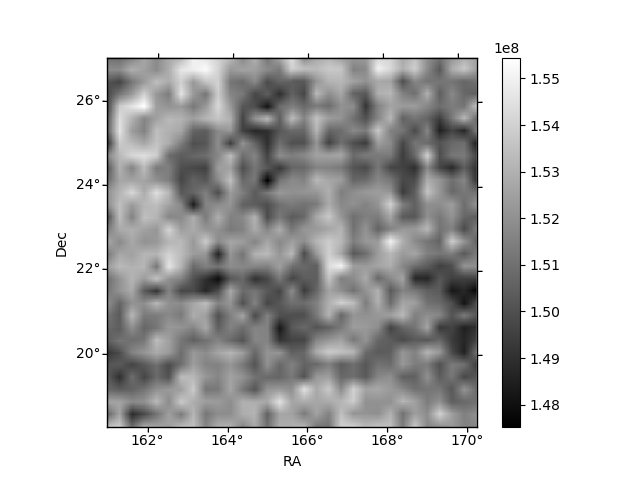
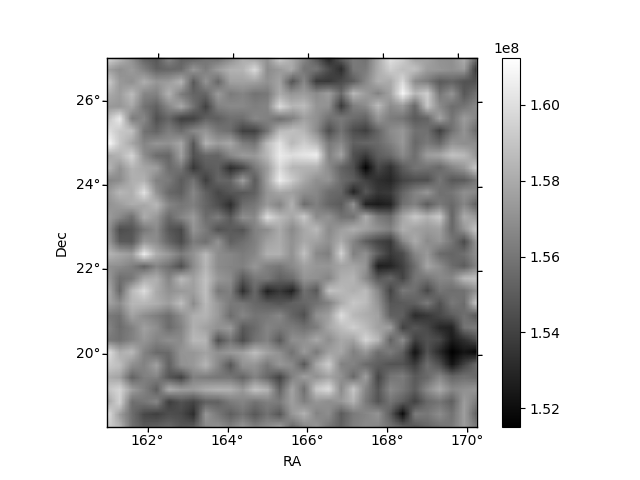
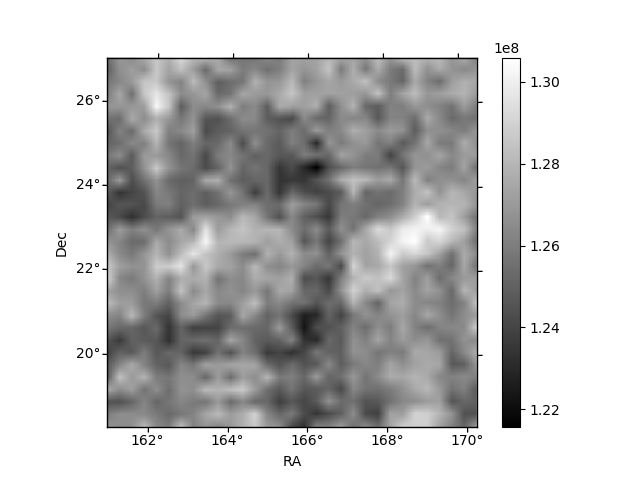
Histogram calculated using DETX and DETY for each event in the final _common_clean file
| Quadrant A | 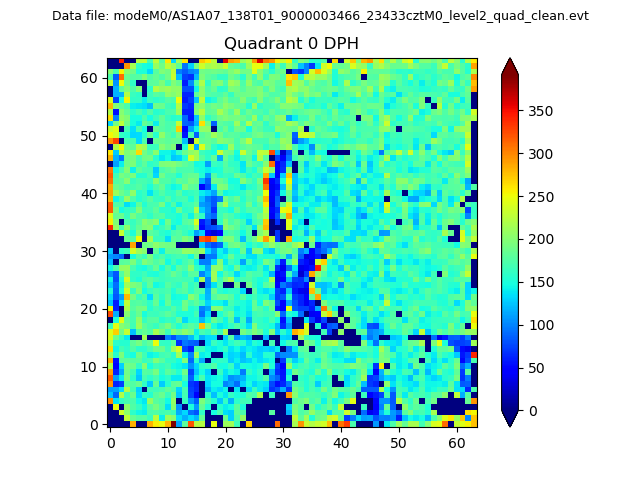 |
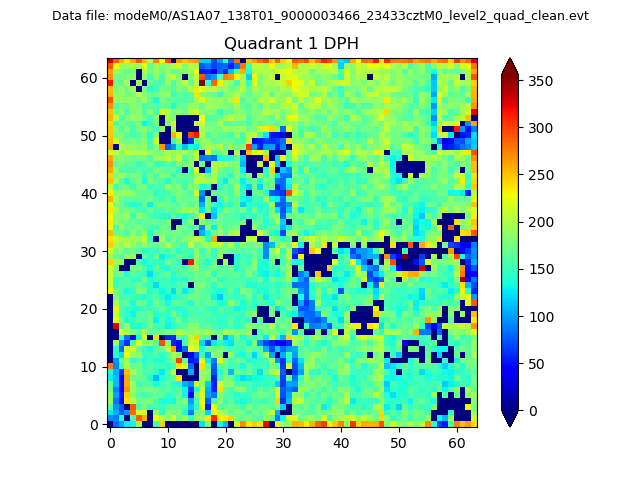 |
Quadrant B |
|---|---|---|---|
| Quadrant D | 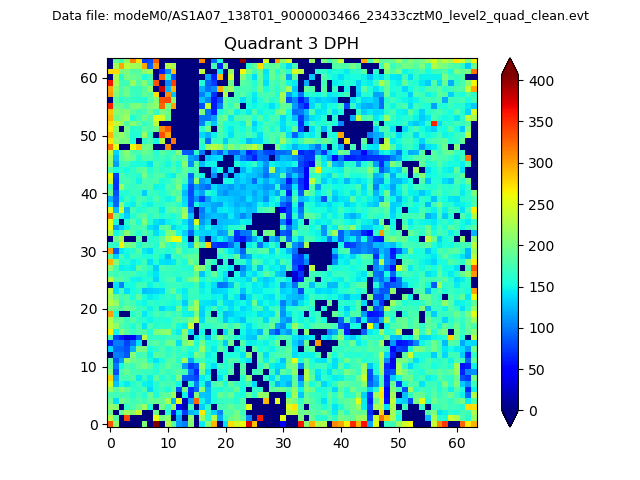 |
 |
Quadrant C |
| Plot type | Count rate plots | Images |
|---|---|---|
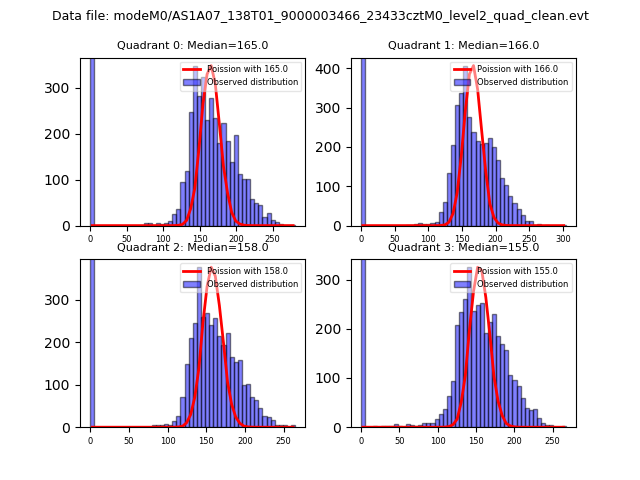
| Comparison with Poisson distribution Blue bars denote a histogram of data divided into 1 sec bins. Red curve is a Poisson curve with rate = median count rate of data. |
 |
 |
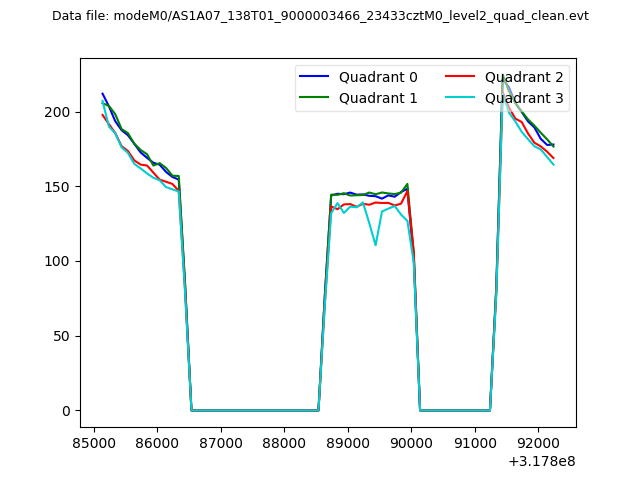
| Quadrant-wise count rates Data is divided into 100 sec bins |
 |
|
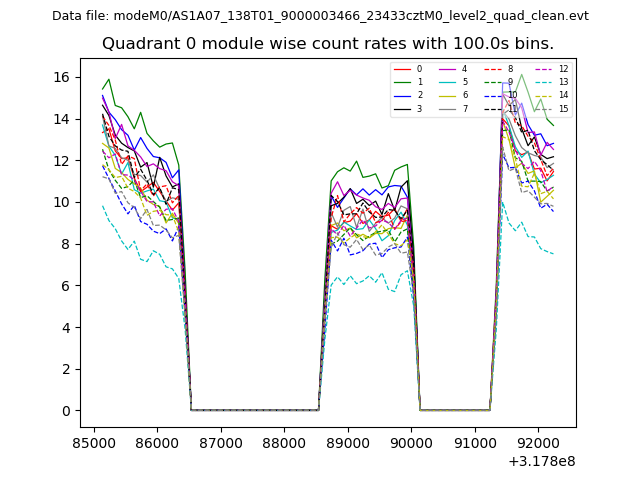
| Module-wise count rates for Quadrant A Data is divided into 100 sec bins |
 |
 |
| Module-wise count rates for Quadrant B Data is divided into 100 sec bins |
 |
 |
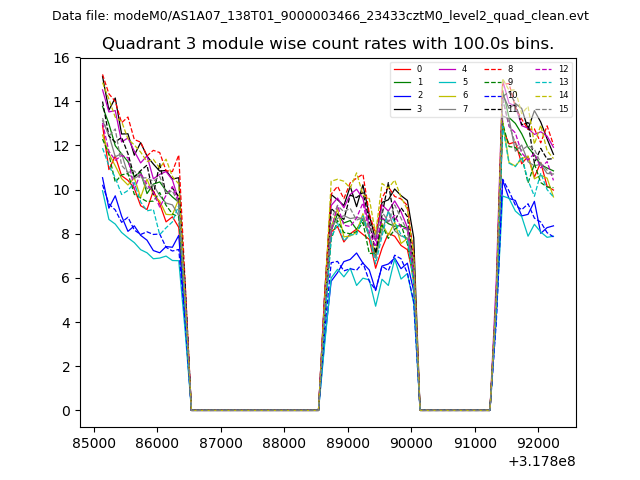
| Module-wise count rates for Quadrant C Data is divided into 100 sec bins |
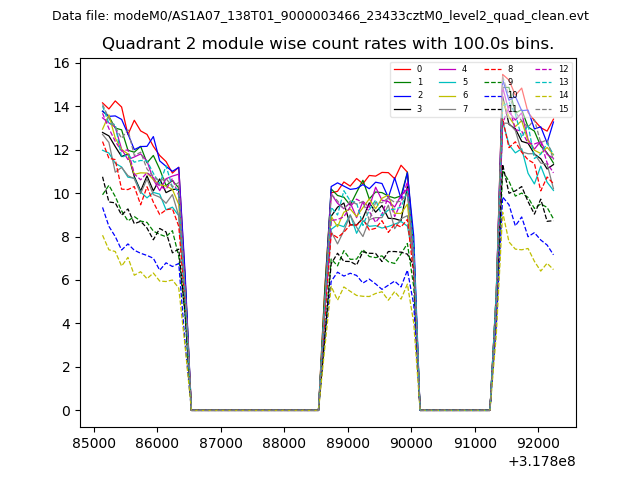 |
 |
| Module-wise count rates for Quadrant D Data is divided into 100 sec bins |
 |
 |
| Parameter | Plot |
|---|---|
| CZT HV Monitor | 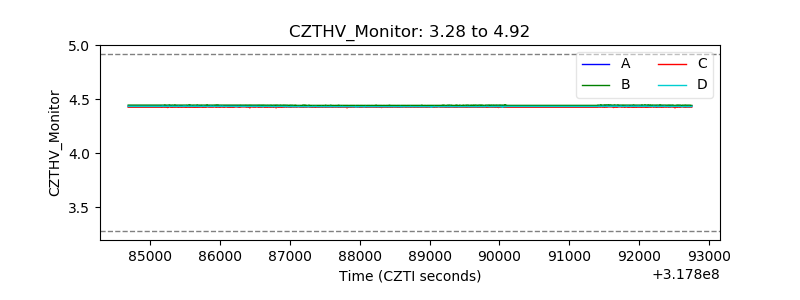 |
| D_VDD | 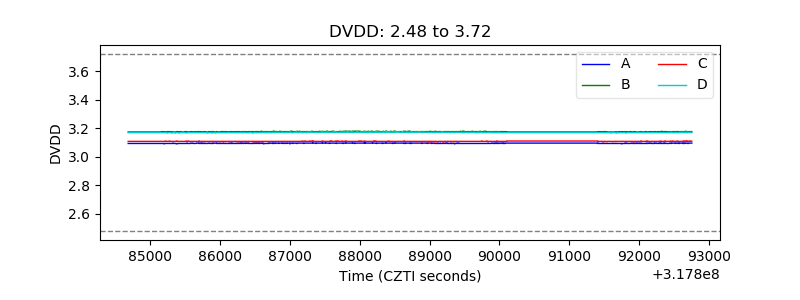 |
| Temperature 1 | 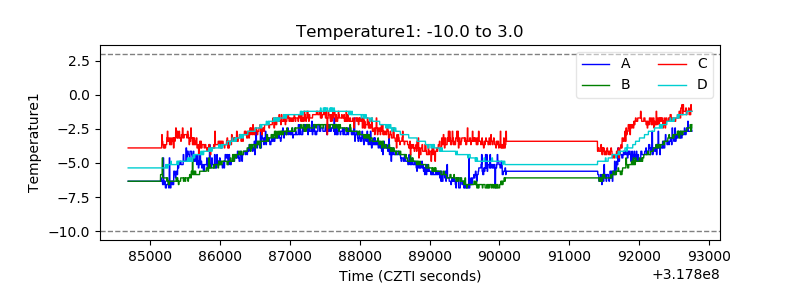 |
| Veto HV Monitor | 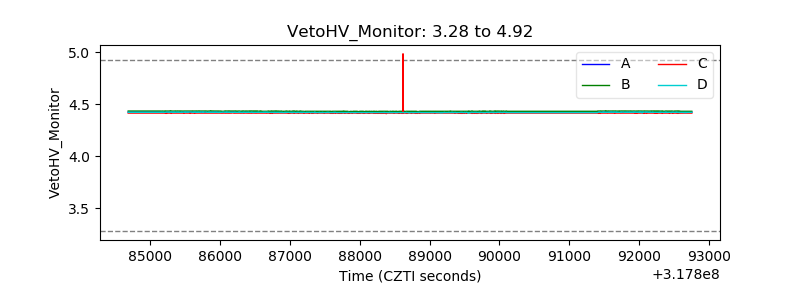 |
| Veto LLD | 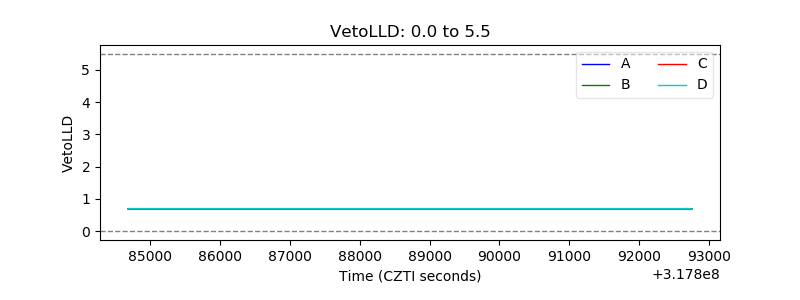 |
| Alpha Counter | 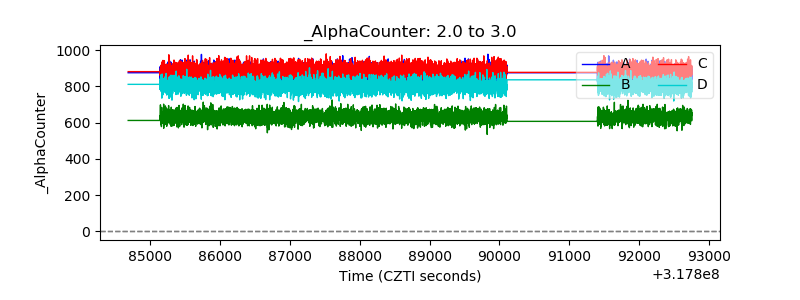 |
| _CPM_Rate | 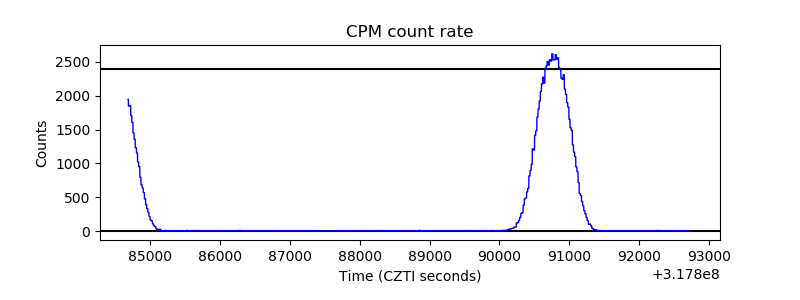 |
| CZT Counter | 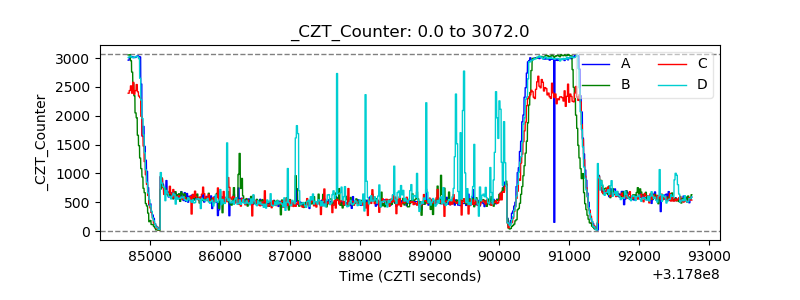 |
| +2.5 Volts monitor |  |
| +5 Volts monitor |  |
| _ROLL_ROT | 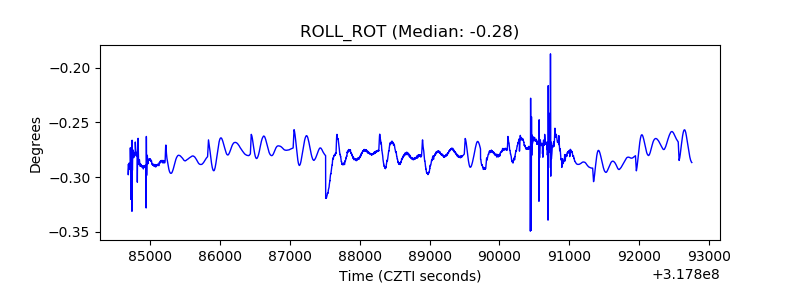 |
| _Roll_DEC | 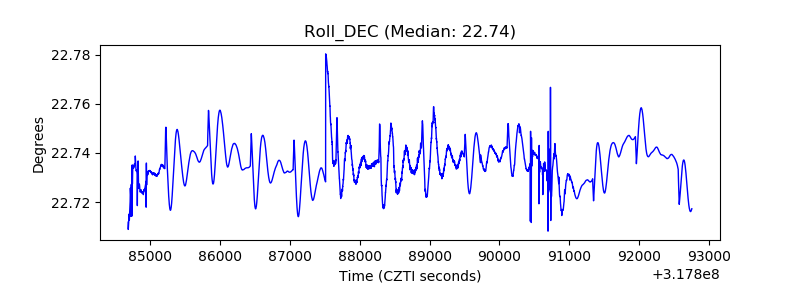 |
| _Roll_RA | 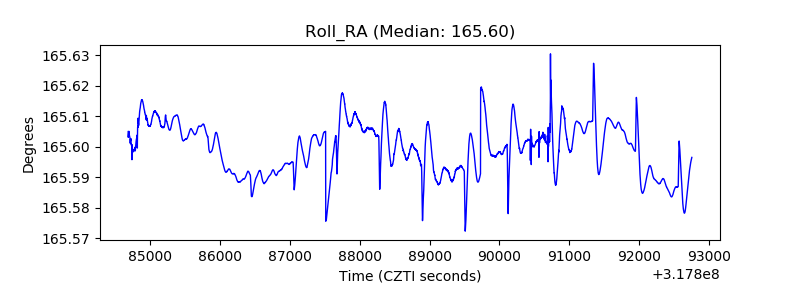 |
| Veto Counter | 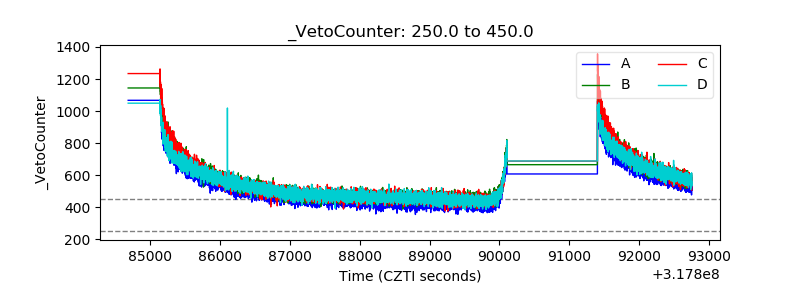 |