| Param | Original file | Final file |
|---|---|---|
| Filename | modeM0/AS1A07_138T01_9000003466_23434cztM0_level2.evt | modeM0/AS1A07_138T01_9000003466_23434cztM0_level2_quad_clean.evt |
| Size (bytes) | 341,616,960 | 54,432,000 |
| Size | 325.8 MB | 51.9 MB |
| Events in quadrant A | 2,301,241 | 345,704 |
| Events in quadrant B | 2,430,993 | 345,187 |
| Events in quadrant C | 2,383,828 | 328,877 |
| Events in quadrant D | 2,934,163 | 322,560 |
| Mode SS | |||
|---|---|---|---|
| Quadrant | BADHDUFLAG | Total packets | Discarded packets |
| A | 0 | 88 | 0 |
| B | 0 | 88 | 0 |
| C | 0 | 88 | 0 |
| D | 0 | 88 | 0 |
| Mode M0 | |||
|---|---|---|---|
| Quadrant | BADHDUFLAG | Total packets | Discarded packets |
| A | 0 | 9233 | 0 |
| B | 0 | 9771 | 0 |
| C | 0 | 9507 | 0 |
| D | 0 | 11367 | 0 |
| Quadrant | Total seconds | Saturated seconds | Saturation percentage |
|---|---|---|---|
| A | 4337 | 2 | 0.046115% |
| B | 4338 | 5 | 0.115260% |
| C | 4338 | 22 | 0.507146% |
| D | 4338 | 113 | 2.604887% |
Noise dominated data is calculated using 1-second bins in cleaned event files. If a bin has >2000 counts, and if more than 50% of those come from <1% of pixels, then it is considered to be noise-dominated and hence unusable.
| Quadrant | # 1 sec bins | Bins with >0 counts | Bins with >2000 counts | High rate bins dominated by noise | Noise dominated (total time) | Noise dominated (detector-on time) | Marked lightcurve |
|---|---|---|---|---|---|---|---|
| A | 4337 | 4337 | 0 | 0 | 0.00% | 0.00% | 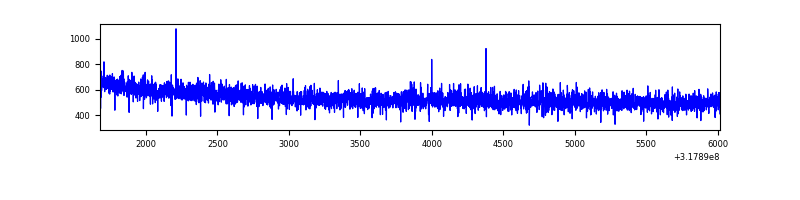 |
| B | 4338 | 4338 | 0 | 0 | 0.00% | 0.00% | 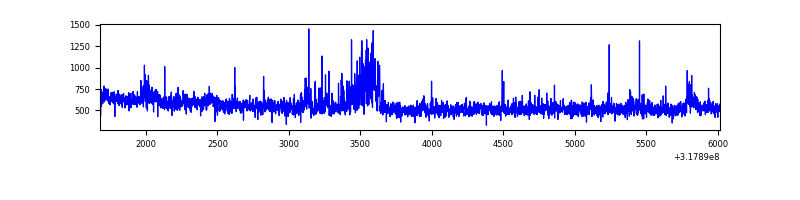 |
| C | 4338 | 4338 | 0 | 0 | 0.00% | 0.00% | 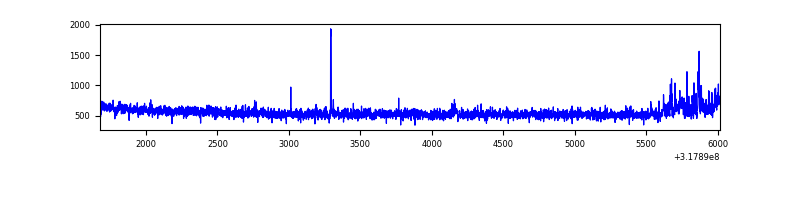 |
| D | 4338 | 4338 | 109 | 109 | 2.51% | 2.51% | 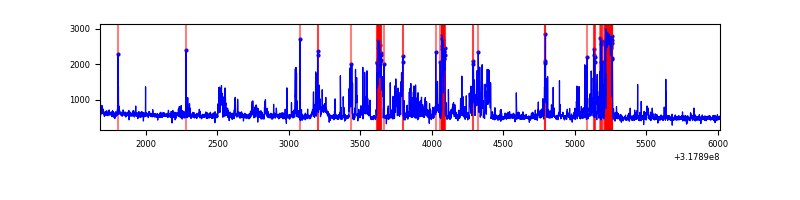 |
Top three noisy pixels from each quadrant. If the there are fewer than three noisy pixels in the level2.evt file, extra rows are filled as -1
| Pixel properties | Quadrant properties | ||||||
|---|---|---|---|---|---|---|---|
| Quadrant | DetID | PixID | Counts | Sigma | Mean | Median | Sigma |
| A | 13 | 254 | 6820 | 52.3 | 596 | 586 | 119.2 |
| A | 0 | 226 | 5166 | 38.43 | 596 | 586 | 119.2 |
| A | 3 | 137 | 4569 | 33.42 | 596 | 586 | 119.2 |
| B | 0 | 190 | 77715 | 711.42 | 582 | 569 | 108.4 |
| B | 0 | 189 | 51313 | 467.94 | 582 | 569 | 108.4 |
| B | 0 | 229 | 24920 | 224.56 | 582 | 569 | 108.4 |
| C | 14 | 238 | 92127 | 709.88 | 563 | 568 | 129.0 |
| C | 10 | 9 | 83138 | 640.18 | 563 | 568 | 129.0 |
| C | 0 | 207 | 7463 | 53.46 | 563 | 568 | 129.0 |
| D | 1 | 52 | 565103 | 4107.51 | 570 | 555 | 137.4 |
| D | 13 | 104 | 122607 | 888.02 | 570 | 555 | 137.4 |
| D | 7 | 238 | 47363 | 340.56 | 570 | 555 | 137.4 |
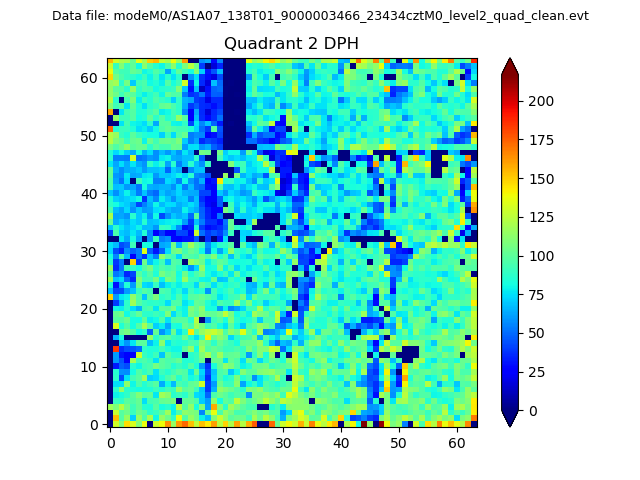
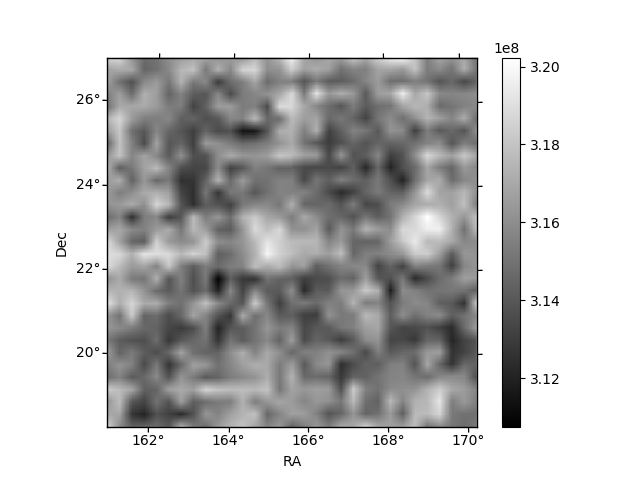
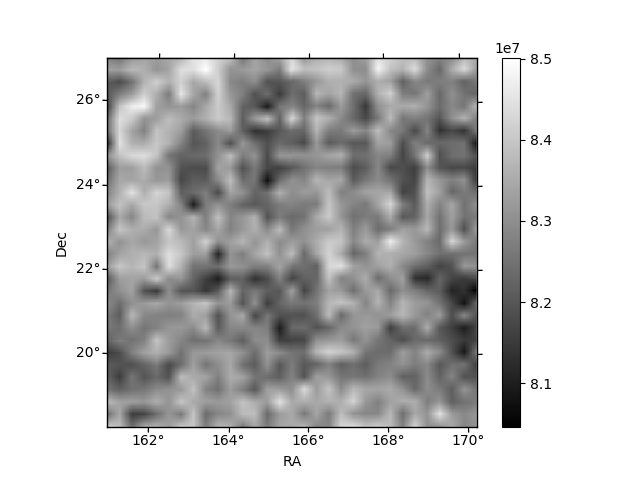
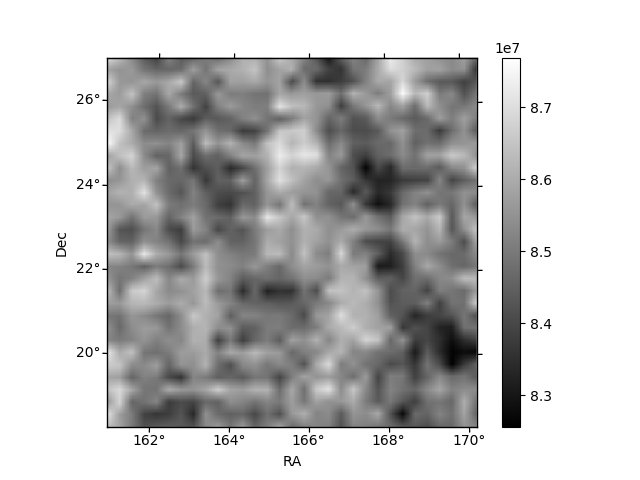
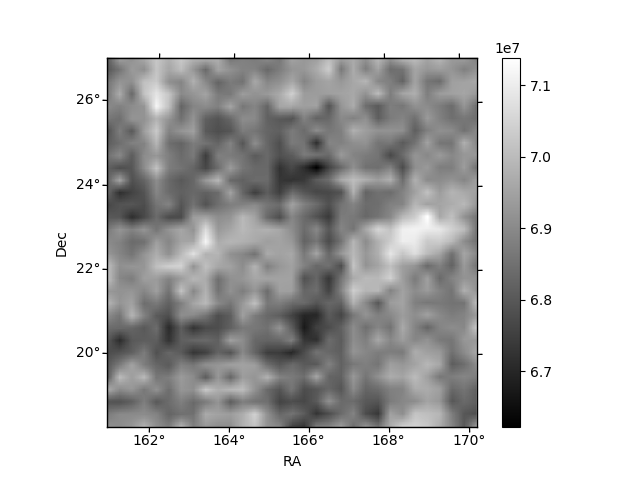
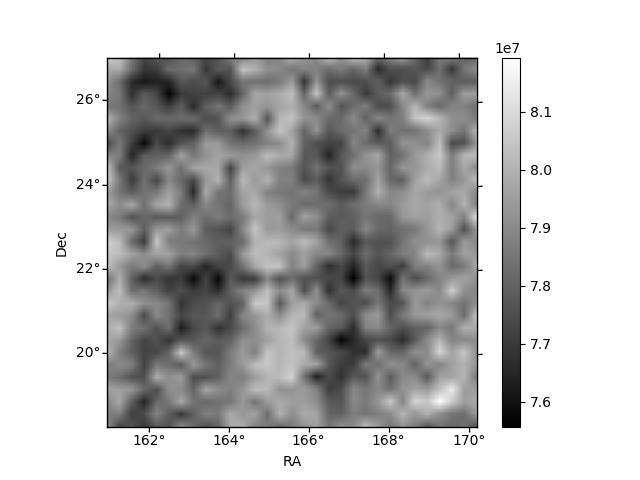
Histogram calculated using DETX and DETY for each event in the final _common_clean file
| Quadrant A | 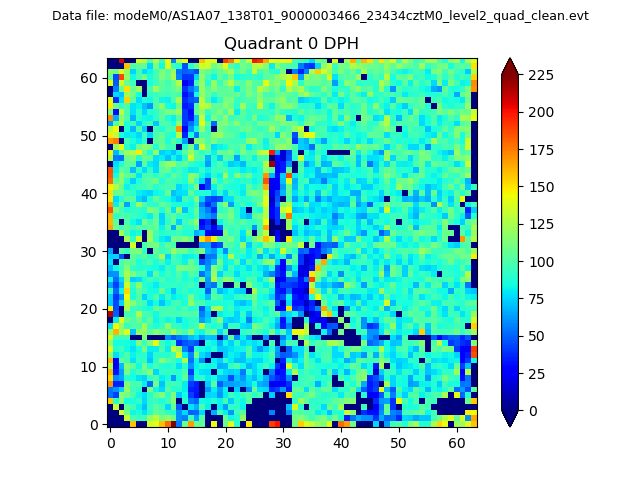 |
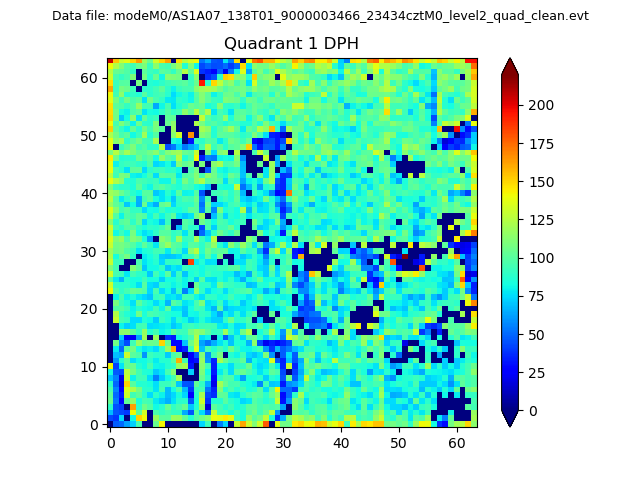 |
Quadrant B |
|---|---|---|---|
| Quadrant D | 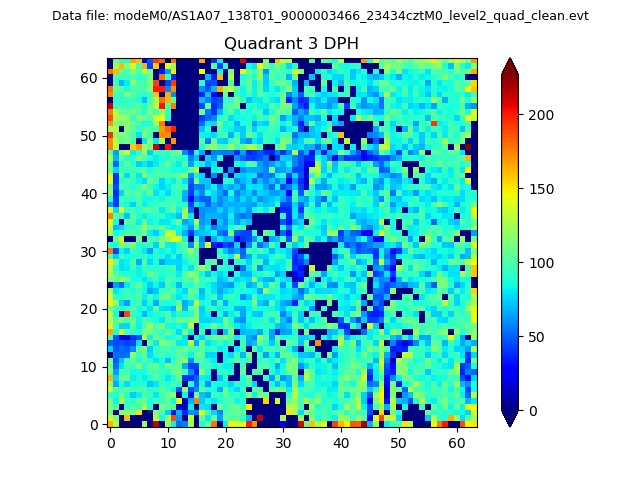 |
 |
Quadrant C |
| Plot type | Count rate plots | Images |
|---|---|---|
| Comparison with Poisson distribution Blue bars denote a histogram of data divided into 1 sec bins. Red curve is a Poisson curve with rate = median count rate of data. |
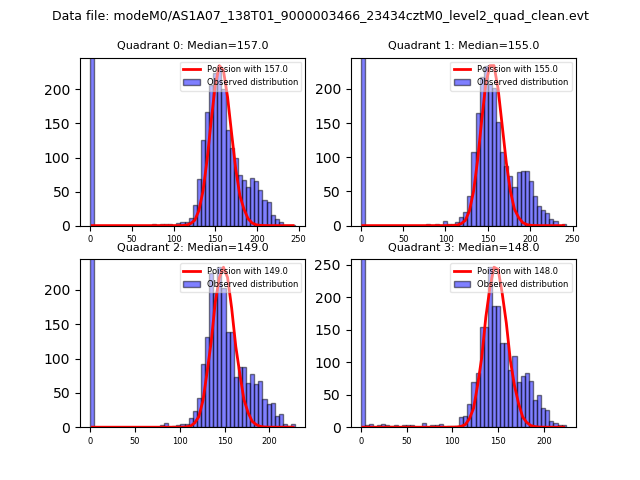 |
 |
| Quadrant-wise count rates Data is divided into 100 sec bins |
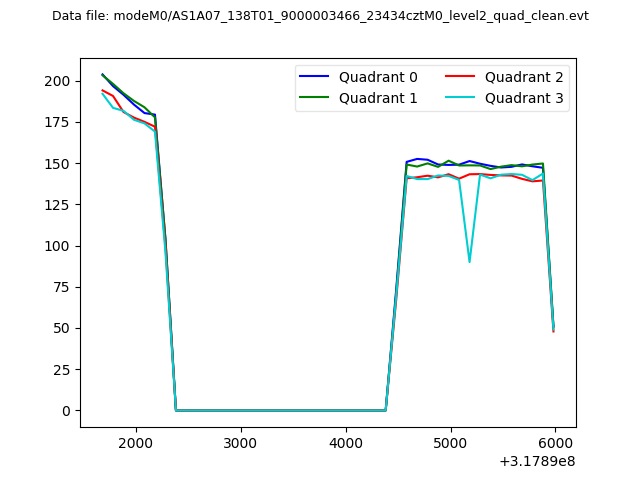 |
|
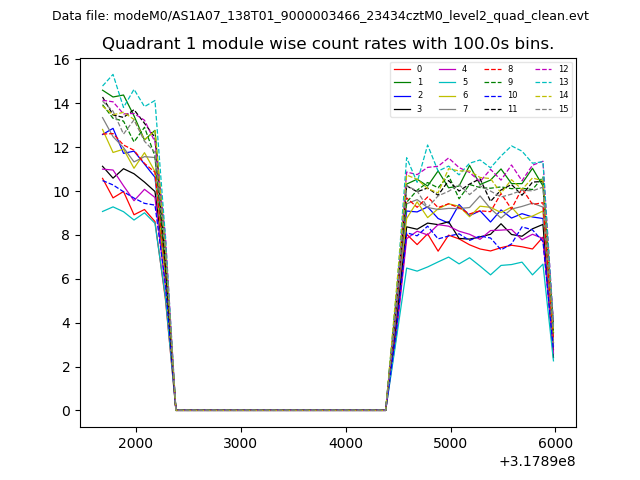
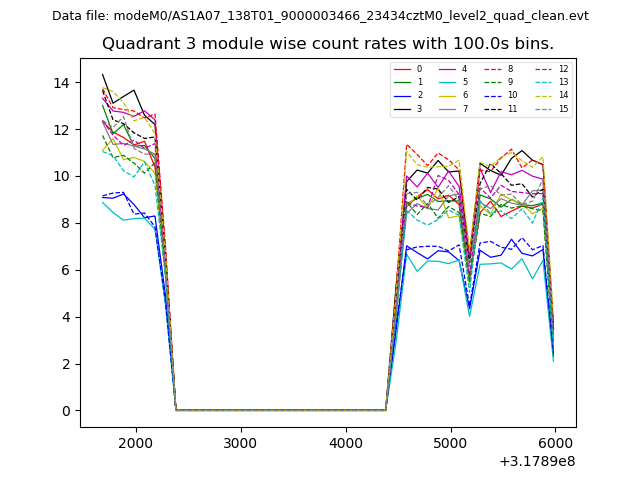
| Module-wise count rates for Quadrant A Data is divided into 100 sec bins |
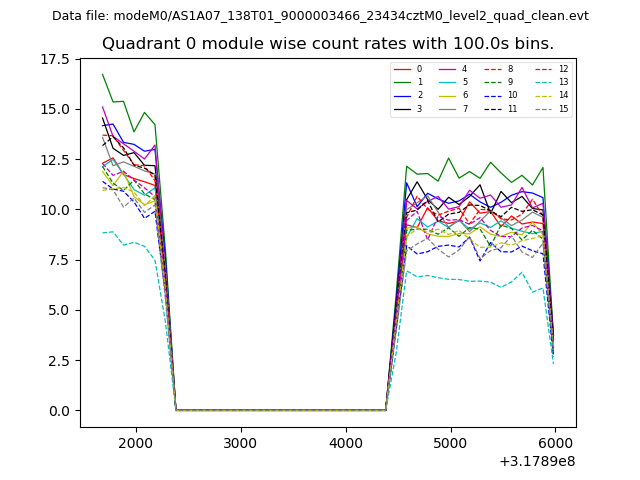 |
 |
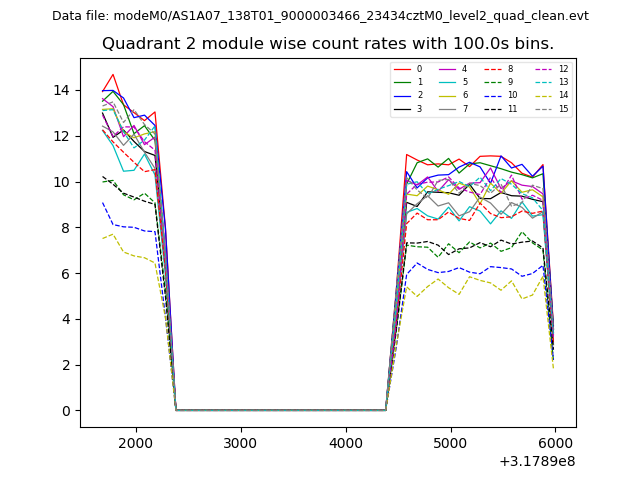
| Module-wise count rates for Quadrant B Data is divided into 100 sec bins |
 |
 |
| Module-wise count rates for Quadrant C Data is divided into 100 sec bins |
 |
 |
| Module-wise count rates for Quadrant D Data is divided into 100 sec bins |
 |
 |
| Parameter | Plot |
|---|---|
| CZT HV Monitor | 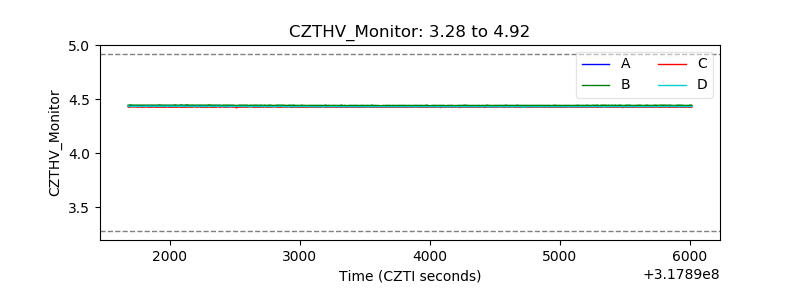 |
| D_VDD | 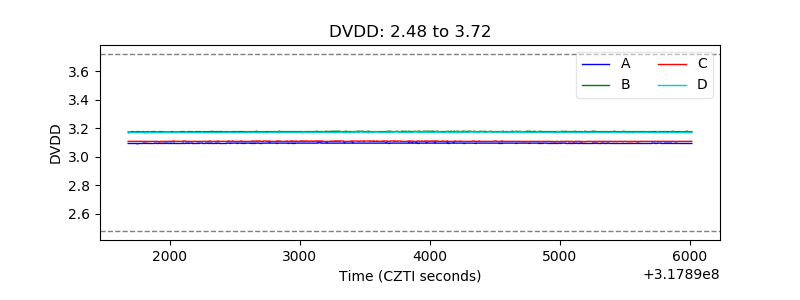 |
| Temperature 1 | 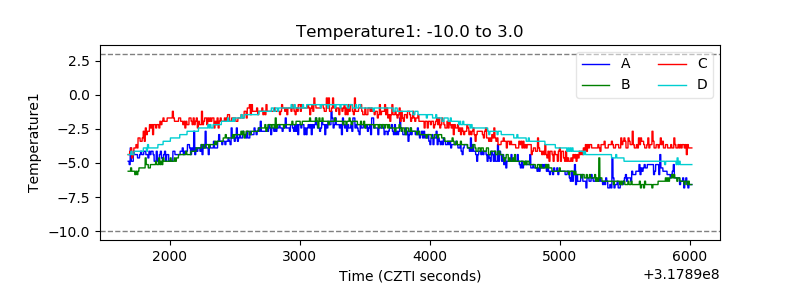 |
| Veto HV Monitor | 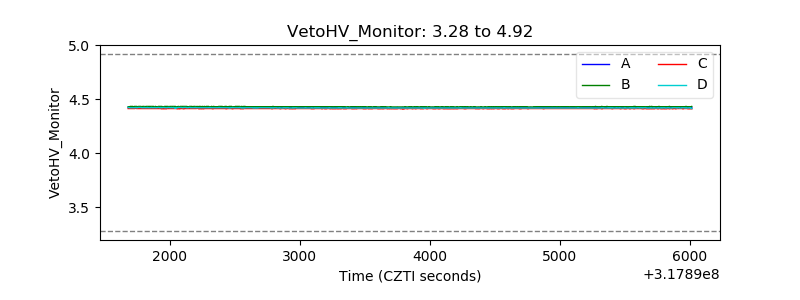 |
| Veto LLD | 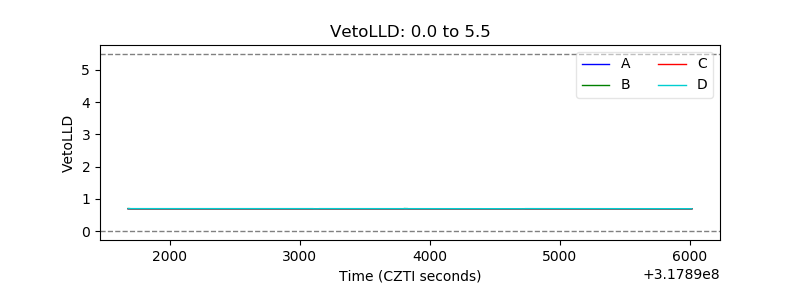 |
| Alpha Counter | 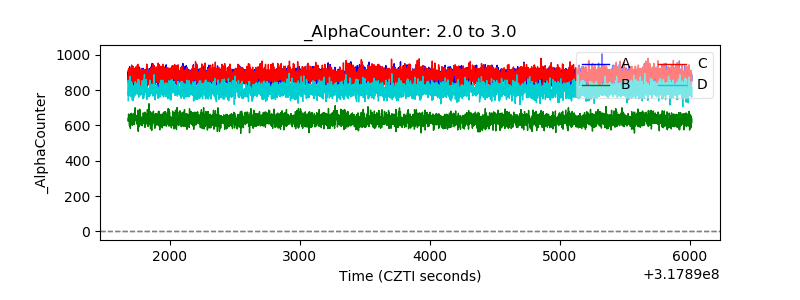 |
| _CPM_Rate | 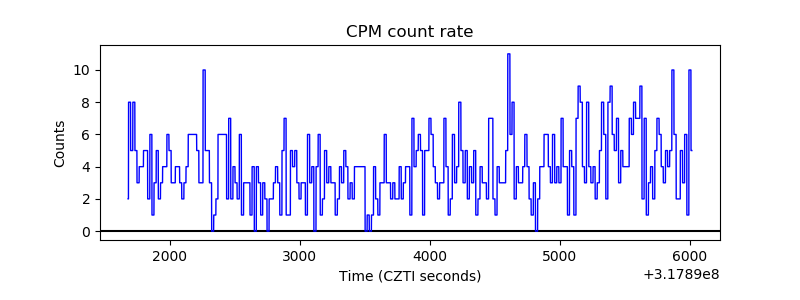 |
| CZT Counter | 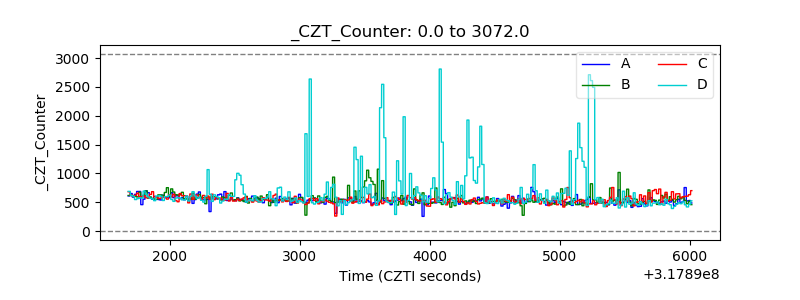 |
| +2.5 Volts monitor |  |
| +5 Volts monitor |  |
| _ROLL_ROT |  |
| _Roll_DEC | 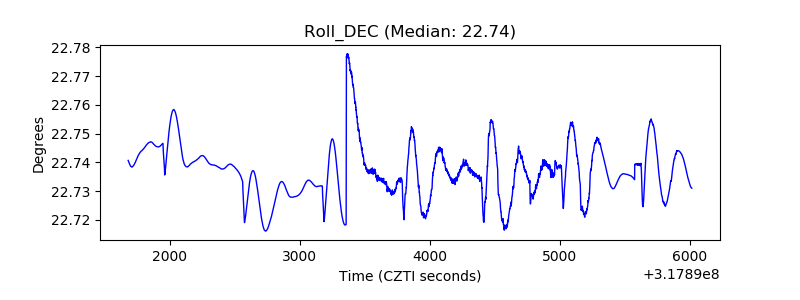 |
| _Roll_RA | 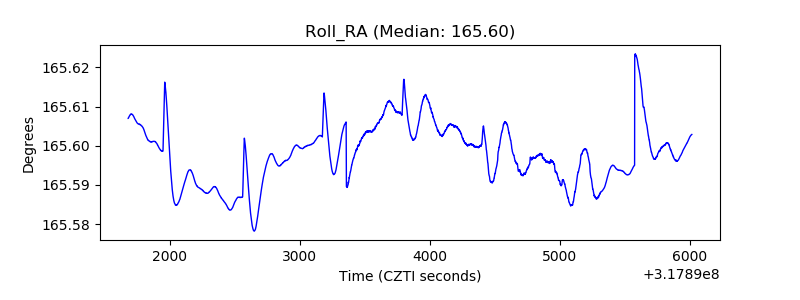 |
| Veto Counter | 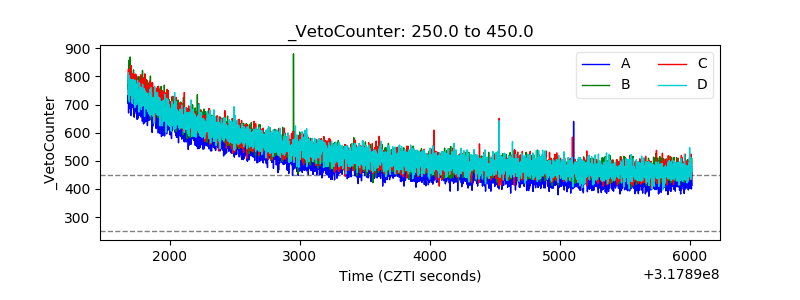 |