| Param | Original file | Final file |
|---|---|---|
| Filename | modeM0/AS1A07_138T01_9000003466_23612cztM0_level2.evt | modeM0/AS1A07_138T01_9000003466_23612cztM0_level2_quad_clean.evt |
| Size (bytes) | 377,746,560 | 53,184,960 |
| Size | 360.2 MB | 50.7 MB |
| Events in quadrant A | 2,280,297 | 333,145 |
| Events in quadrant B | 4,243,678 | 280,758 |
| Events in quadrant C | 2,344,554 | 335,501 |
| Events in quadrant D | 2,246,749 | 325,626 |
| Mode SS | |||
|---|---|---|---|
| Quadrant | BADHDUFLAG | Total packets | Discarded packets |
| A | 0 | 101 | 10 |
| B | 0 | 99 | 7 |
| C | 0 | 103 | 6 |
| D | 0 | 103 | 3 |
| Mode M0 | |||
|---|---|---|---|
| Quadrant | BADHDUFLAG | Total packets | Discarded packets |
| A | 0 | 10672 | 764 |
| B | 0 | 17785 | 2125 |
| C | 0 | 10718 | 669 |
| D | 0 | 10773 | 730 |
| Mode M9 | |||
|---|---|---|---|
| Quadrant | BADHDUFLAG | Total packets | Discarded packets |
| A | 0 | 5 | 3 |
| B | 0 | 7 | 4 |
| C | 0 | 5 | 1 |
| D | 0 | 5 | 2 |
| Quadrant | Total seconds | Saturated seconds | Saturation percentage |
|---|---|---|---|
| A | 4777 | 106 | 2.218966% |
| B | 4656 | 846 | 18.170103% |
| C | 4841 | 135 | 2.788680% |
| D | 4809 | 86 | 1.788314% |
Noise dominated data is calculated using 1-second bins in cleaned event files. If a bin has >2000 counts, and if more than 50% of those come from <1% of pixels, then it is considered to be noise-dominated and hence unusable.
| Quadrant | # 1 sec bins | Bins with >0 counts | Bins with >2000 counts | High rate bins dominated by noise | Noise dominated (total time) | Noise dominated (detector-on time) | Marked lightcurve |
|---|---|---|---|---|---|---|---|
| A | 5448 | 4990 | 0 | 0 | 0.00% | 0.00% | 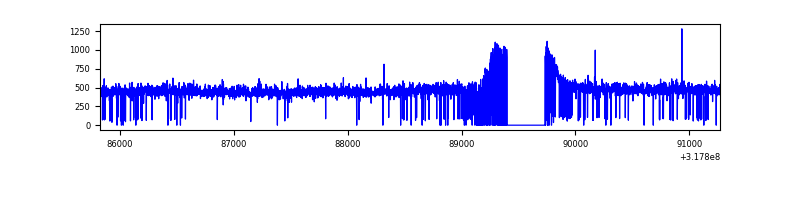 |
| B | 5447 | 4830 | 521 | 521 | 9.56% | 10.79% | 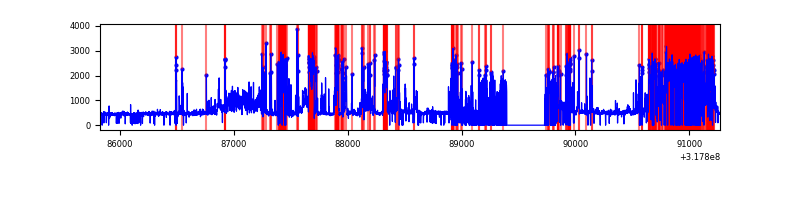 |
| C | 5446 | 5019 | 1 | 1 | 0.02% | 0.02% | 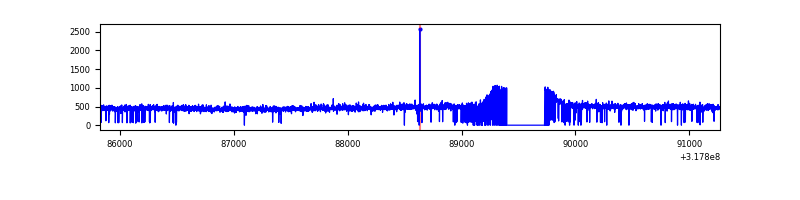 |
| D | 5447 | 5001 | 2 | 2 | 0.04% | 0.04% | 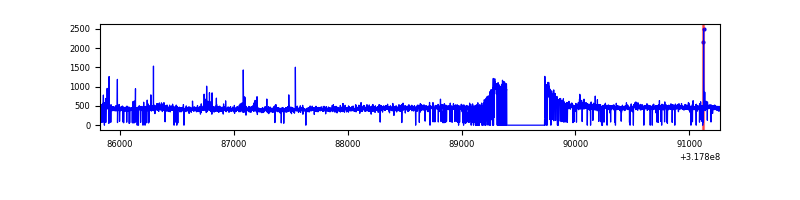 |
Top three noisy pixels from each quadrant. If the there are fewer than three noisy pixels in the level2.evt file, extra rows are filled as -1
| Pixel properties | Quadrant properties | ||||||
|---|---|---|---|---|---|---|---|
| Quadrant | DetID | PixID | Counts | Sigma | Mean | Median | Sigma |
| A | 13 | 254 | 7217 | 55.28 | 591 | 578 | 120.1 |
| A | 3 | 137 | 5583 | 41.67 | 591 | 578 | 120.1 |
| A | 0 | 226 | 4991 | 36.75 | 591 | 578 | 120.1 |
| B | 3 | 64 | 2200139 | 21911.04 | 516 | 502 | 100.4 |
| B | 12 | 111 | 12524 | 119.75 | 516 | 502 | 100.4 |
| B | 11 | 111 | 10971 | 104.28 | 516 | 502 | 100.4 |
| C | 14 | 238 | 89856 | 646.79 | 576 | 579 | 138.0 |
| C | 10 | 9 | 5810 | 37.9 | 576 | 579 | 138.0 |
| C | 7 | 247 | 4220 | 26.38 | 576 | 579 | 138.0 |
| D | 1 | 52 | 25609 | 176.96 | 580 | 562 | 141.5 |
| D | 12 | 233 | 23730 | 163.68 | 580 | 562 | 141.5 |
| D | 2 | 234 | 19334 | 132.63 | 580 | 562 | 141.5 |
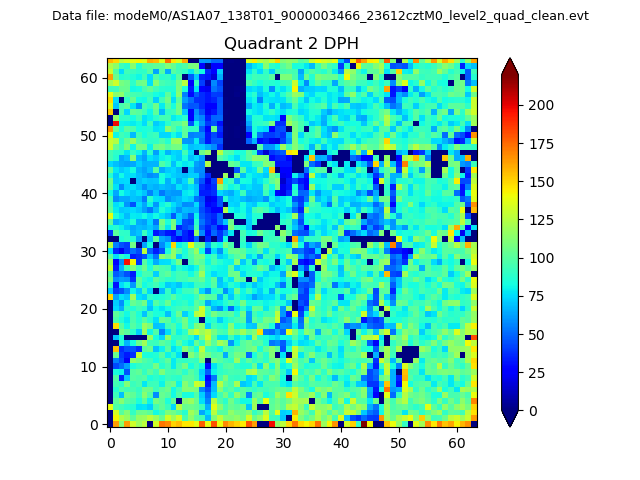
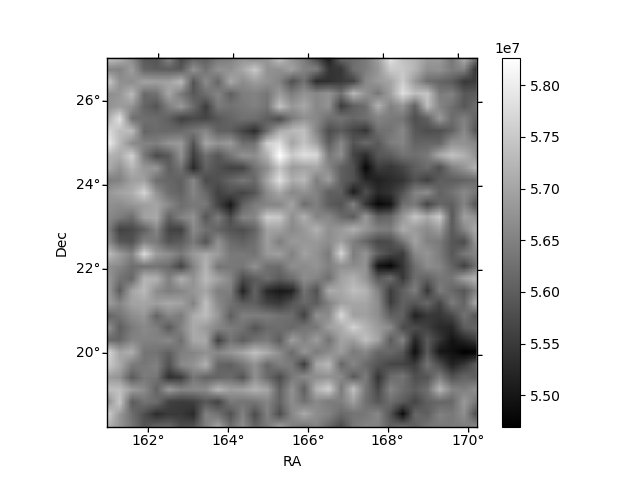
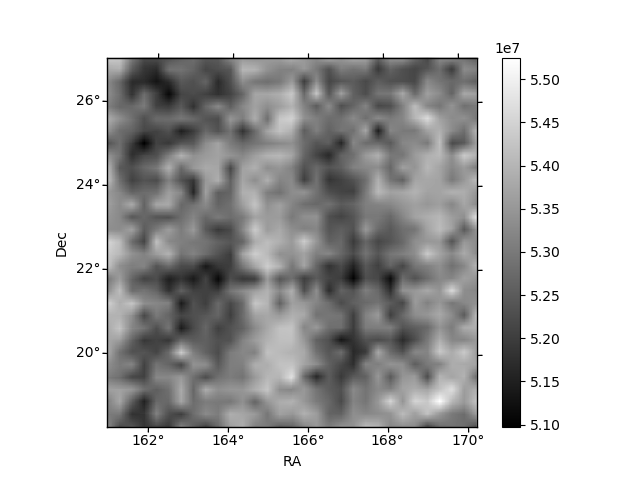
Histogram calculated using DETX and DETY for each event in the final _common_clean file
| Quadrant A | 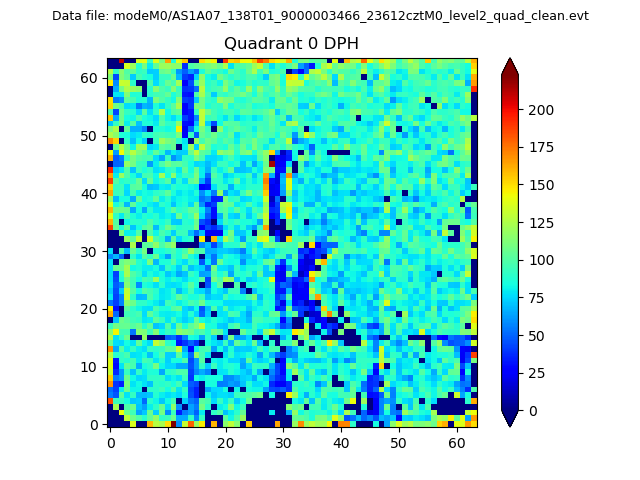 |
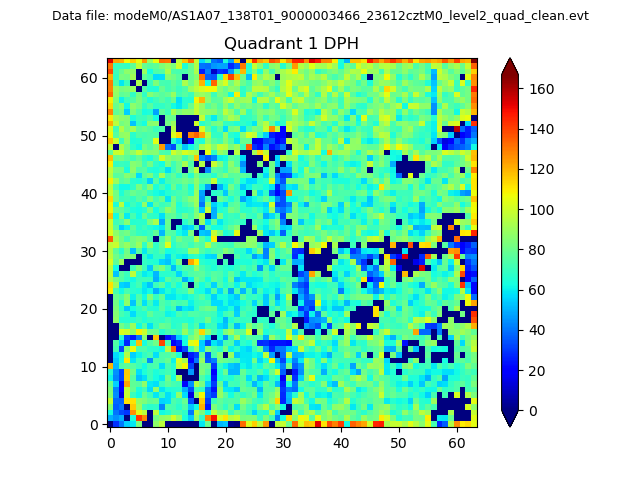 |
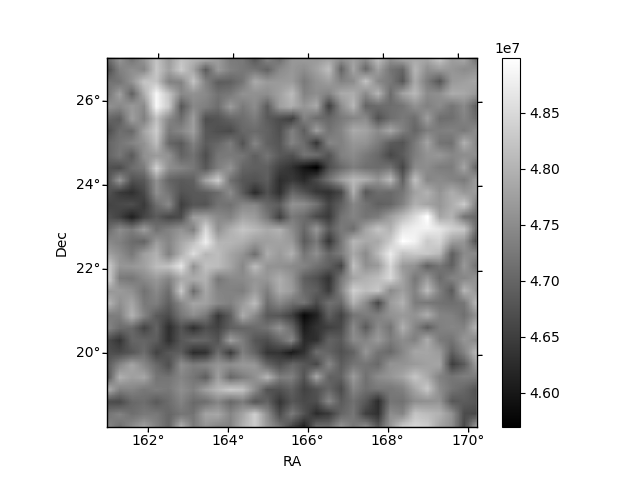
Quadrant B |
|---|---|---|---|
| Quadrant D | 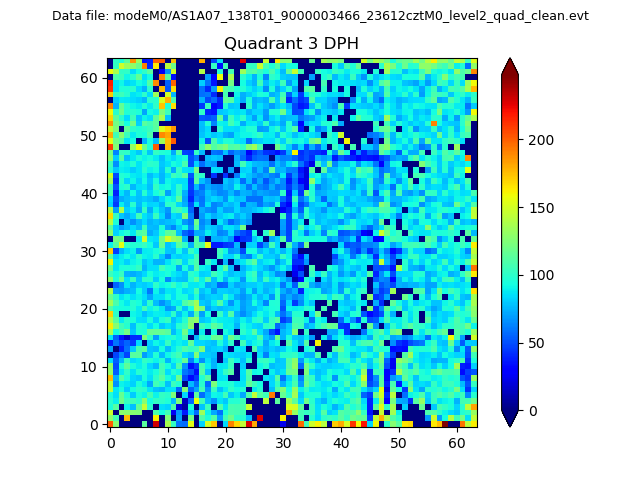 |
 |
Quadrant C |
| Plot type | Count rate plots | Images |
|---|---|---|
| Comparison with Poisson distribution Blue bars denote a histogram of data divided into 1 sec bins. Red curve is a Poisson curve with rate = median count rate of data. |
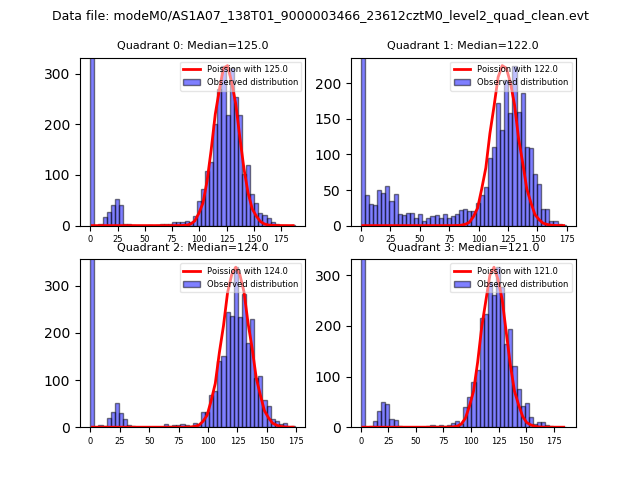 |
 |
| Quadrant-wise count rates Data is divided into 100 sec bins |
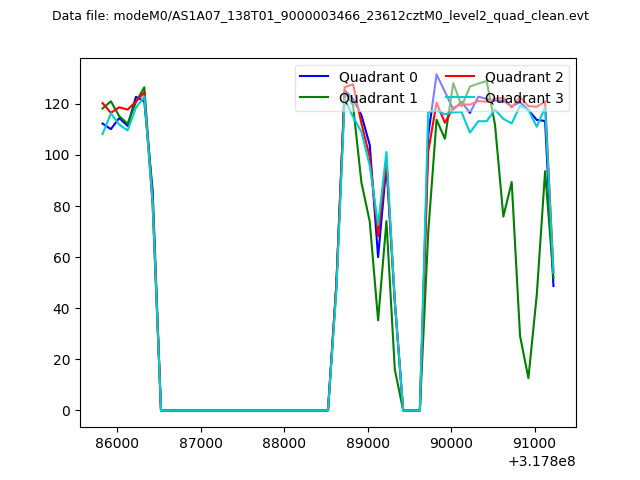 |
|
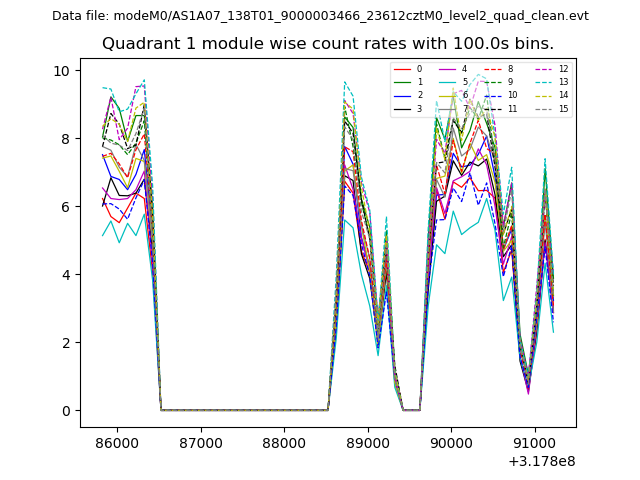
| Module-wise count rates for Quadrant A Data is divided into 100 sec bins |
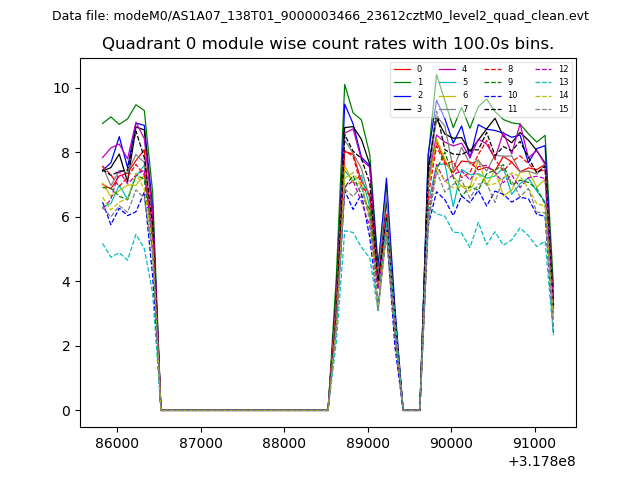 |
 |
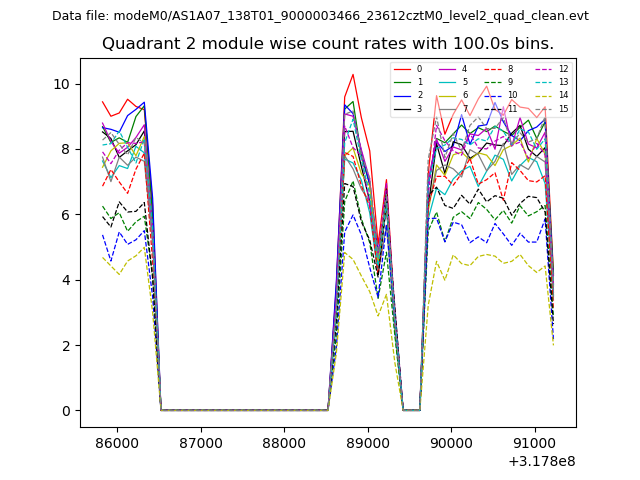
| Module-wise count rates for Quadrant B Data is divided into 100 sec bins |
 |
 |
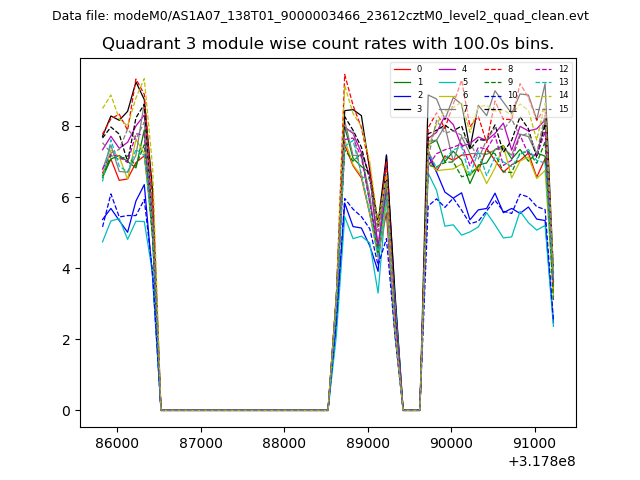
| Module-wise count rates for Quadrant C Data is divided into 100 sec bins |
 |
 |
| Module-wise count rates for Quadrant D Data is divided into 100 sec bins |
 |
 |
| Parameter | Plot |
|---|---|
| CZT HV Monitor | 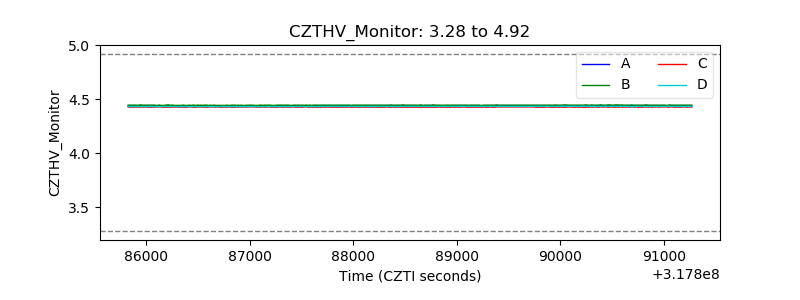 |
| D_VDD | 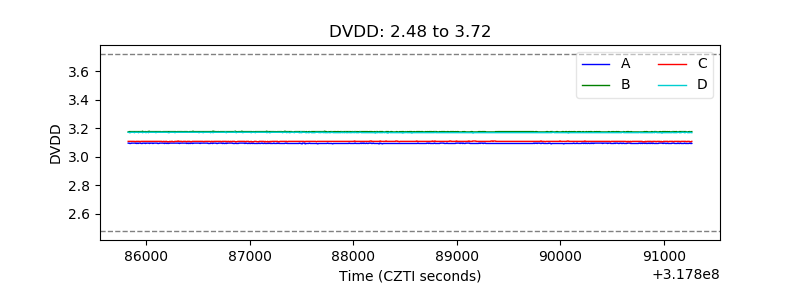 |
| Temperature 1 | 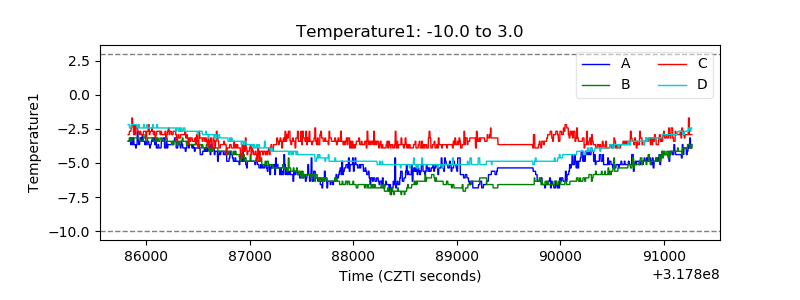 |
| Veto HV Monitor | 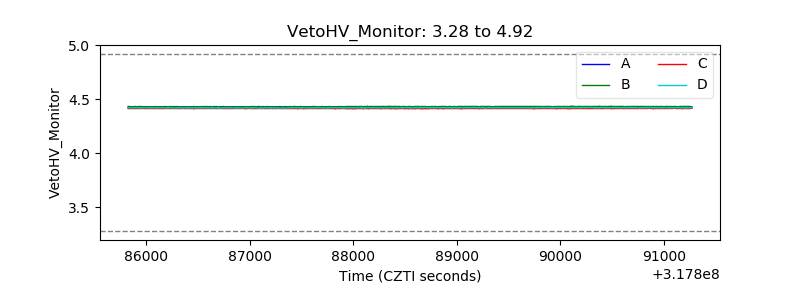 |
| Veto LLD | 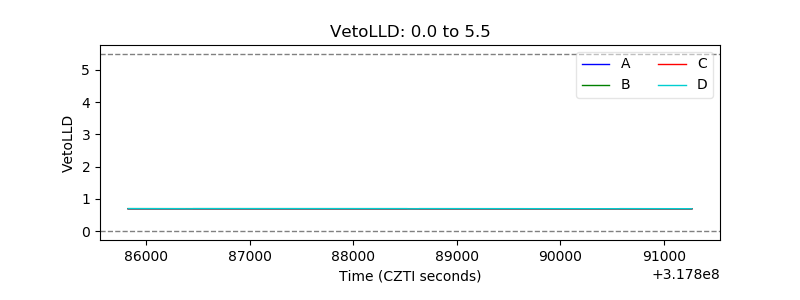 |
| Alpha Counter | 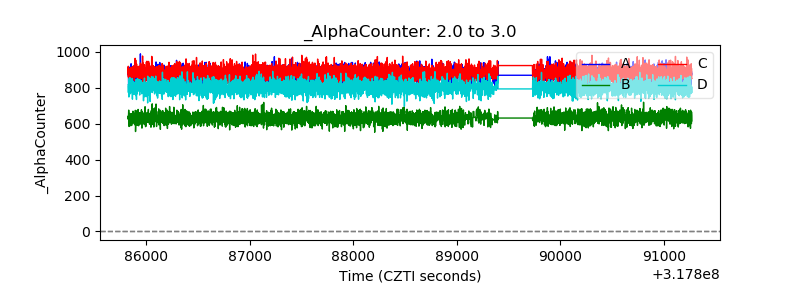 |
| _CPM_Rate | 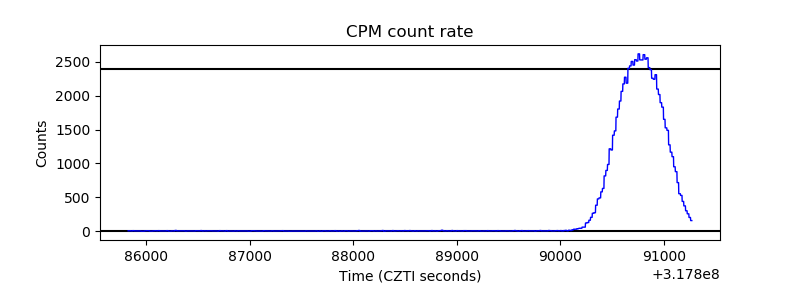 |
| CZT Counter |  |
| +2.5 Volts monitor |  |
| +5 Volts monitor | 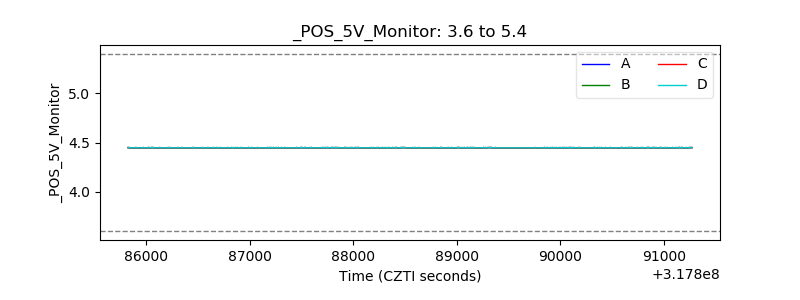 |
| _ROLL_ROT | 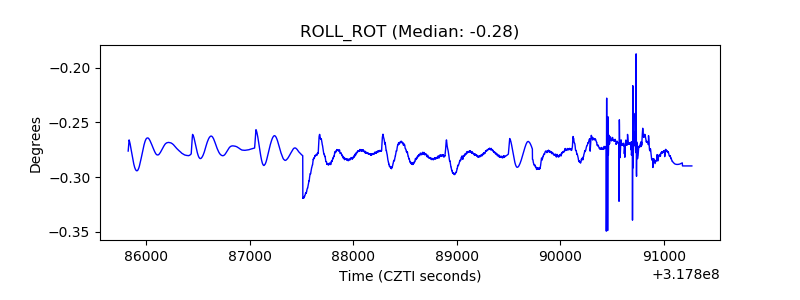 |
| _Roll_DEC | 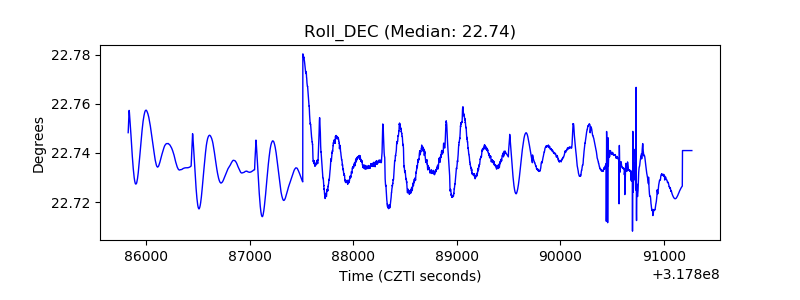 |
| _Roll_RA |  |
| Veto Counter | 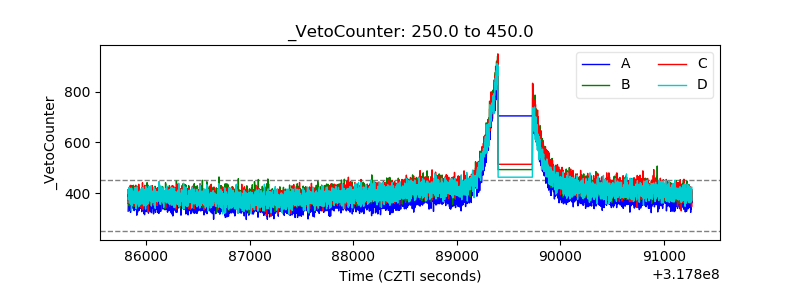 |