| Param | Original file | Final file |
|---|---|---|
| Filename | modeM0/AS1A07_138T02_9000003464cztM0_level2.fits | modeM0/AS1A07_138T02_9000003464cztM0_level2_quad_clean.evt |
| Size (bytes) | 198,768,960 | 208,402,560 |
| Size | 189.6 MB | 198.7 MB |
| Events in quadrant A | 1,216,680 | 1,267,579 |
| Events in quadrant B | 1,165,716 | 1,278,082 |
| Events in quadrant C | 1,169,152 | 1,203,649 |
| Events in quadrant D | 1,027,094 | 1,120,849 |
| Mode SS | |||
|---|---|---|---|
| Quadrant | BADHDUFLAG | Total packets | Discarded packets |
| A | 0 | 426 | 0 |
| B | 0 | 426 | 0 |
| C | 0 | 426 | 0 |
| D | 0 | 426 | 0 |
| Mode M0 | |||
|---|---|---|---|
| Quadrant | BADHDUFLAG | Total packets | Discarded packets |
| A | 0 | 43011 | 0 |
| B | 0 | 44165 | 0 |
| C | 0 | 44704 | 0 |
| D | 0 | 49015 | 0 |
| Mode M9 | |||
|---|---|---|---|
| Quadrant | BADHDUFLAG | Total packets | Discarded packets |
| A | 0 | 16 | 0 |
| B | 0 | 16 | 0 |
| C | 0 | 16 | 0 |
| D | 0 | 16 | 0 |
| Quadrant | Total seconds | Saturated seconds | Saturation percentage |
|---|---|---|---|
| A | 20925 | 115 | 0.549582% |
| B | 20925 | 219 | 1.046595% |
| C | 20925 | 325 | 1.553166% |
| D | 20925 | 530 | 2.532855% |
Noise dominated data is calculated using 1-second bins in cleaned event files. If a bin has >2000 counts, and if more than 50% of those come from <1% of pixels, then it is considered to be noise-dominated and hence unusable.
| Quadrant | # 1 sec bins | Bins with >0 counts | Bins with >2000 counts | High rate bins dominated by noise | Noise dominated (total time) | Noise dominated (detector-on time) | Marked lightcurve |
|---|---|---|---|---|---|---|---|
| A | 22550 | 20924 | 0 | 0 | 0.00% | 0.00% |  |
| B | 22550 | 20921 | 0 | 0 | 0.00% | 0.00% |  |
| C | 22550 | 20922 | 0 | 0 | 0.00% | 0.00% |  |
| D | 22550 | 20915 | 0 | 0 | 0.00% | 0.00% | 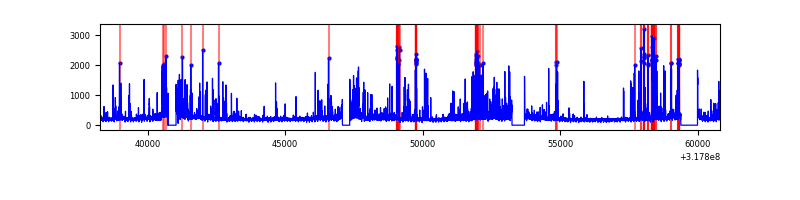 |
Top three noisy pixels from each quadrant. If the there are fewer than three noisy pixels in the level2.evt file, extra rows are filled as -1
| Pixel properties | Quadrant properties | ||||||
|---|---|---|---|---|---|---|---|
| Quadrant | DetID | PixID | Counts | Sigma | Mean | Median | Sigma |
| A | 0 | 29 | 1139 | 10.45 | 316 | 296 | 80.6 |
| A | 7 | 110 | 950 | 8.11 | 316 | 296 | 80.6 |
| A | 14 | 79 | 932 | 7.89 | 316 | 296 | 80.6 |
| B | 2 | 9 | 922 | 10.01 | 307 | 293 | 62.8 |
| B | 3 | 80 | 782 | 7.78 | 307 | 293 | 62.8 |
| B | 14 | 254 | 774 | 7.65 | 307 | 293 | 62.8 |
| C | 12 | 249 | 815 | 6.61 | 308 | 288 | 79.7 |
| C | 12 | 241 | 811 | 6.56 | 308 | 288 | 79.7 |
| C | 12 | 250 | 772 | 6.07 | 308 | 288 | 79.7 |
| D | 3 | 14 | 791 | 6.58 | 293 | 266 | 79.8 |
| D | 6 | 38 | 756 | 6.14 | 293 | 266 | 79.8 |
| D | 7 | 3 | 733 | 5.85 | 293 | 266 | 79.8 |
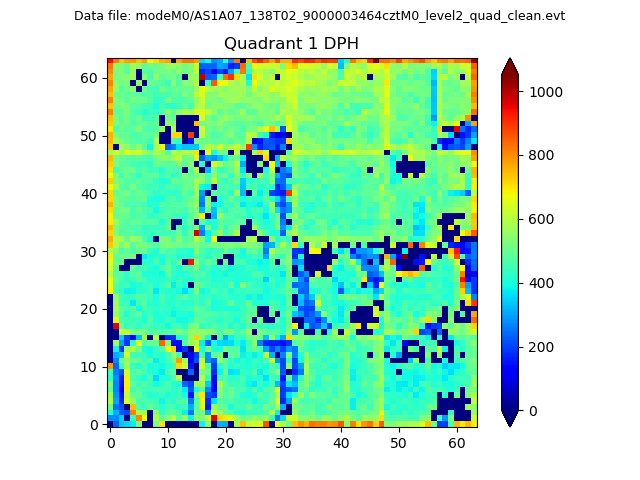
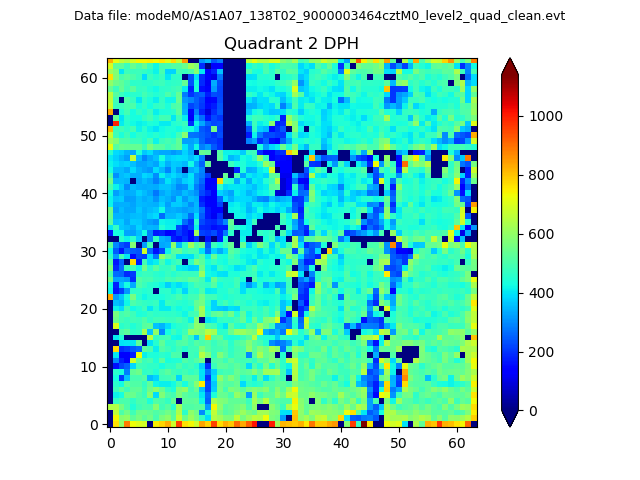
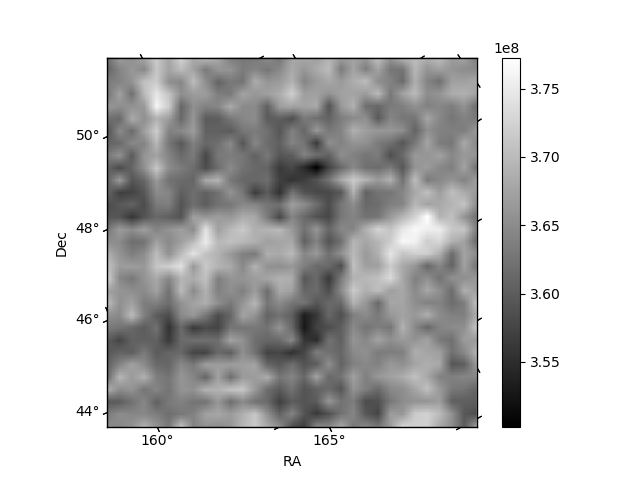
Histogram calculated using DETX and DETY for each event in the final _common_clean file
| Quadrant A |  |
 |
Quadrant B |
|---|---|---|---|
| Quadrant D | 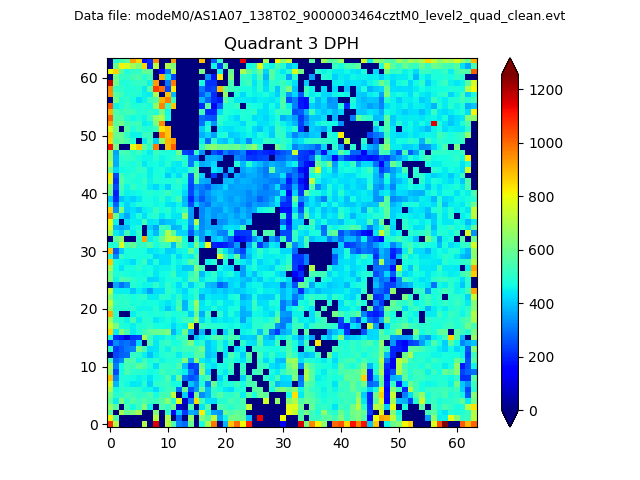 |
 |
Quadrant C |
| Plot type | Count rate plots | Images |
|---|---|---|
| Comparison with Poisson distribution Blue bars denote a histogram of data divided into 1 sec bins. Red curve is a Poisson curve with rate = median count rate of data. |
 |
 |
| Quadrant-wise count rates Data is divided into 100 sec bins |
 |
|
| Module-wise count rates for Quadrant A Data is divided into 100 sec bins |
 |
 |
| Module-wise count rates for Quadrant B Data is divided into 100 sec bins |
 |
 |
| Module-wise count rates for Quadrant C Data is divided into 100 sec bins |
 |
 |
| Module-wise count rates for Quadrant D Data is divided into 100 sec bins |
 |
 |
| Parameter | Plot |
|---|---|
| CZT HV Monitor | 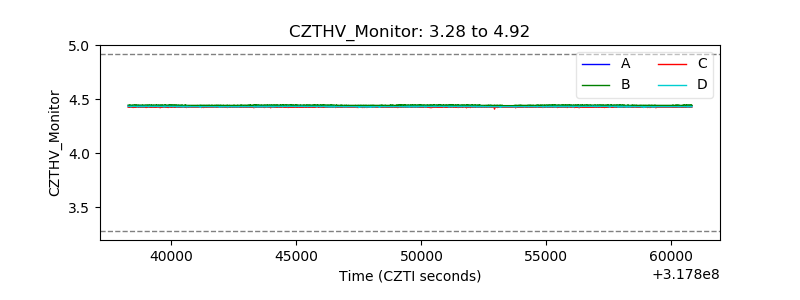 |
| D_VDD |  |
| Temperature 1 |  |
| Veto HV Monitor |  |
| Veto LLD |  |
| Alpha Counter | 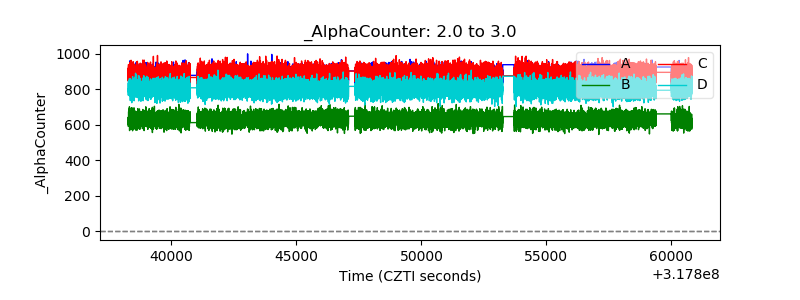 |
| _CPM_Rate |  |
| CZT Counter | 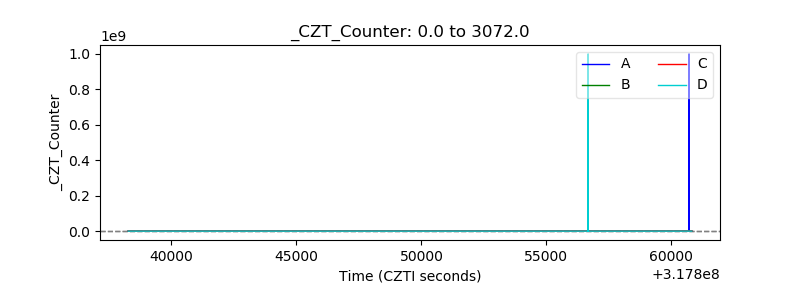 |
| +2.5 Volts monitor |  |
| +5 Volts monitor | 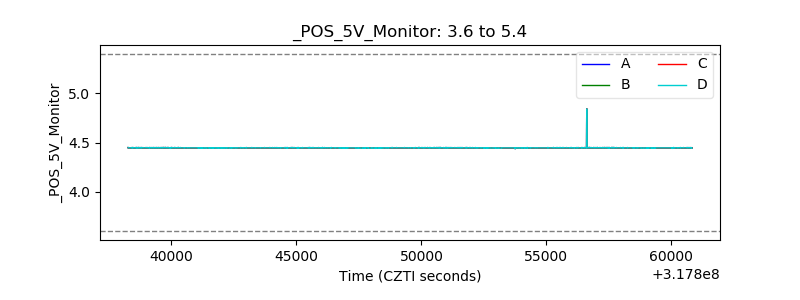 |
| _ROLL_ROT |  |
| _Roll_DEC |  |
| _Roll_RA | 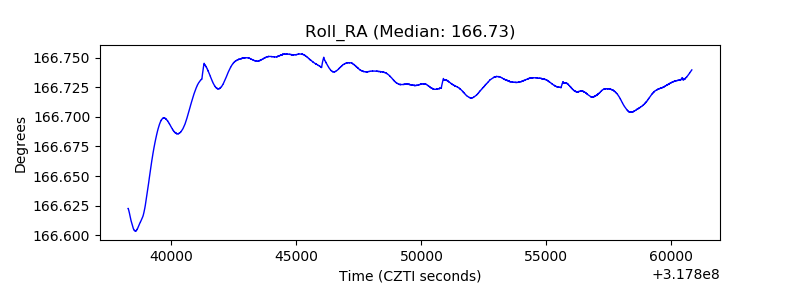 |
| Veto Counter |  |