| Param | Original file | Final file |
|---|---|---|
| Filename | modeM0/AS1A07_138T02_9000003464_23426cztM0_level2.evt | modeM0/AS1A07_138T02_9000003464_23426cztM0_level2_quad_clean.evt |
| Size (bytes) | 516,974,400 | 107,942,400 |
| Size | 493.0 MB | 102.9 MB |
| Events in quadrant A | 3,437,850 | 700,273 |
| Events in quadrant B | 3,588,699 | 712,894 |
| Events in quadrant C | 3,807,400 | 675,370 |
| Events in quadrant D | 4,317,441 | 662,816 |
| Mode SS | |||
|---|---|---|---|
| Quadrant | BADHDUFLAG | Total packets | Discarded packets |
| A | 0 | 150 | 0 |
| B | 0 | 150 | 0 |
| C | 0 | 150 | 0 |
| D | 0 | 150 | 0 |
| Mode M0 | |||
|---|---|---|---|
| Quadrant | BADHDUFLAG | Total packets | Discarded packets |
| A | 0 | 15256 | 1 |
| B | 0 | 15536 | 1 |
| C | 0 | 15994 | 1 |
| D | 0 | 18023 | 1 |
| Mode M9 | |||
|---|---|---|---|
| Quadrant | BADHDUFLAG | Total packets | Discarded packets |
| A | 0 | 5 | 0 |
| B | 0 | 5 | 0 |
| C | 0 | 5 | 0 |
| D | 0 | 5 | 0 |
| Quadrant | Total seconds | Saturated seconds | Saturation percentage |
|---|---|---|---|
| A | 7444 | 21 | 0.282106% |
| B | 7444 | 36 | 0.483611% |
| C | 7445 | 80 | 1.074547% |
| D | 7444 | 141 | 1.894143% |
Noise dominated data is calculated using 1-second bins in cleaned event files. If a bin has >2000 counts, and if more than 50% of those come from <1% of pixels, then it is considered to be noise-dominated and hence unusable.
| Quadrant | # 1 sec bins | Bins with >0 counts | Bins with >2000 counts | High rate bins dominated by noise | Noise dominated (total time) | Noise dominated (detector-on time) | Marked lightcurve |
|---|---|---|---|---|---|---|---|
| A | 7899 | 7445 | 0 | 0 | 0.00% | 0.00% | 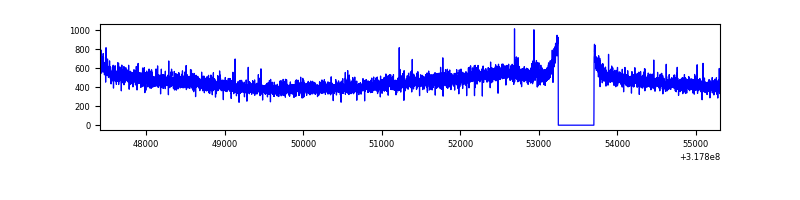 |
| B | 7899 | 7444 | 0 | 0 | 0.00% | 0.00% | 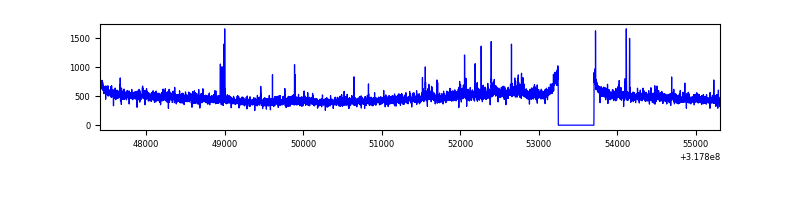 |
| C | 7900 | 7446 | 0 | 0 | 0.00% | 0.00% | 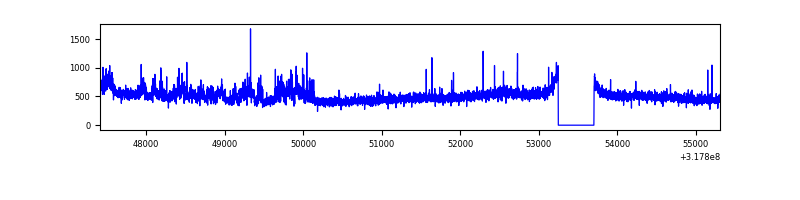 |
| D | 7899 | 7445 | 124 | 124 | 1.57% | 1.67% | 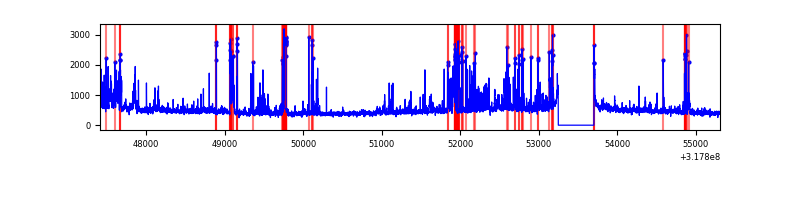 |
Top three noisy pixels from each quadrant. If the there are fewer than three noisy pixels in the level2.evt file, extra rows are filled as -1
| Pixel properties | Quadrant properties | ||||||
|---|---|---|---|---|---|---|---|
| Quadrant | DetID | PixID | Counts | Sigma | Mean | Median | Sigma |
| A | 13 | 254 | 11205 | 57.21 | 890 | 870 | 180.6 |
| A | 3 | 137 | 8004 | 39.49 | 890 | 870 | 180.6 |
| A | 0 | 226 | 7724 | 37.94 | 890 | 870 | 180.6 |
| B | 0 | 189 | 61701 | 356.56 | 889 | 867 | 170.6 |
| B | 12 | 111 | 20815 | 116.92 | 889 | 867 | 170.6 |
| B | 11 | 111 | 18228 | 101.75 | 889 | 867 | 170.6 |
| C | 10 | 9 | 308108 | 1532.38 | 856 | 860 | 200.5 |
| C | 14 | 238 | 136026 | 674.13 | 856 | 860 | 200.5 |
| C | 8 | 128 | 8510 | 38.15 | 856 | 860 | 200.5 |
| D | 1 | 52 | 821574 | 3884.21 | 862 | 836 | 211.3 |
| D | 12 | 233 | 85995 | 403.02 | 862 | 836 | 211.3 |
| D | 13 | 249 | 48095 | 223.66 | 862 | 836 | 211.3 |
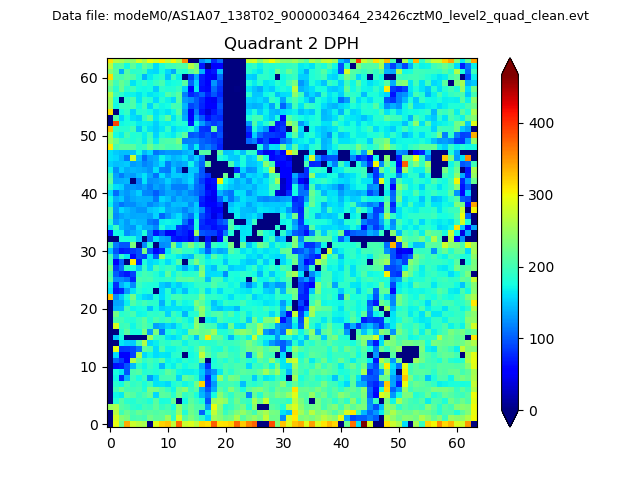
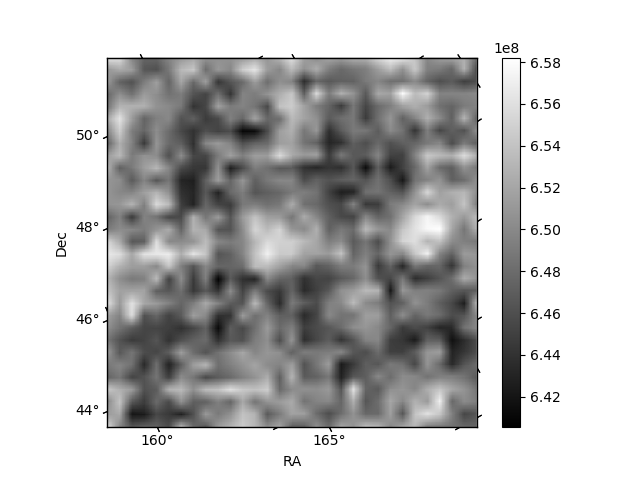
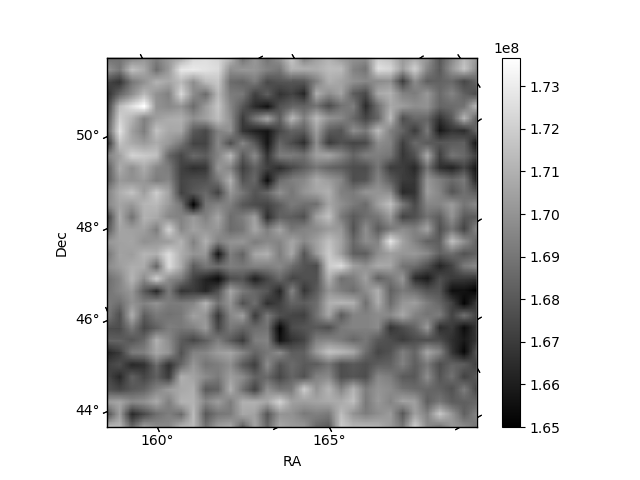
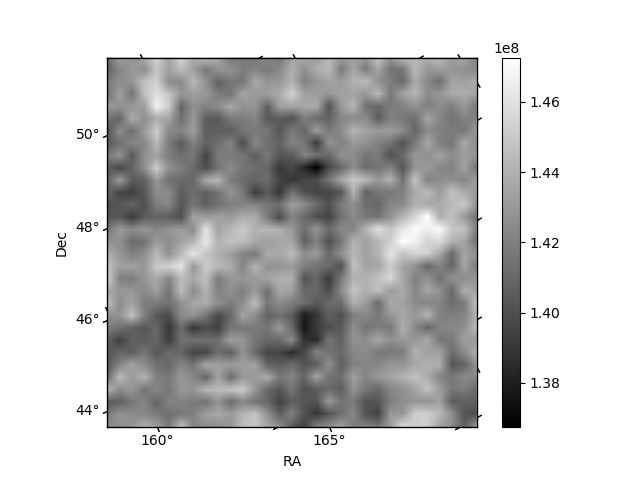
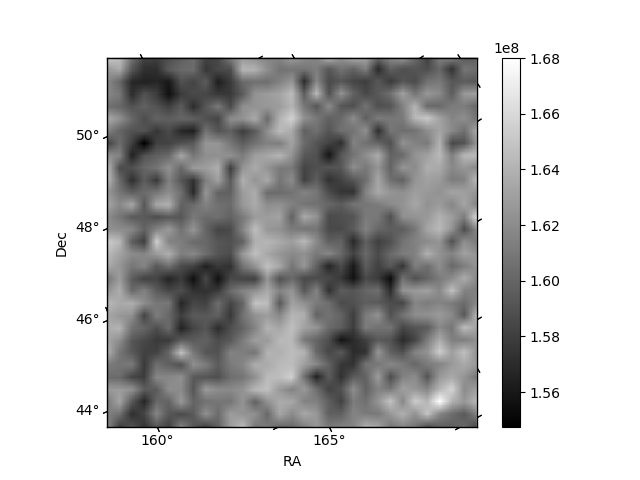
Histogram calculated using DETX and DETY for each event in the final _common_clean file
| Quadrant A | 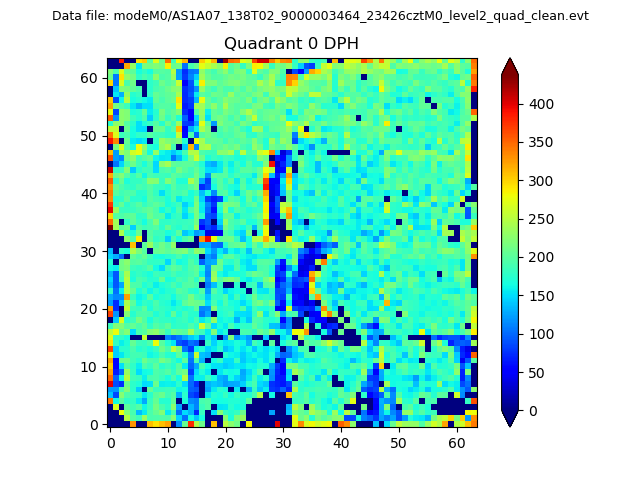 |
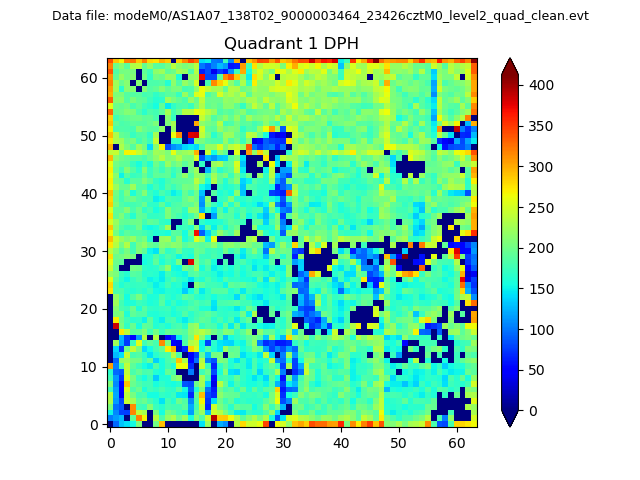 |
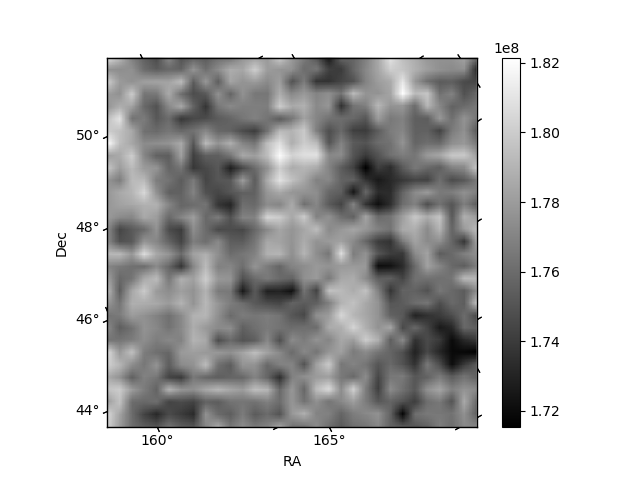
Quadrant B |
|---|---|---|---|
| Quadrant D | 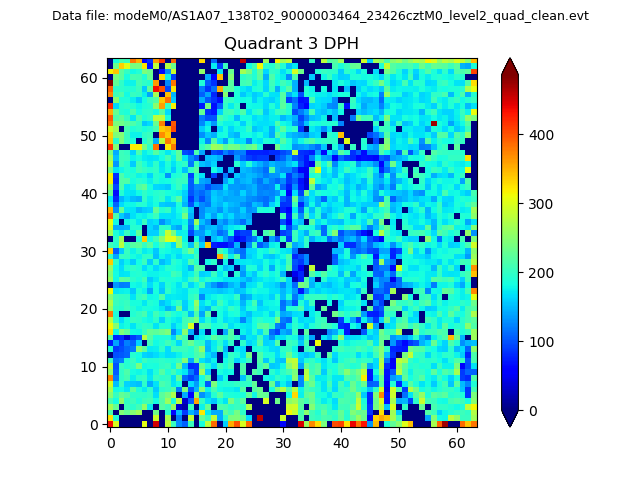 |
 |
Quadrant C |
| Plot type | Count rate plots | Images |
|---|---|---|
| Comparison with Poisson distribution Blue bars denote a histogram of data divided into 1 sec bins. Red curve is a Poisson curve with rate = median count rate of data. |
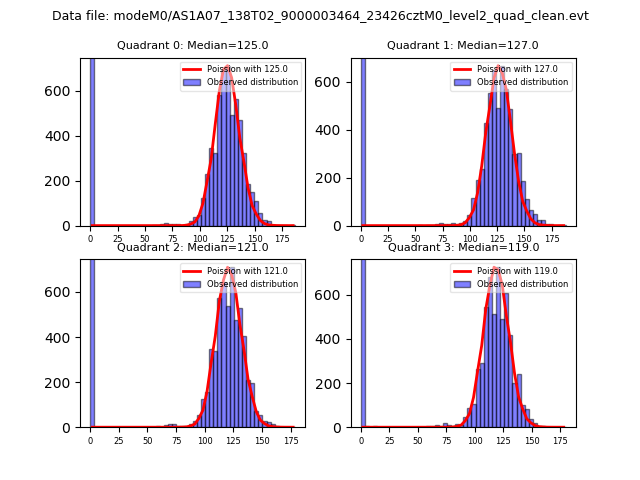 |
 |
| Quadrant-wise count rates Data is divided into 100 sec bins |
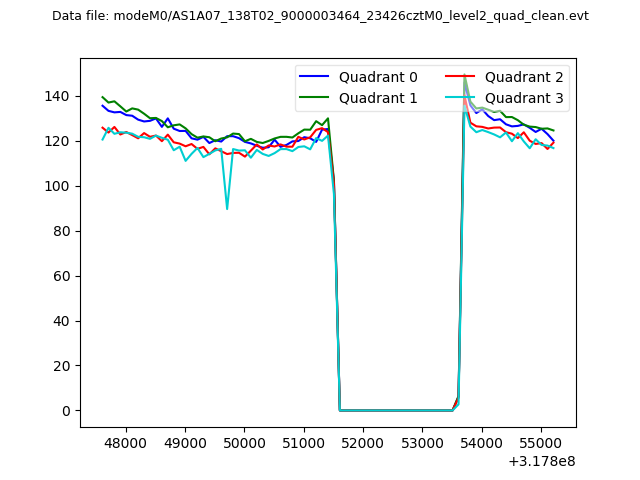 |
|
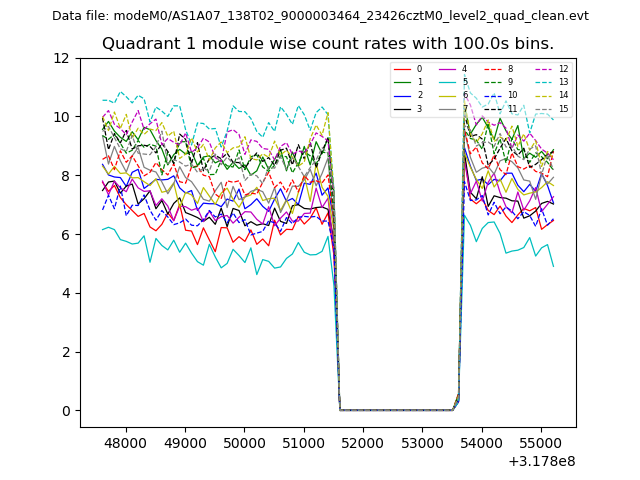
| Module-wise count rates for Quadrant A Data is divided into 100 sec bins |
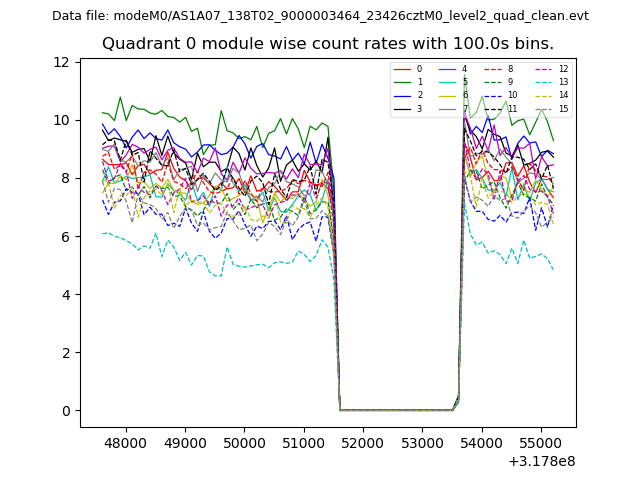 |
 |
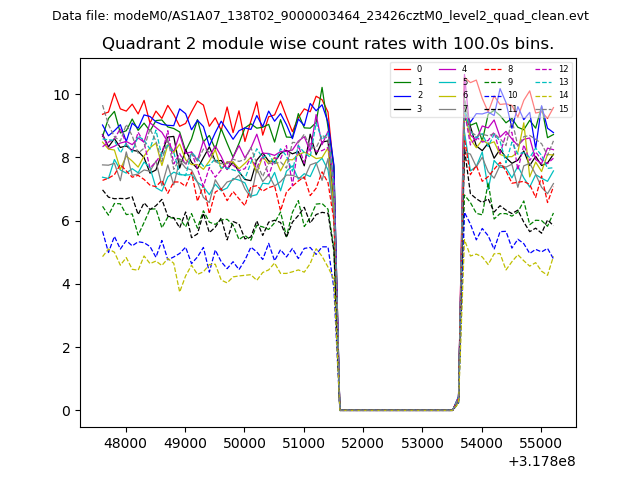
| Module-wise count rates for Quadrant B Data is divided into 100 sec bins |
 |
 |
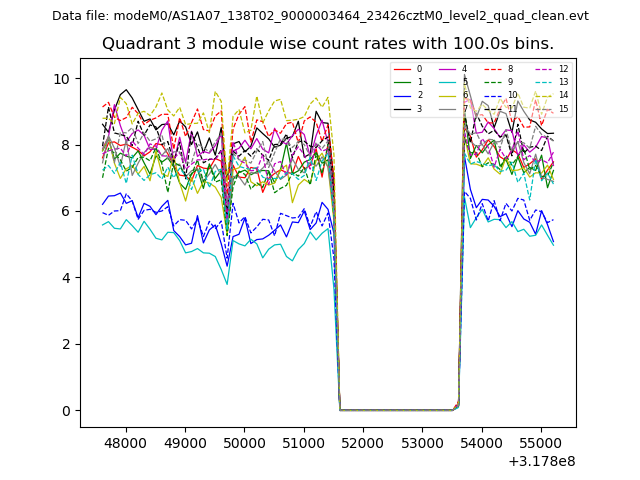
| Module-wise count rates for Quadrant C Data is divided into 100 sec bins |
 |
 |
| Module-wise count rates for Quadrant D Data is divided into 100 sec bins |
 |
 |
| Parameter | Plot |
|---|---|
| CZT HV Monitor | 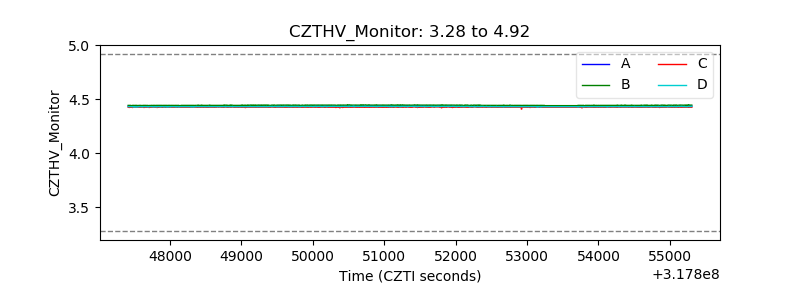 |
| D_VDD | 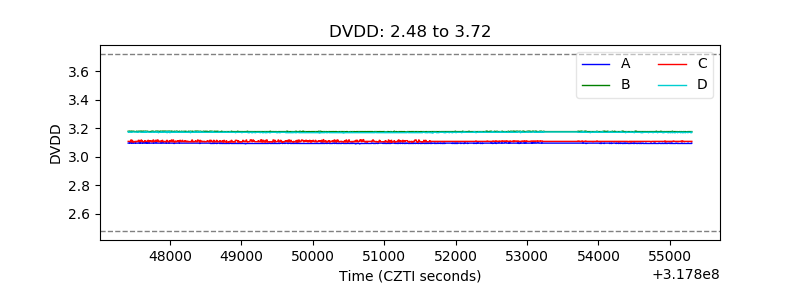 |
| Temperature 1 | 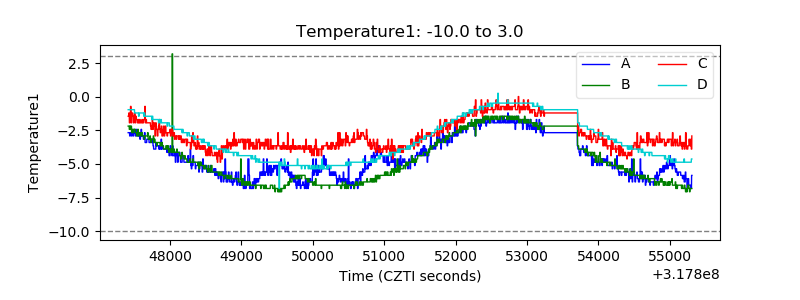 |
| Veto HV Monitor | 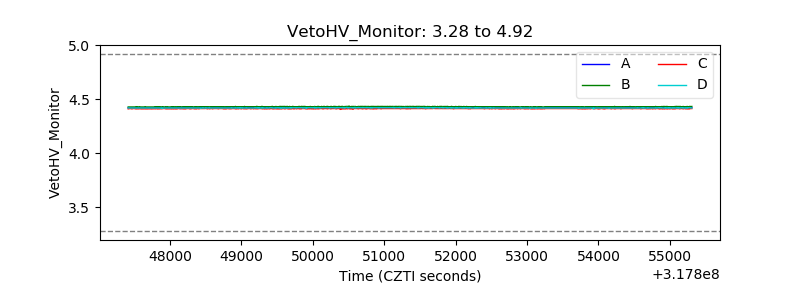 |
| Veto LLD | 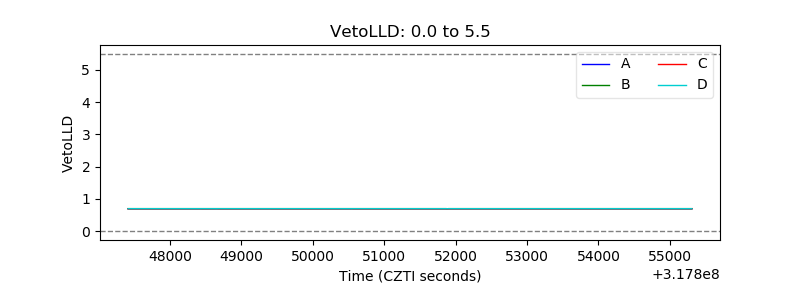 |
| Alpha Counter | 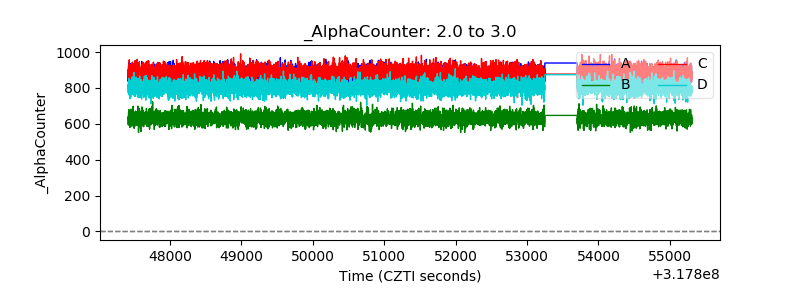 |
| _CPM_Rate | 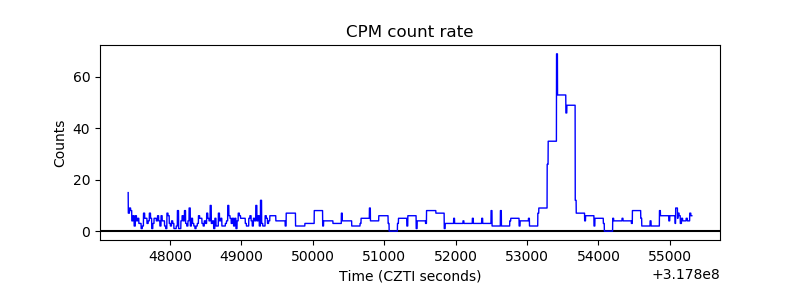 |
| CZT Counter | 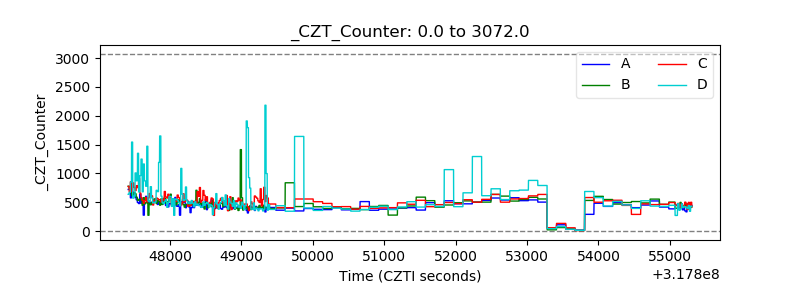 |
| +2.5 Volts monitor |  |
| +5 Volts monitor |  |
| _ROLL_ROT | 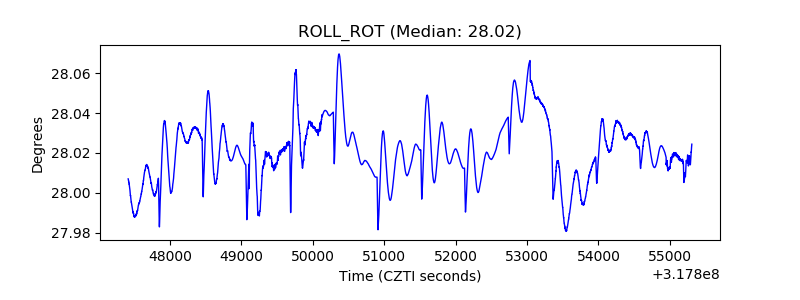 |
| _Roll_DEC | 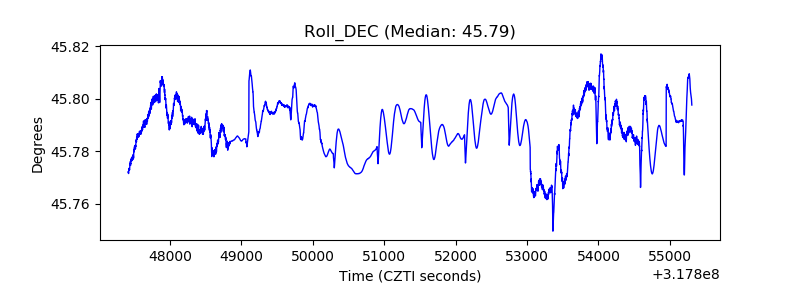 |
| _Roll_RA | 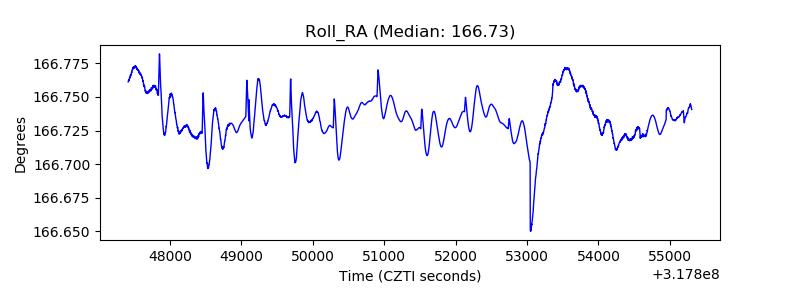 |
| Veto Counter | 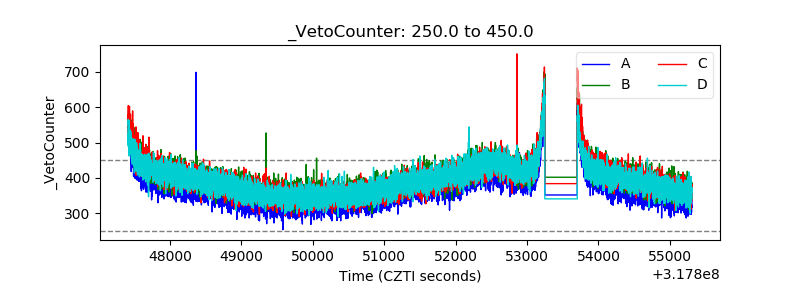 |