| Param | Original file | Final file |
|---|---|---|
| Filename | modeM0/AS1A07_138T04_9000003462cztM0_level2.fits | modeM0/AS1A07_138T04_9000003462cztM0_level2_quad_clean.evt |
| Size (bytes) | 148,069,440 | 121,040,640 |
| Size | 141.2 MB | 115.4 MB |
| Events in quadrant A | 925,650 | 698,286 |
| Events in quadrant B | 883,490 | 694,226 |
| Events in quadrant C | 889,856 | 658,072 |
| Events in quadrant D | 776,810 | 606,016 |
| Mode M0 | |||
|---|---|---|---|
| Quadrant | BADHDUFLAG | Total packets | Discarded packets |
| A | 0 | 30360 | 0 |
| B | 0 | 31295 | 0 |
| C | 0 | 30949 | 0 |
| D | 0 | 37012 | 0 |
| Mode SS | |||
|---|---|---|---|
| Quadrant | BADHDUFLAG | Total packets | Discarded packets |
| A | 0 | 300 | 0 |
| B | 0 | 300 | 0 |
| C | 0 | 300 | 0 |
| D | 0 | 300 | 0 |
| Mode M9 | |||
|---|---|---|---|
| Quadrant | BADHDUFLAG | Total packets | Discarded packets |
| A | 0 | 29 | 0 |
| B | 0 | 29 | 0 |
| C | 0 | 29 | 0 |
| D | 0 | 29 | 0 |
| Quadrant | Total seconds | Saturated seconds | Saturation percentage |
|---|---|---|---|
| A | 14600 | 339 | 2.321918% |
| B | 14600 | 382 | 2.616438% |
| C | 14600 | 415 | 2.842466% |
| D | 14600 | 767 | 5.253425% |
Noise dominated data is calculated using 1-second bins in cleaned event files. If a bin has >2000 counts, and if more than 50% of those come from <1% of pixels, then it is considered to be noise-dominated and hence unusable.
| Quadrant | # 1 sec bins | Bins with >0 counts | Bins with >2000 counts | High rate bins dominated by noise | Noise dominated (total time) | Noise dominated (detector-on time) | Marked lightcurve |
|---|---|---|---|---|---|---|---|
| A | 17520 | 14597 | 0 | 0 | 0.00% | 0.00% | 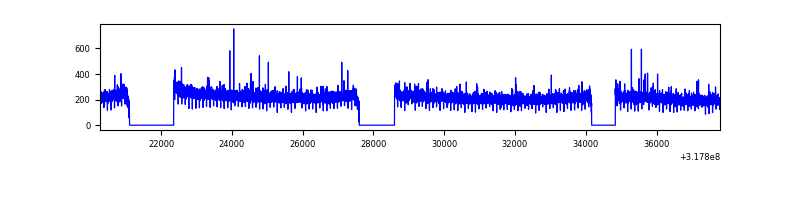 |
| B | 17520 | 14597 | 0 | 0 | 0.00% | 0.00% | 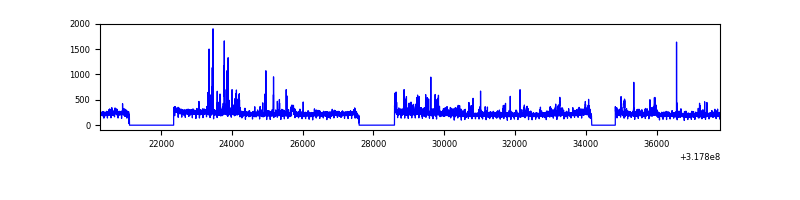 |
| C | 17520 | 14596 | 0 | 0 | 0.00% | 0.00% | 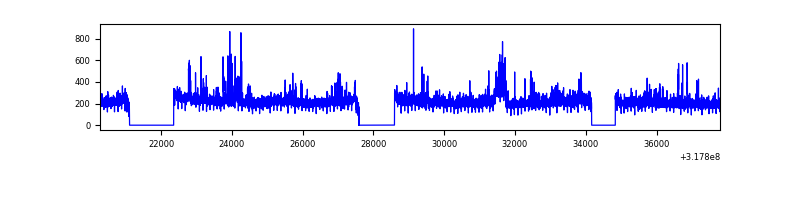 |
| D | 17520 | 14597 | 0 | 0 | 0.00% | 0.00% | 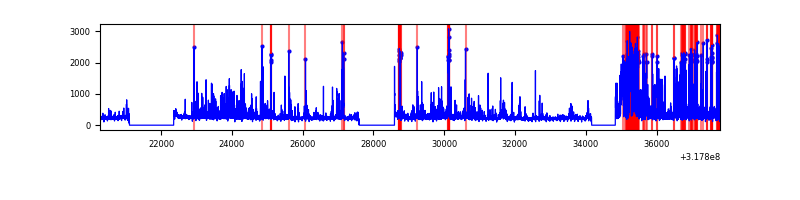 |
Top three noisy pixels from each quadrant. If the there are fewer than three noisy pixels in the level2.evt file, extra rows are filled as -1
| Pixel properties | Quadrant properties | ||||||
|---|---|---|---|---|---|---|---|
| Quadrant | DetID | PixID | Counts | Sigma | Mean | Median | Sigma |
| A | 0 | 29 | 934 | 11.58 | 241 | 227 | 61.1 |
| A | 7 | 110 | 738 | 8.37 | 241 | 227 | 61.1 |
| A | 0 | 30 | 720 | 8.07 | 241 | 227 | 61.1 |
| B | 2 | 9 | 720 | 10.54 | 234 | 224 | 47.1 |
| B | 5 | 255 | 602 | 8.03 | 234 | 224 | 47.1 |
| B | 3 | 80 | 584 | 7.65 | 234 | 224 | 47.1 |
| C | 1 | 81 | 692 | 7.77 | 235 | 220 | 60.7 |
| C | 1 | 80 | 677 | 7.52 | 235 | 220 | 60.7 |
| C | 12 | 241 | 630 | 6.75 | 235 | 220 | 60.7 |
| D | 6 | 67 | 588 | 6.4 | 222 | 203 | 60.1 |
| D | 15 | 46 | 571 | 6.12 | 222 | 203 | 60.1 |
| D | 3 | 14 | 561 | 5.95 | 222 | 203 | 60.1 |
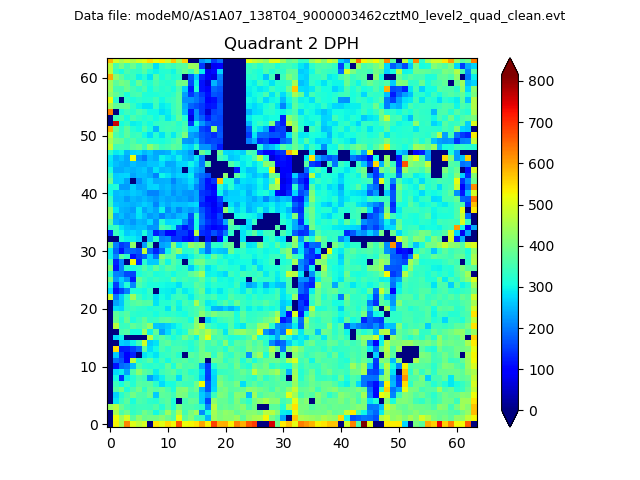
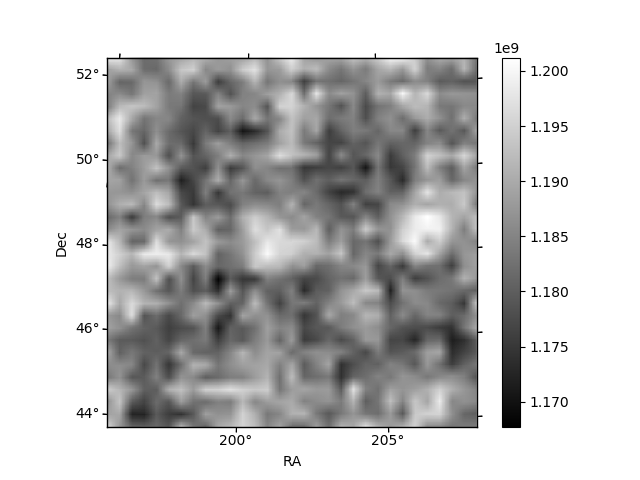
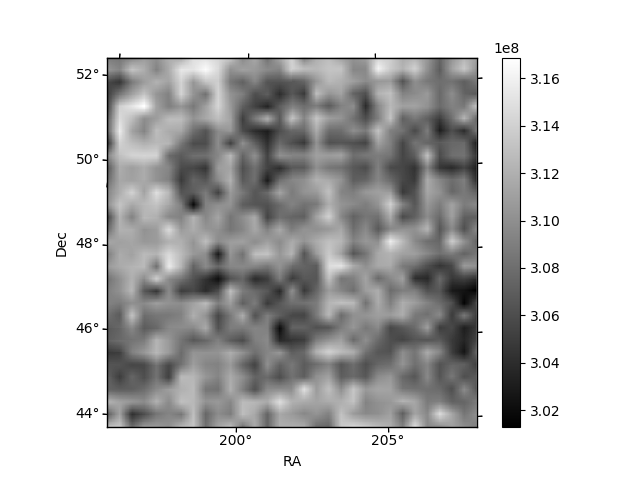
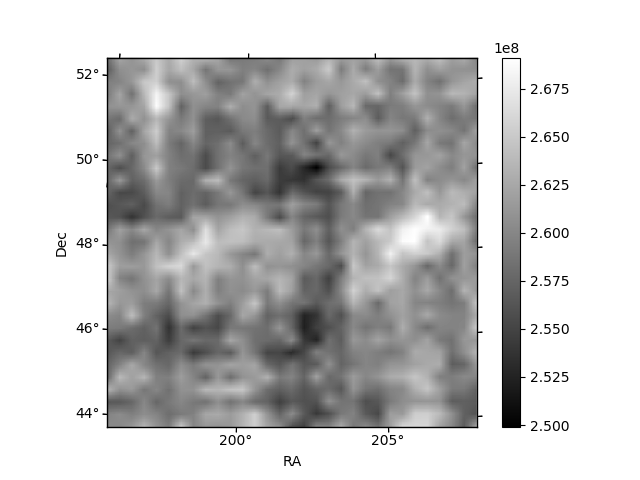
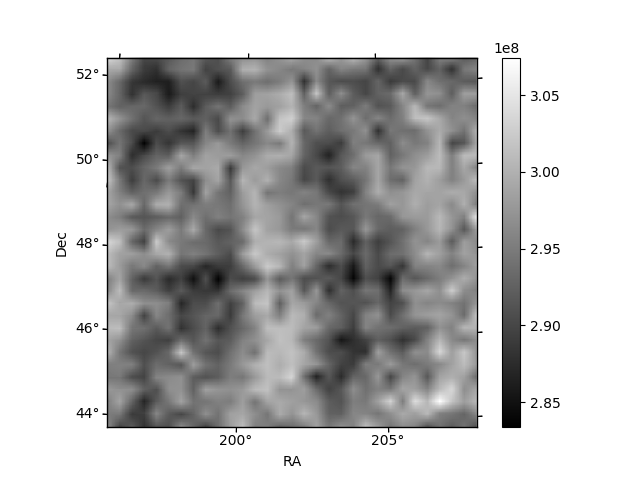
Histogram calculated using DETX and DETY for each event in the final _common_clean file
| Quadrant A | 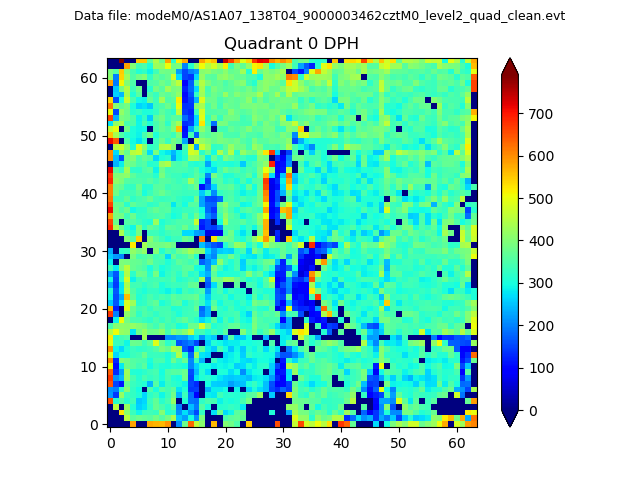 |
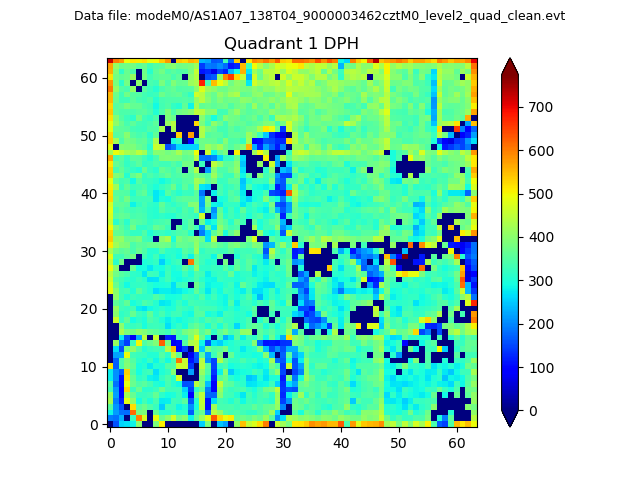 |
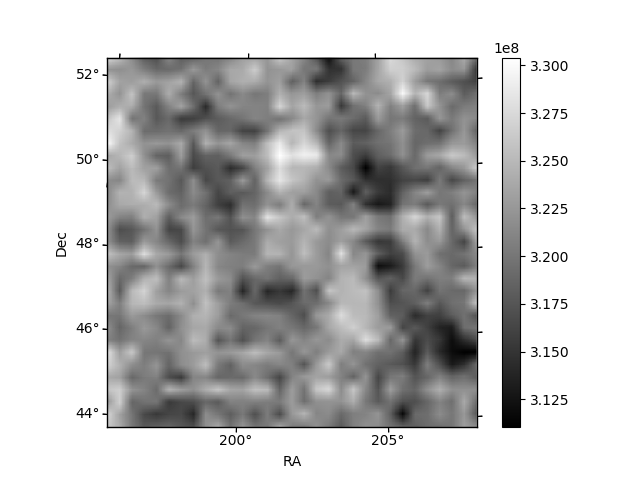
Quadrant B |
|---|---|---|---|
| Quadrant D | 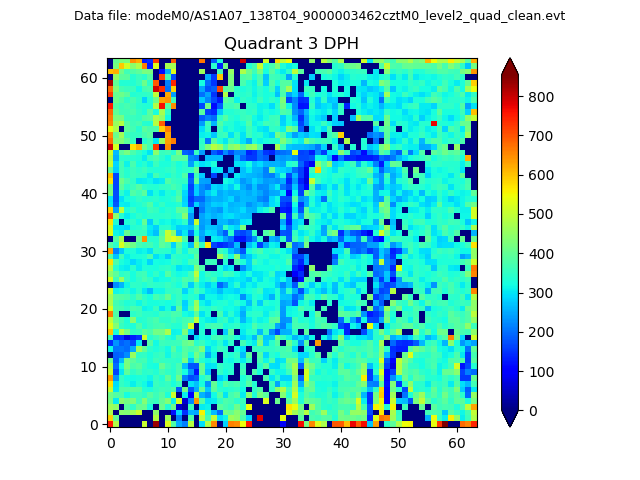 |
 |
Quadrant C |
| Plot type | Count rate plots | Images |
|---|---|---|
| Comparison with Poisson distribution Blue bars denote a histogram of data divided into 1 sec bins. Red curve is a Poisson curve with rate = median count rate of data. |
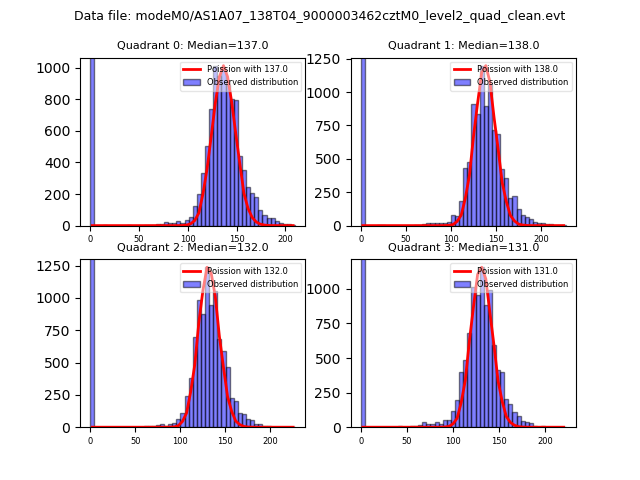 |
 |
| Quadrant-wise count rates Data is divided into 100 sec bins |
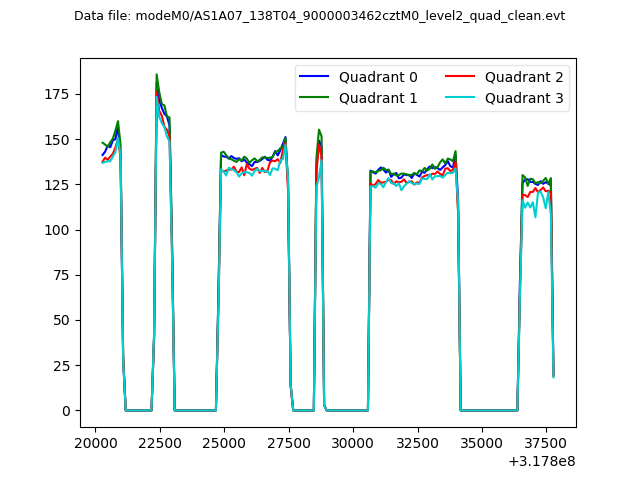 |
|
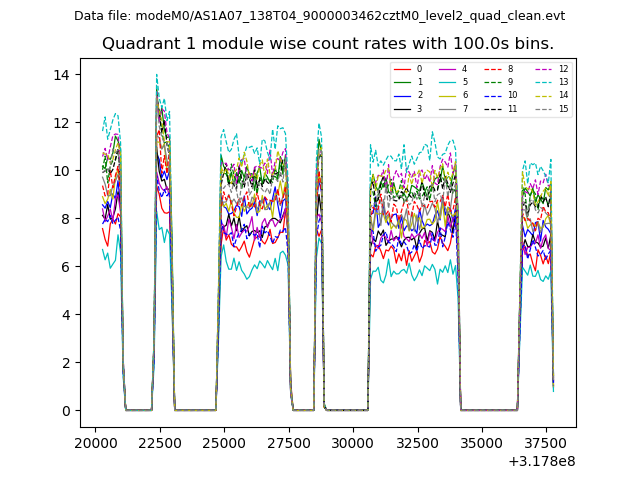
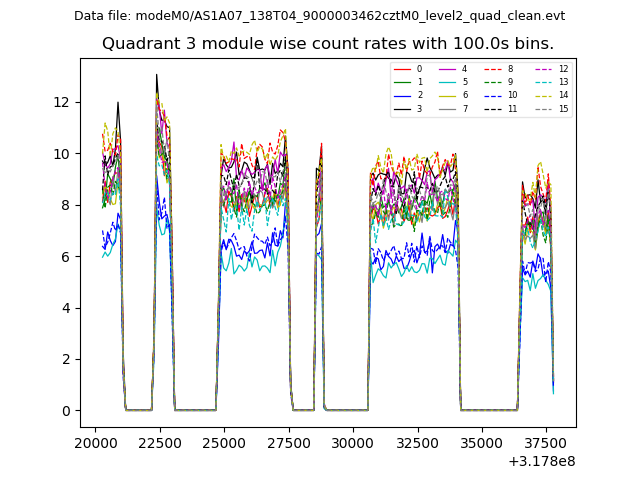
| Module-wise count rates for Quadrant A Data is divided into 100 sec bins |
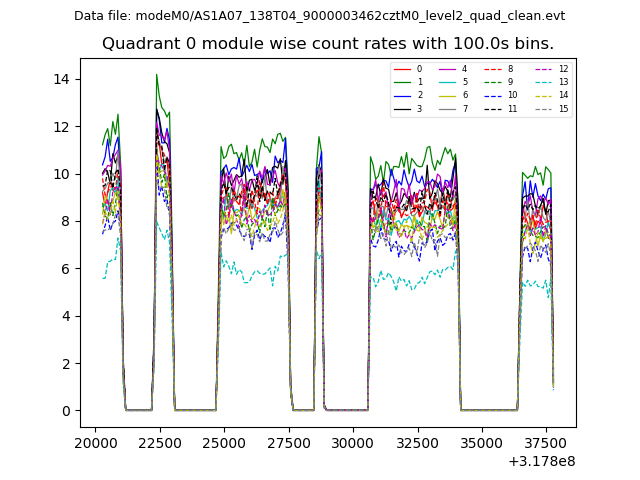 |
 |
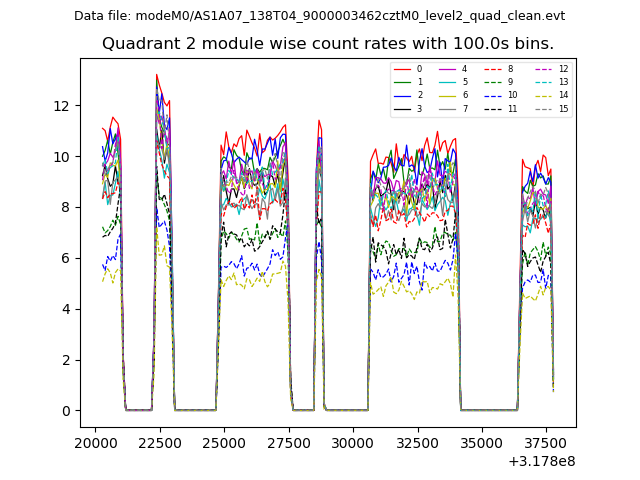
| Module-wise count rates for Quadrant B Data is divided into 100 sec bins |
 |
 |
| Module-wise count rates for Quadrant C Data is divided into 100 sec bins |
 |
 |
| Module-wise count rates for Quadrant D Data is divided into 100 sec bins |
 |
 |
| Parameter | Plot |
|---|---|
| CZT HV Monitor | 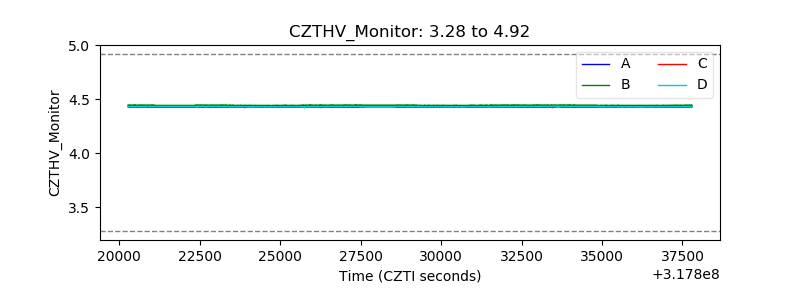 |
| D_VDD | 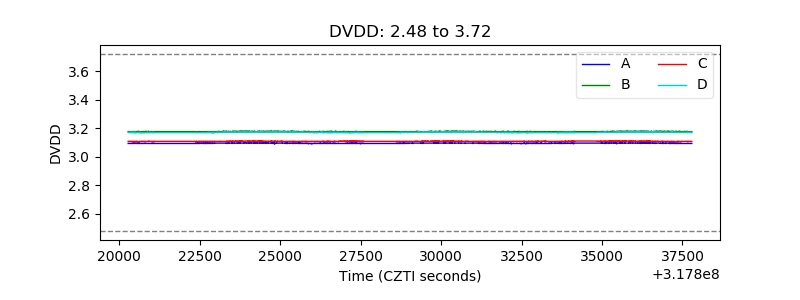 |
| Temperature 1 | 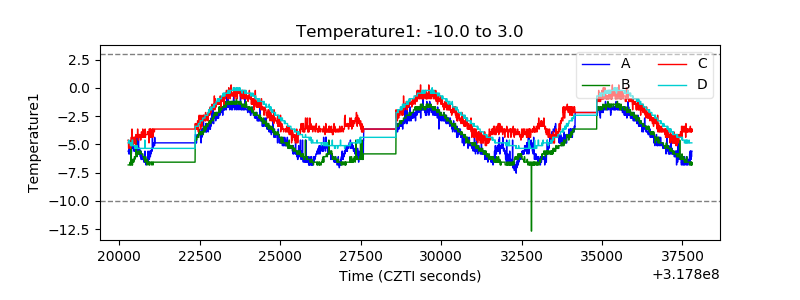 |
| Veto HV Monitor | 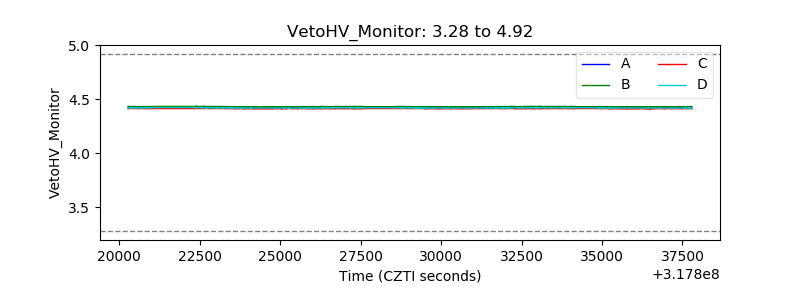 |
| Veto LLD | 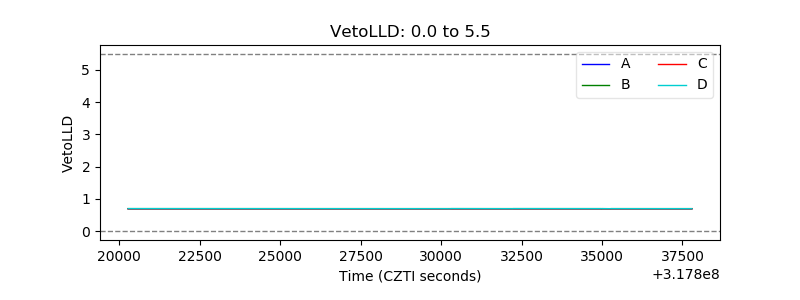 |
| Alpha Counter | 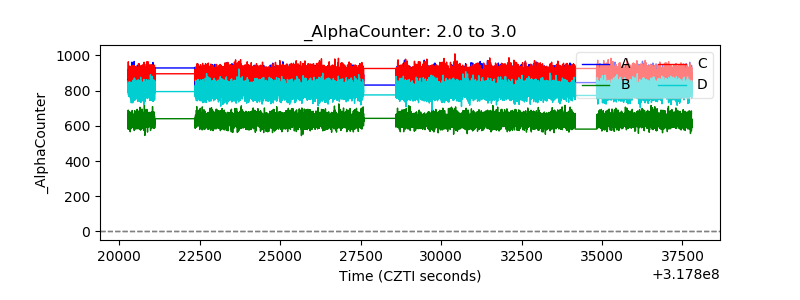 |
| _CPM_Rate | 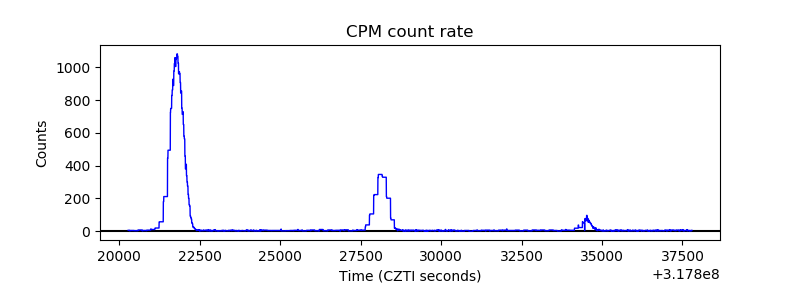 |
| CZT Counter | 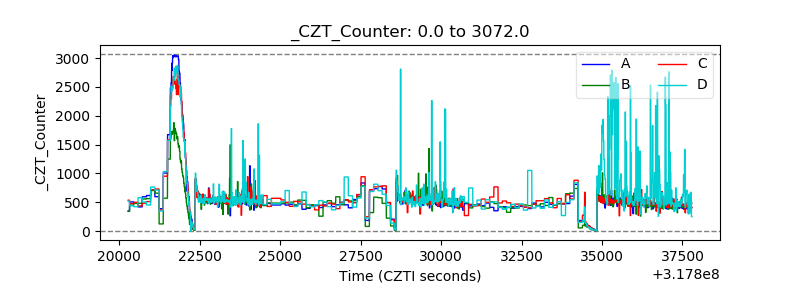 |
| +2.5 Volts monitor | 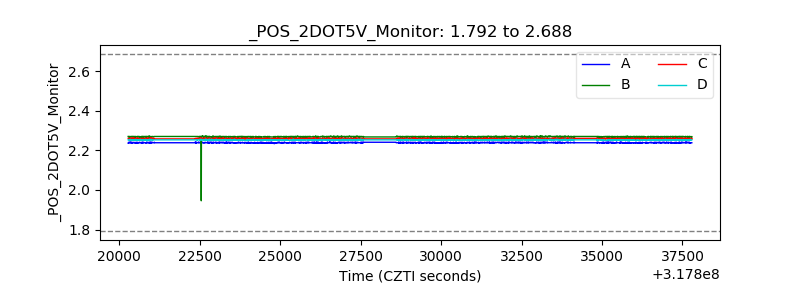 |
| +5 Volts monitor | 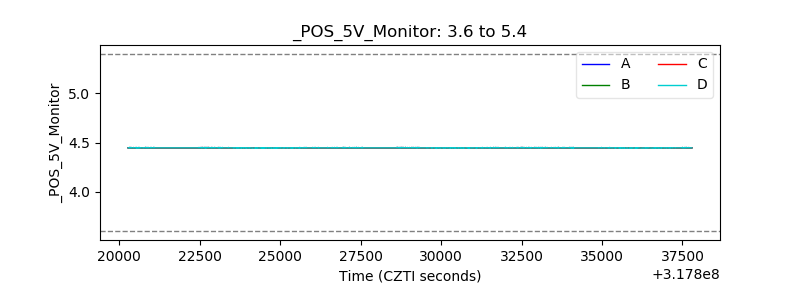 |
| _ROLL_ROT | 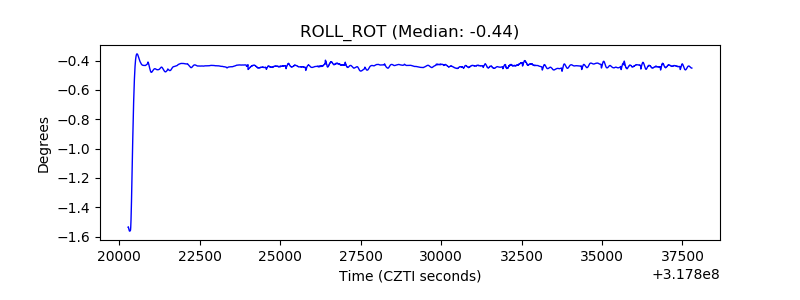 |
| _Roll_DEC | 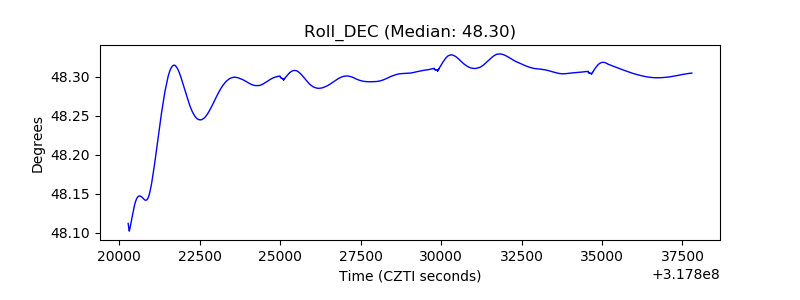 |
| _Roll_RA | 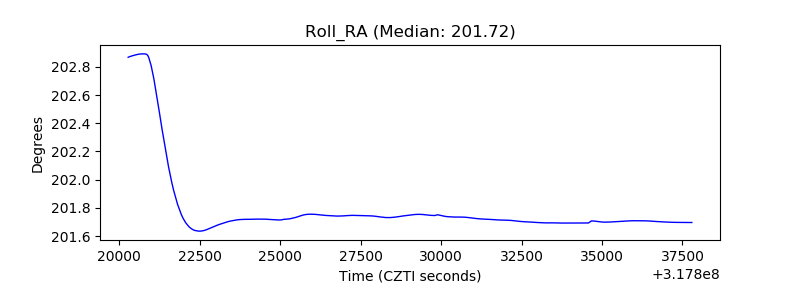 |
| Veto Counter | 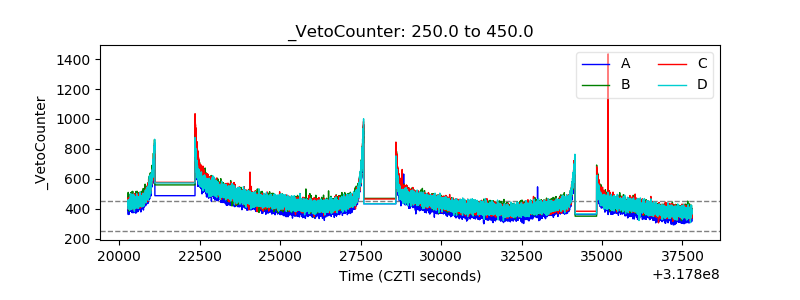 |