| Param | Original file | Final file |
|---|---|---|
| Filename | modeM0/AS1A07_138T04_9000003462_23421cztM0_level2.evt | modeM0/AS1A07_138T04_9000003462_23421cztM0_level2_quad_clean.evt |
| Size (bytes) | 185,621,760 | 36,299,520 |
| Size | 177.0 MB | 34.6 MB |
| Events in quadrant A | 1,323,753 | 234,262 |
| Events in quadrant B | 1,391,707 | 239,956 |
| Events in quadrant C | 1,342,741 | 225,855 |
| Events in quadrant D | 1,395,943 | 223,879 |
| Mode M0 | |||
|---|---|---|---|
| Quadrant | BADHDUFLAG | Total packets | Discarded packets |
| A | 0 | 5314 | 1 |
| B | 0 | 5536 | 1 |
| C | 0 | 5387 | 1 |
| D | 0 | 5603 | 1 |
| Mode SS | |||
|---|---|---|---|
| Quadrant | BADHDUFLAG | Total packets | Discarded packets |
| A | 0 | 52 | 0 |
| B | 0 | 52 | 0 |
| C | 0 | 52 | 0 |
| D | 0 | 52 | 0 |
| Mode M9 | |||
|---|---|---|---|
| Quadrant | BADHDUFLAG | Total packets | Discarded packets |
| A | 0 | 12 | 0 |
| B | 0 | 12 | 0 |
| C | 0 | 12 | 0 |
| D | 0 | 12 | 0 |
| Quadrant | Total seconds | Saturated seconds | Saturation percentage |
|---|---|---|---|
| A | 2426 | 134 | 5.523495% |
| B | 2426 | 140 | 5.770816% |
| C | 2426 | 130 | 5.358615% |
| D | 2426 | 112 | 4.616653% |
Noise dominated data is calculated using 1-second bins in cleaned event files. If a bin has >2000 counts, and if more than 50% of those come from <1% of pixels, then it is considered to be noise-dominated and hence unusable.
| Quadrant | # 1 sec bins | Bins with >0 counts | Bins with >2000 counts | High rate bins dominated by noise | Noise dominated (total time) | Noise dominated (detector-on time) | Marked lightcurve |
|---|---|---|---|---|---|---|---|
| A | 3676 | 2426 | 0 | 0 | 0.00% | 0.00% | 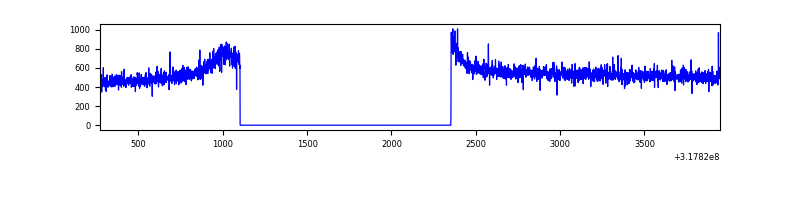 |
| B | 3676 | 2426 | 7 | 7 | 0.19% | 0.29% | 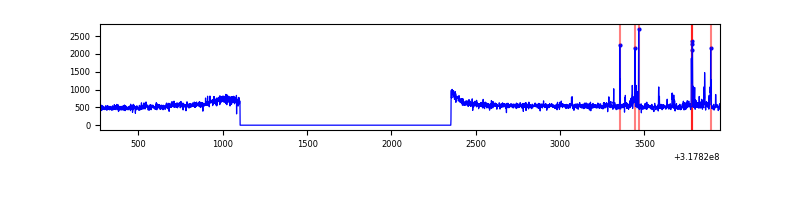 |
| C | 3676 | 2426 | 0 | 0 | 0.00% | 0.00% | 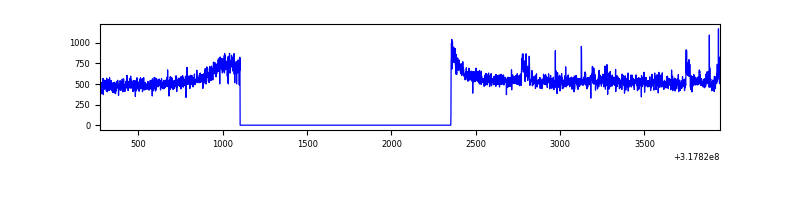 |
| D | 3676 | 2426 | 5 | 5 | 0.14% | 0.21% | 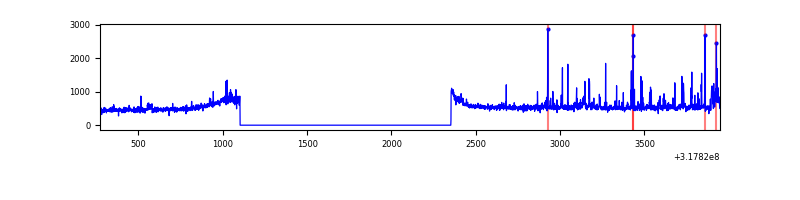 |
Top three noisy pixels from each quadrant. If the there are fewer than three noisy pixels in the level2.evt file, extra rows are filled as -1
| Pixel properties | Quadrant properties | ||||||
|---|---|---|---|---|---|---|---|
| Quadrant | DetID | PixID | Counts | Sigma | Mean | Median | Sigma |
| A | 13 | 254 | 3564 | 46.01 | 343 | 335 | 70.2 |
| A | 0 | 226 | 2976 | 37.63 | 343 | 335 | 70.2 |
| A | 3 | 137 | 2886 | 36.35 | 343 | 335 | 70.2 |
| B | 0 | 189 | 56576 | 864.85 | 336 | 328 | 65.0 |
| B | 12 | 111 | 7557 | 111.15 | 336 | 328 | 65.0 |
| B | 11 | 111 | 6718 | 98.25 | 336 | 328 | 65.0 |
| C | 14 | 238 | 51926 | 694.48 | 321 | 322 | 74.3 |
| C | 10 | 9 | 33985 | 453.03 | 321 | 322 | 74.3 |
| C | 7 | 247 | 3191 | 38.61 | 321 | 322 | 74.3 |
| D | 1 | 52 | 110832 | 1350.89 | 331 | 321 | 81.8 |
| D | 12 | 233 | 15963 | 191.21 | 331 | 321 | 81.8 |
| D | 2 | 234 | 10016 | 118.51 | 331 | 321 | 81.8 |
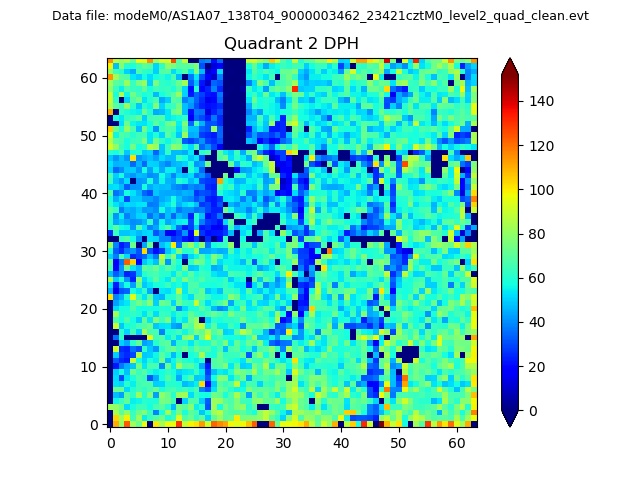
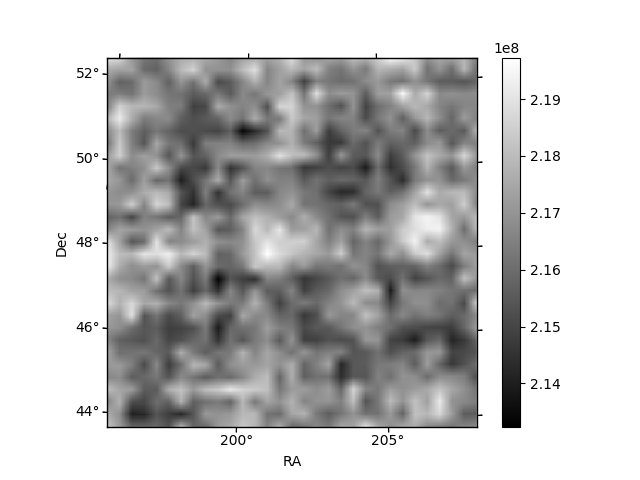
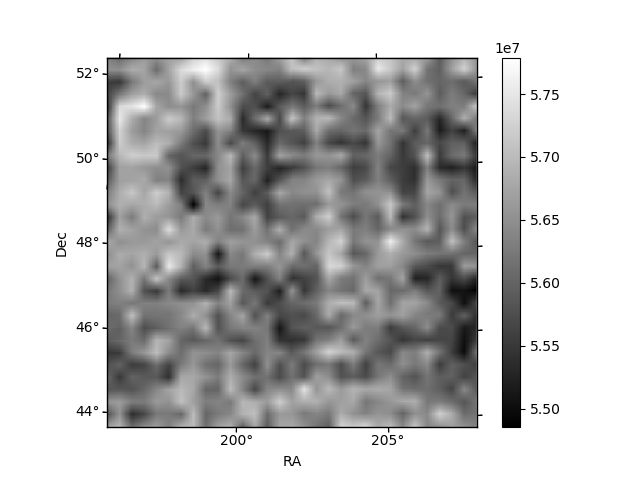
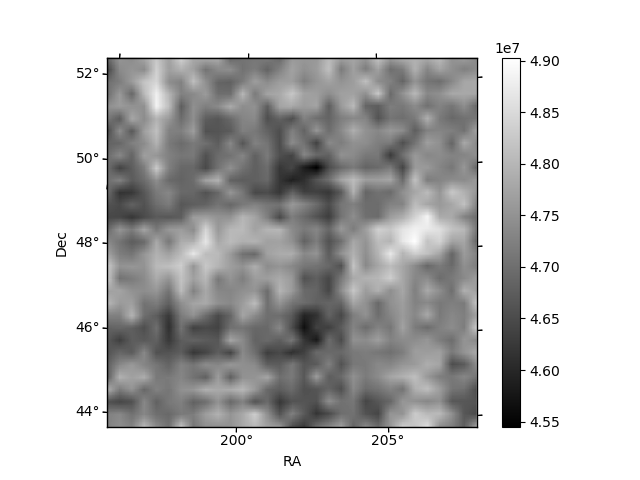
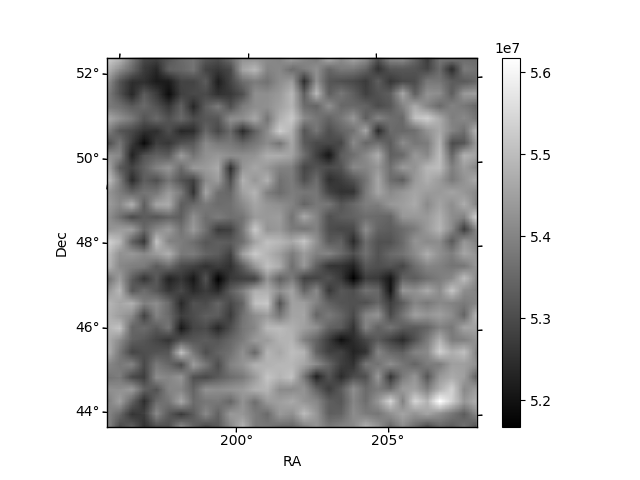
Histogram calculated using DETX and DETY for each event in the final _common_clean file
| Quadrant A | 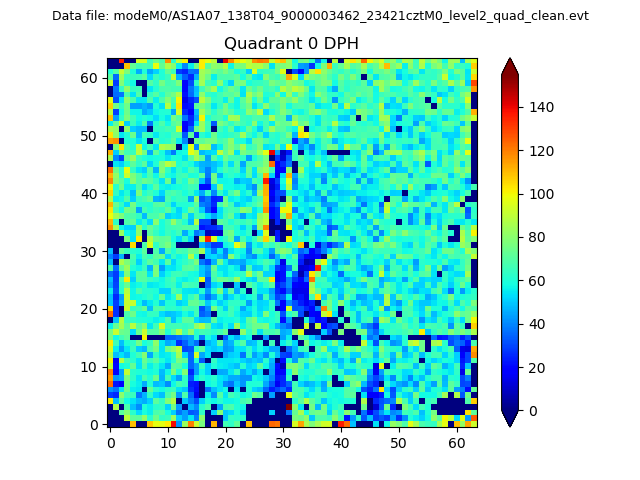 |
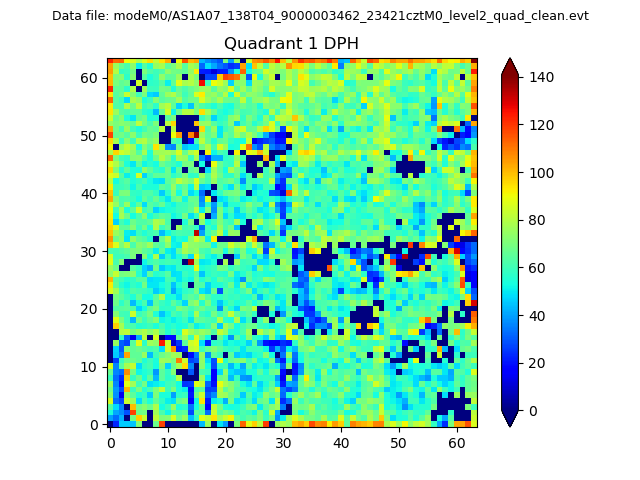 |
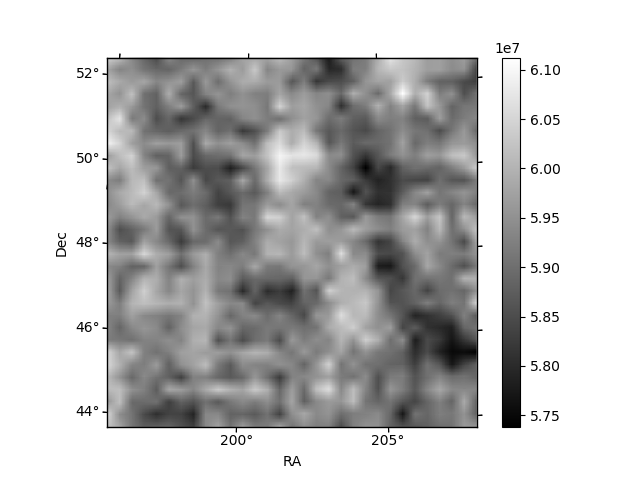
Quadrant B |
|---|---|---|---|
| Quadrant D | 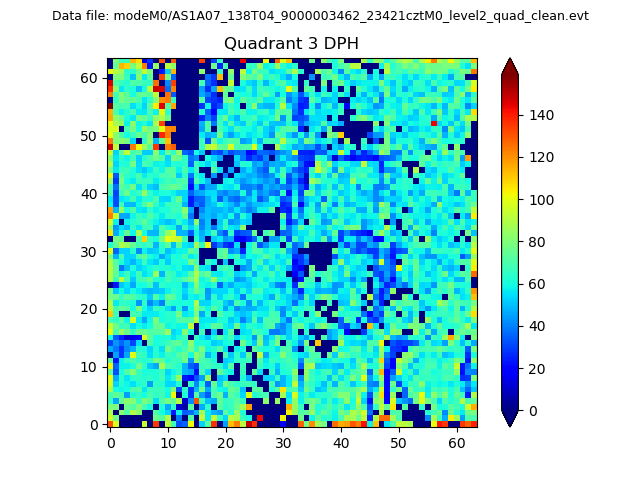 |
 |
Quadrant C |
| Plot type | Count rate plots | Images |
|---|---|---|
| Comparison with Poisson distribution Blue bars denote a histogram of data divided into 1 sec bins. Red curve is a Poisson curve with rate = median count rate of data. |
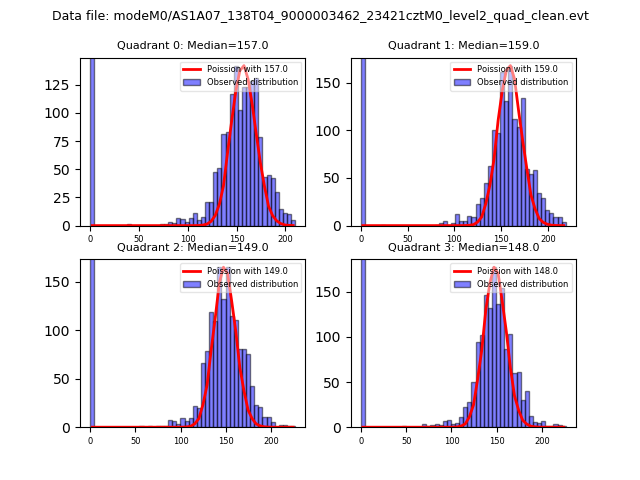 |
 |
| Quadrant-wise count rates Data is divided into 100 sec bins |
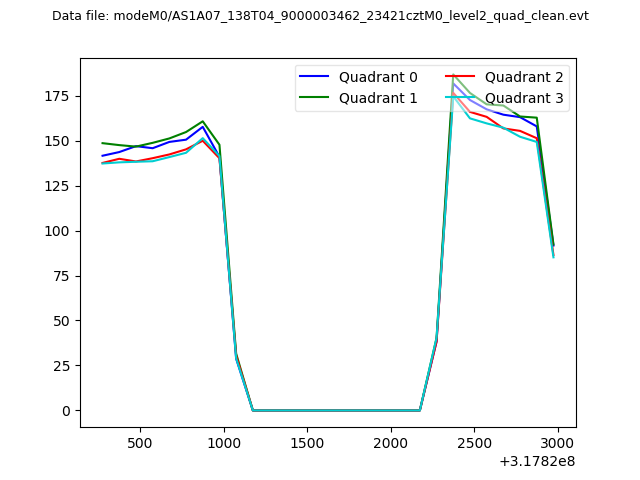 |
|
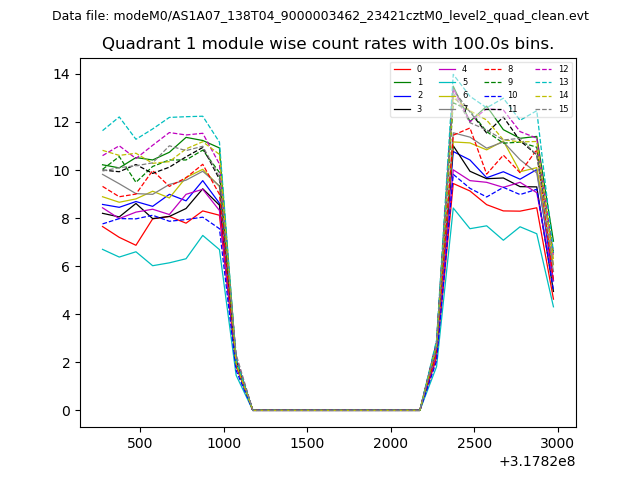
| Module-wise count rates for Quadrant A Data is divided into 100 sec bins |
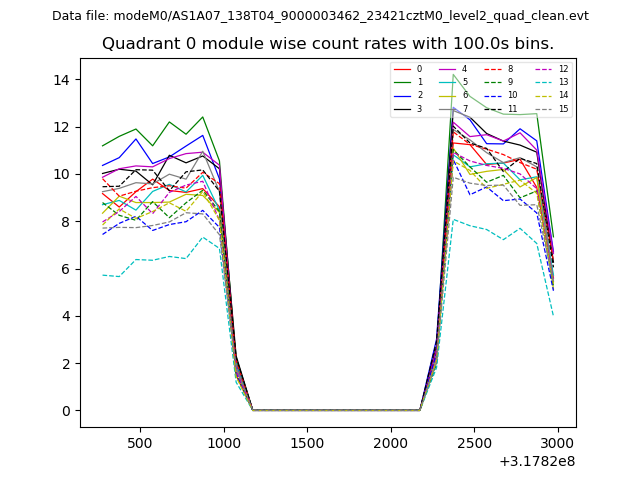 |
 |
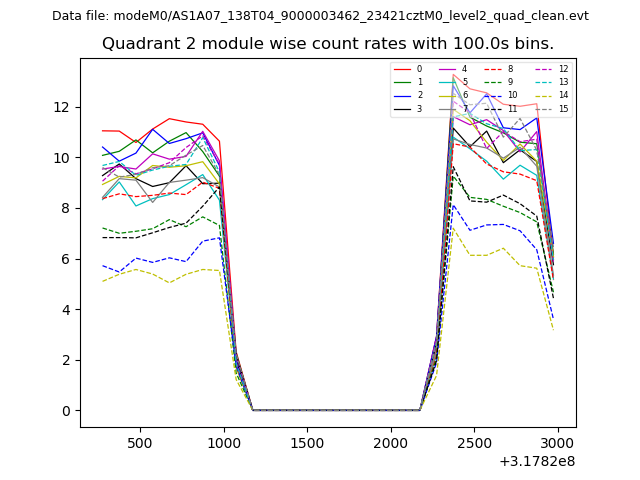
| Module-wise count rates for Quadrant B Data is divided into 100 sec bins |
 |
 |
| Module-wise count rates for Quadrant C Data is divided into 100 sec bins |
 |
 |
| Module-wise count rates for Quadrant D Data is divided into 100 sec bins |
 |
 |
| Parameter | Plot |
|---|---|
| CZT HV Monitor | 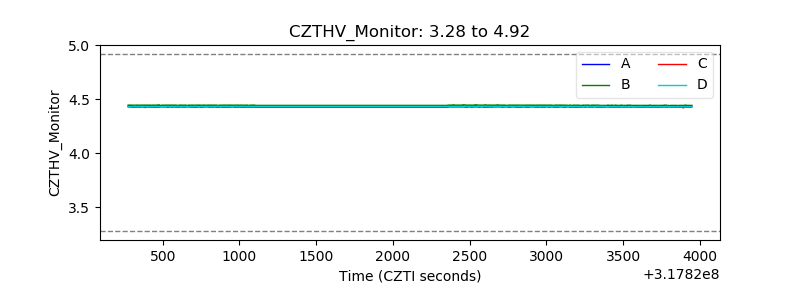 |
| D_VDD | 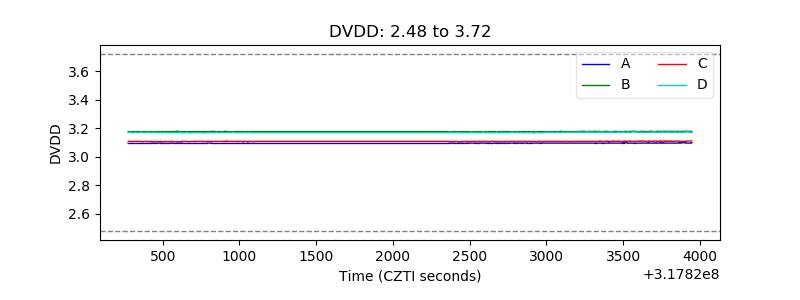 |
| Temperature 1 | 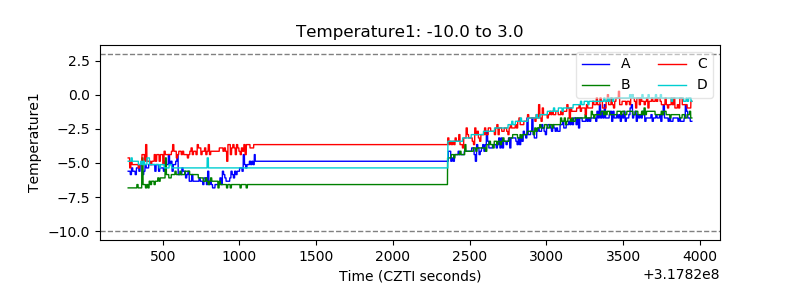 |
| Veto HV Monitor | 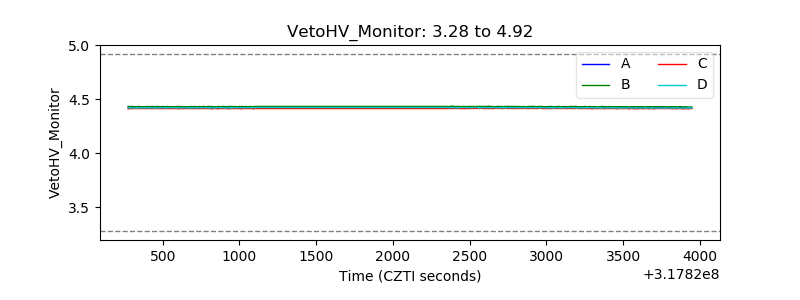 |
| Veto LLD | 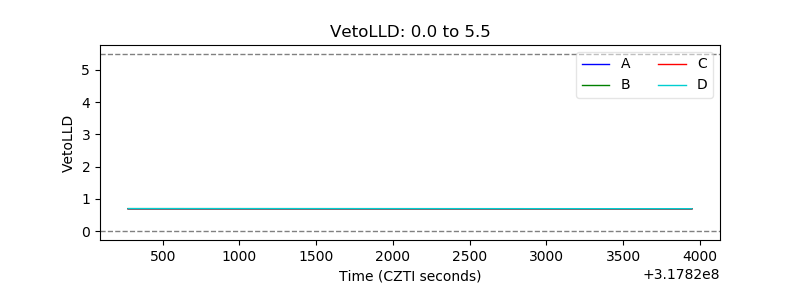 |
| Alpha Counter | 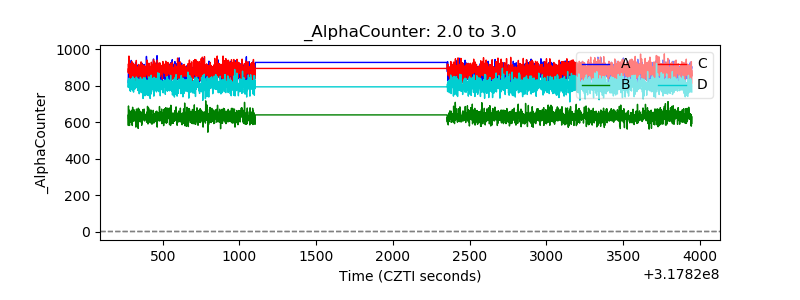 |
| _CPM_Rate | 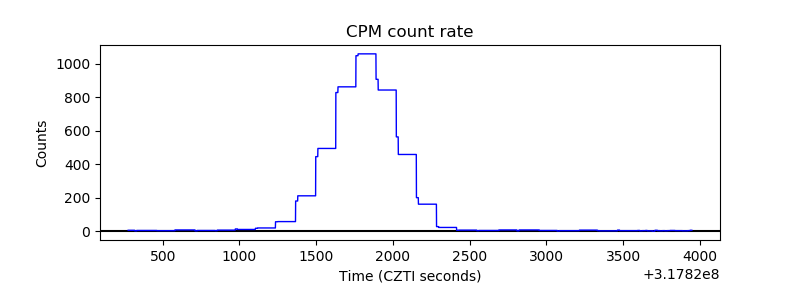 |
| CZT Counter | 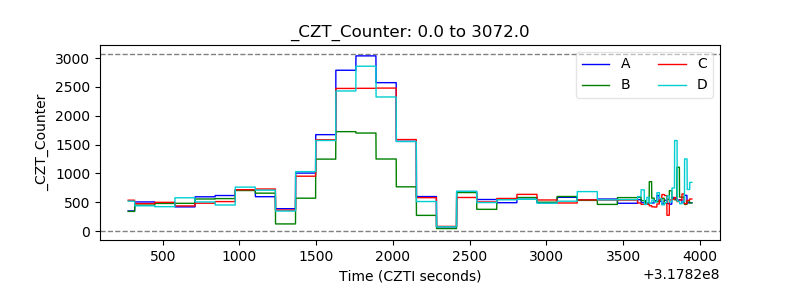 |
| +2.5 Volts monitor |  |
| +5 Volts monitor |  |
| _ROLL_ROT | 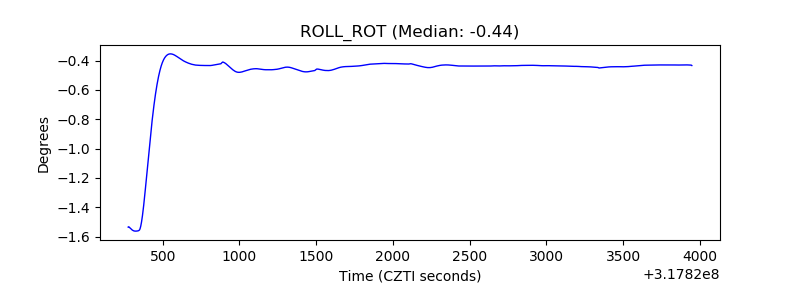 |
| _Roll_DEC | 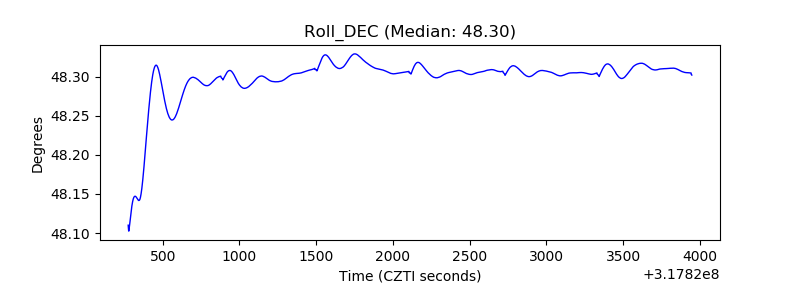 |
| _Roll_RA | 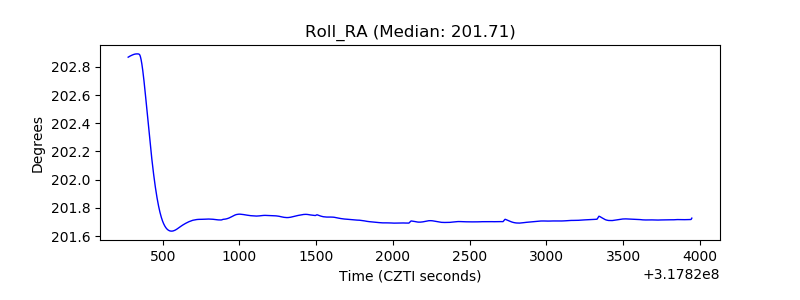 |
| Veto Counter |  |