| Param | Original file | Final file |
|---|---|---|
| Filename | modeM0/AS1A07_138T04_9000003462_23422cztM0_level2.evt | modeM0/AS1A07_138T04_9000003462_23422cztM0_level2_quad_clean.evt |
| Size (bytes) | 503,527,680 | 85,875,840 |
| Size | 480.2 MB | 81.9 MB |
| Events in quadrant A | 3,470,715 | 541,124 |
| Events in quadrant B | 3,678,943 | 546,706 |
| Events in quadrant C | 3,588,119 | 521,904 |
| Events in quadrant D | 4,046,739 | 513,269 |
| Mode M0 | |||
|---|---|---|---|
| Quadrant | BADHDUFLAG | Total packets | Discarded packets |
| A | 0 | 14329 | 2 |
| B | 0 | 14959 | 2 |
| C | 0 | 14614 | 2 |
| D | 0 | 16221 | 2 |
| Mode SS | |||
|---|---|---|---|
| Quadrant | BADHDUFLAG | Total packets | Discarded packets |
| A | 0 | 140 | 0 |
| B | 0 | 140 | 0 |
| C | 0 | 140 | 0 |
| D | 0 | 140 | 0 |
| Mode M9 | |||
|---|---|---|---|
| Quadrant | BADHDUFLAG | Total packets | Discarded packets |
| A | 0 | 11 | 0 |
| B | 0 | 12 | 0 |
| C | 0 | 12 | 0 |
| D | 0 | 12 | 0 |
| Quadrant | Total seconds | Saturated seconds | Saturation percentage |
|---|---|---|---|
| A | 6843 | 150 | 2.192021% |
| B | 6843 | 170 | 2.484291% |
| C | 6843 | 184 | 2.688879% |
| D | 6842 | 216 | 3.156972% |
Noise dominated data is calculated using 1-second bins in cleaned event files. If a bin has >2000 counts, and if more than 50% of those come from <1% of pixels, then it is considered to be noise-dominated and hence unusable.
| Quadrant | # 1 sec bins | Bins with >0 counts | Bins with >2000 counts | High rate bins dominated by noise | Noise dominated (total time) | Noise dominated (detector-on time) | Marked lightcurve |
|---|---|---|---|---|---|---|---|
| A | 7843 | 6843 | 0 | 0 | 0.00% | 0.00% | 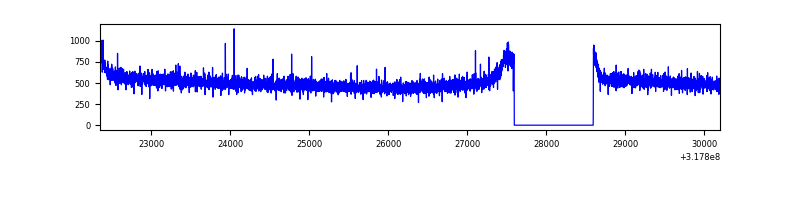 |
| B | 7843 | 6843 | 7 | 7 | 0.09% | 0.10% | 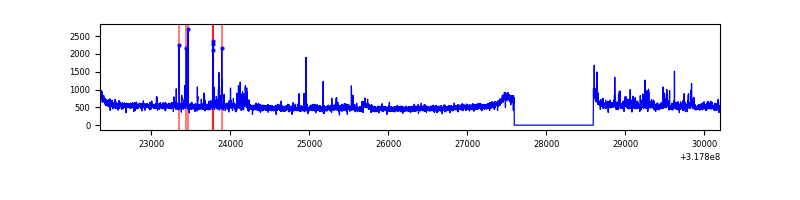 |
| C | 7843 | 6843 | 0 | 0 | 0.00% | 0.00% | 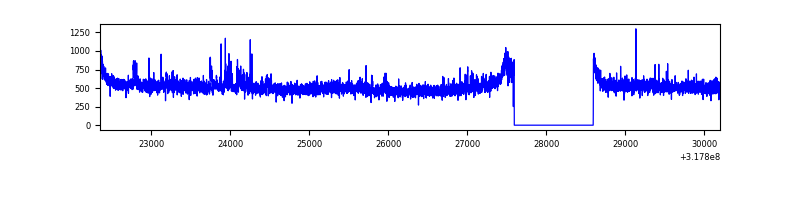 |
| D | 7842 | 6842 | 84 | 84 | 1.07% | 1.23% | 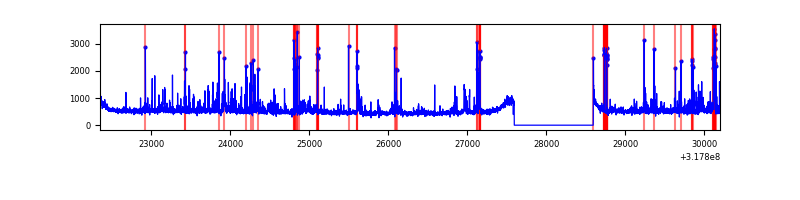 |
Top three noisy pixels from each quadrant. If the there are fewer than three noisy pixels in the level2.evt file, extra rows are filled as -1
| Pixel properties | Quadrant properties | ||||||
|---|---|---|---|---|---|---|---|
| Quadrant | DetID | PixID | Counts | Sigma | Mean | Median | Sigma |
| A | 13 | 254 | 10039 | 51.1 | 900 | 880 | 179.2 |
| A | 0 | 226 | 7750 | 38.33 | 900 | 880 | 179.2 |
| A | 3 | 137 | 7501 | 36.94 | 900 | 880 | 179.2 |
| B | 0 | 189 | 114986 | 683.2 | 887 | 866 | 167.0 |
| B | 0 | 190 | 37199 | 217.51 | 887 | 866 | 167.0 |
| B | 15 | 33 | 23125 | 133.25 | 887 | 866 | 167.0 |
| C | 14 | 238 | 137877 | 703.27 | 850 | 856 | 194.8 |
| C | 10 | 9 | 128423 | 654.75 | 850 | 856 | 194.8 |
| C | 13 | 61 | 5985 | 26.32 | 850 | 856 | 194.8 |
| D | 1 | 52 | 446780 | 2120.35 | 870 | 844 | 210.3 |
| D | 12 | 233 | 69551 | 326.69 | 870 | 844 | 210.3 |
| D | 7 | 38 | 57057 | 267.28 | 870 | 844 | 210.3 |
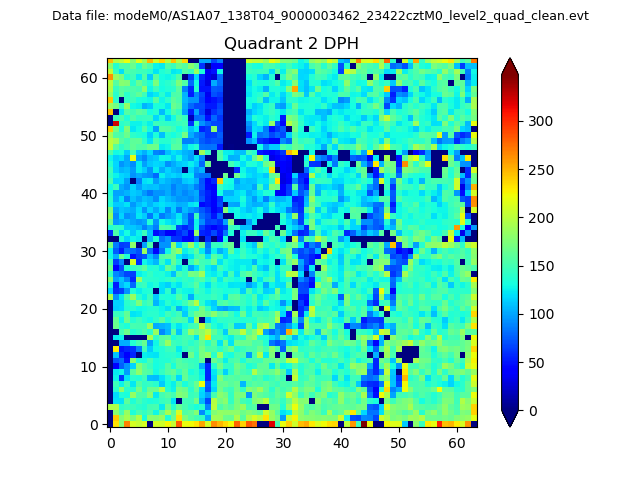
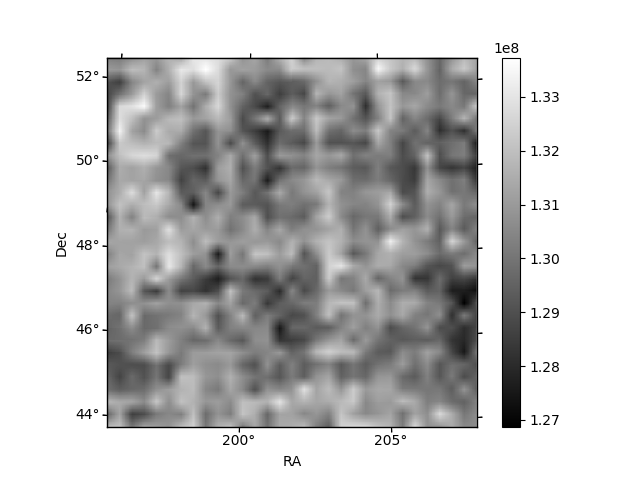
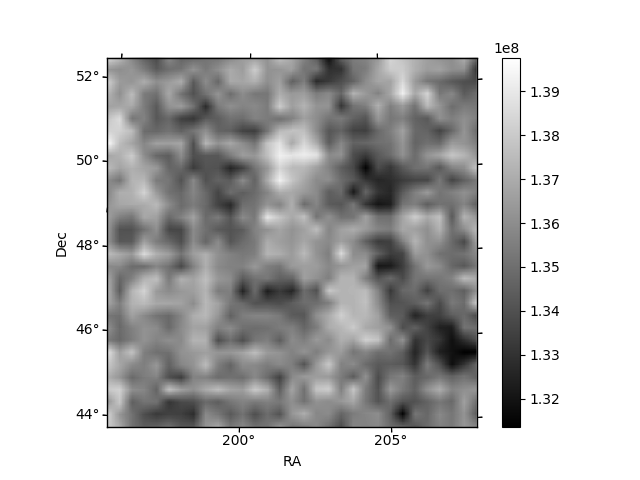
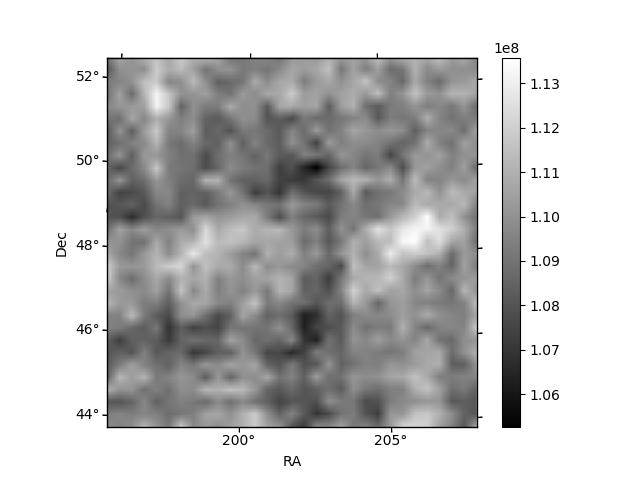
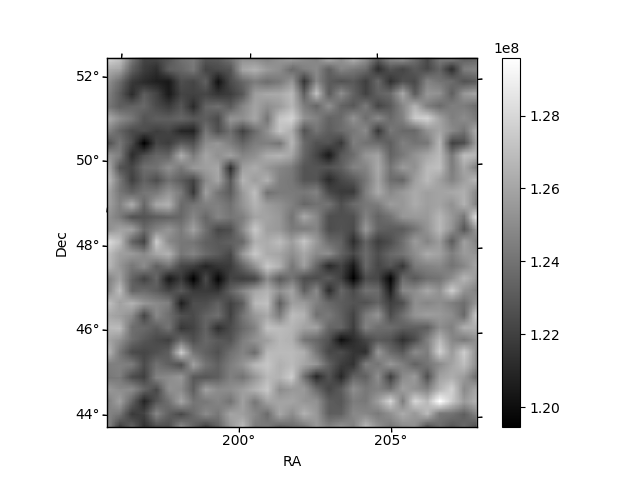
Histogram calculated using DETX and DETY for each event in the final _common_clean file
| Quadrant A | 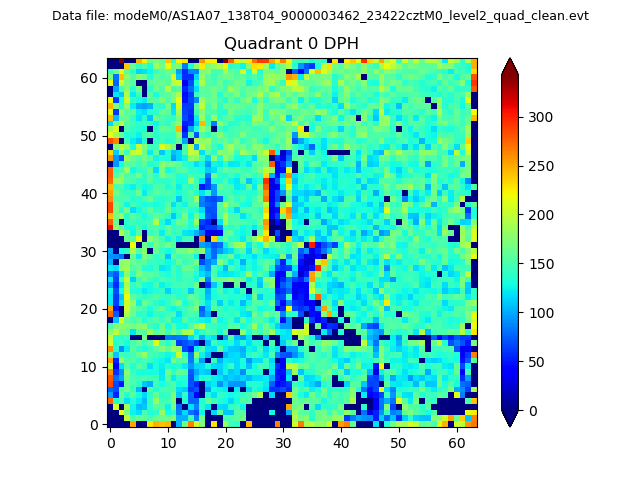 |
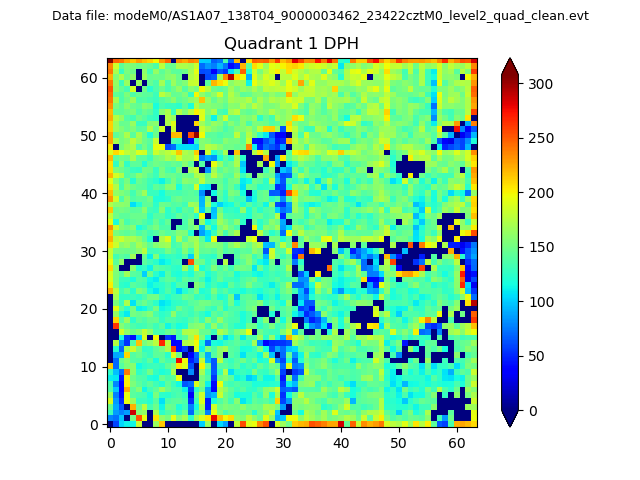 |
Quadrant B |
|---|---|---|---|
| Quadrant D | 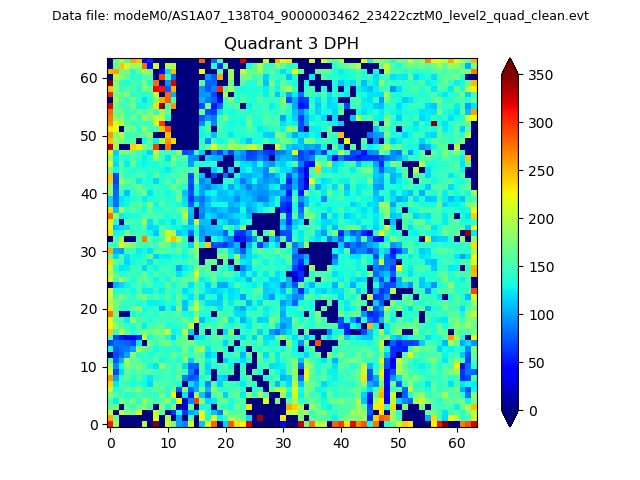 |
 |
Quadrant C |
| Plot type | Count rate plots | Images |
|---|---|---|
| Comparison with Poisson distribution Blue bars denote a histogram of data divided into 1 sec bins. Red curve is a Poisson curve with rate = median count rate of data. |
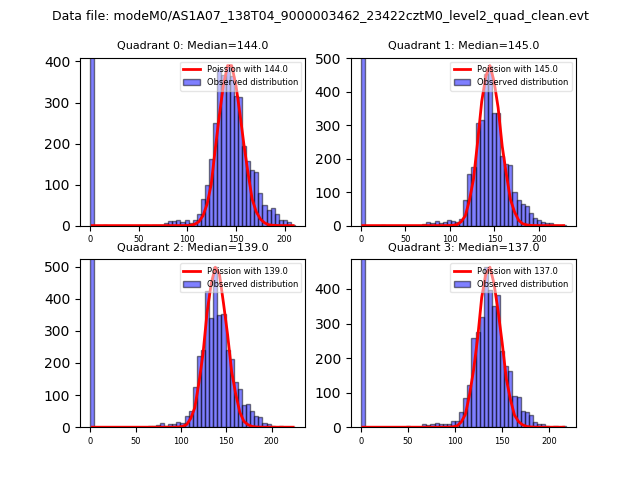 |
 |
| Quadrant-wise count rates Data is divided into 100 sec bins |
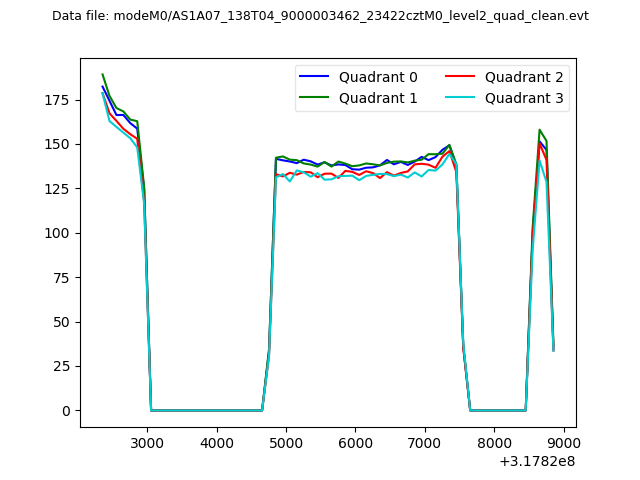 |
|
| Module-wise count rates for Quadrant A Data is divided into 100 sec bins |
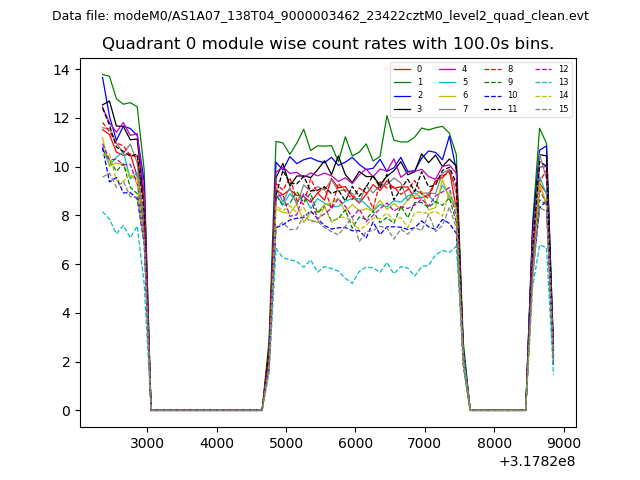 |
 |
| Module-wise count rates for Quadrant B Data is divided into 100 sec bins |
 |
 |
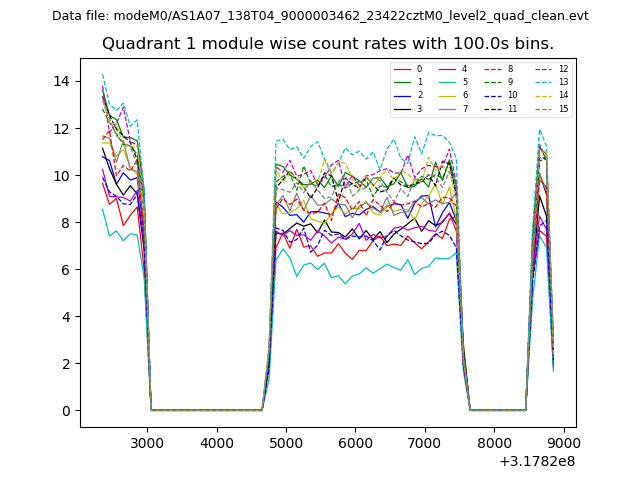
| Module-wise count rates for Quadrant C Data is divided into 100 sec bins |
 |
 |
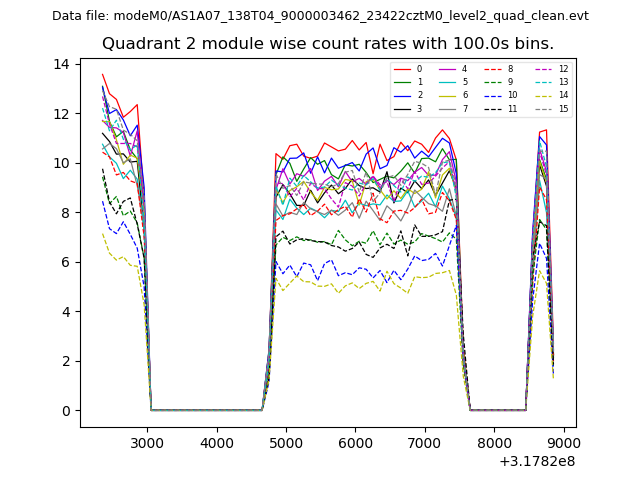
| Module-wise count rates for Quadrant D Data is divided into 100 sec bins |
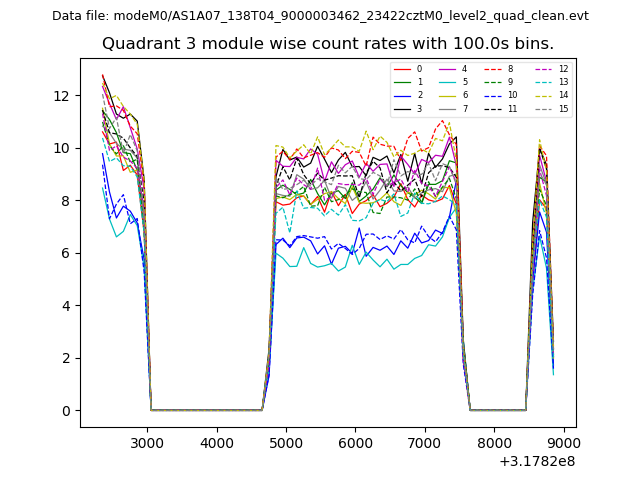 |
 |
| Parameter | Plot |
|---|---|
| CZT HV Monitor | 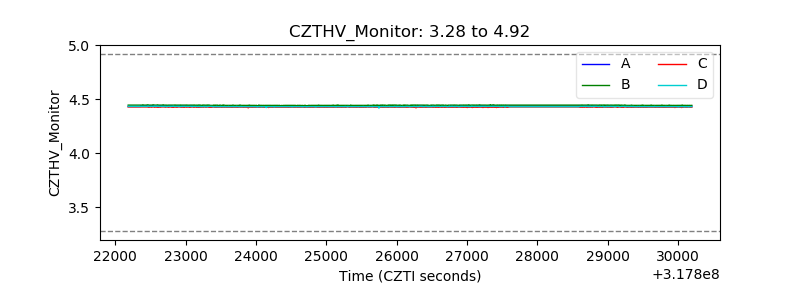 |
| D_VDD | 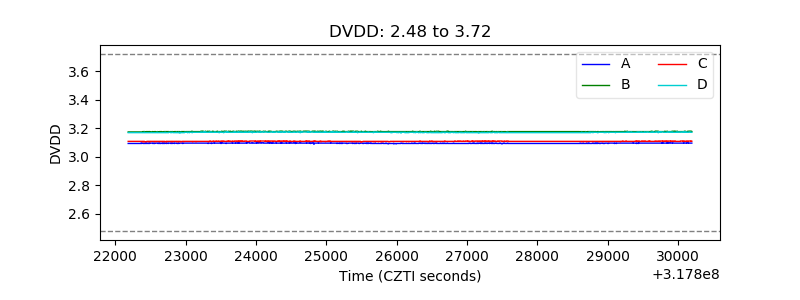 |
| Temperature 1 | 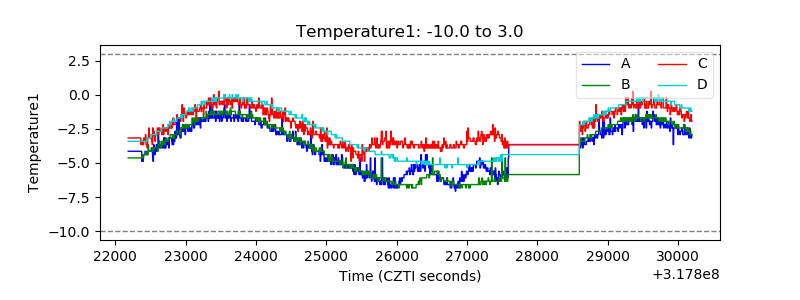 |
| Veto HV Monitor | 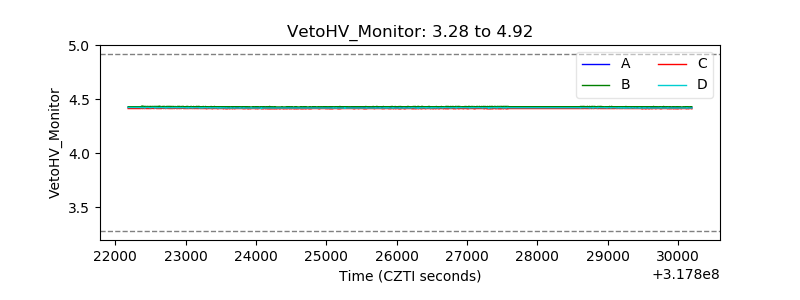 |
| Veto LLD | 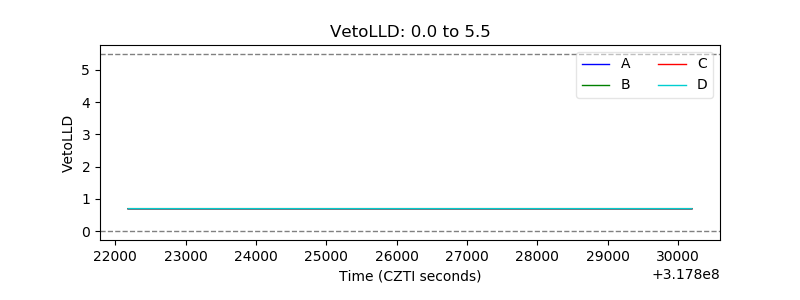 |
| Alpha Counter | 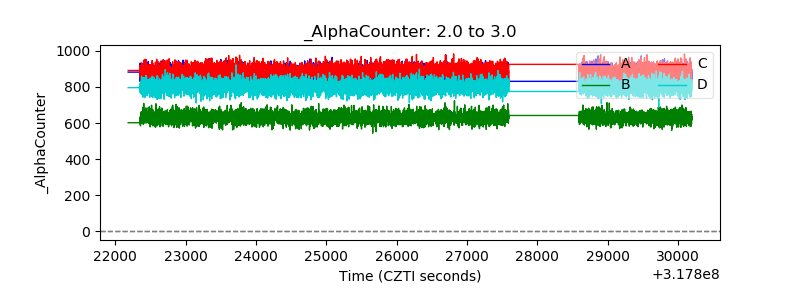 |
| _CPM_Rate | 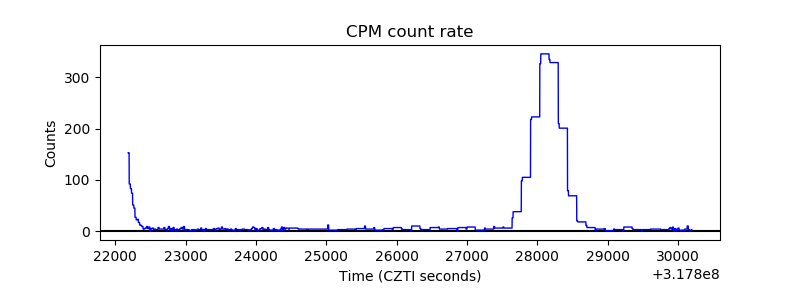 |
| CZT Counter | 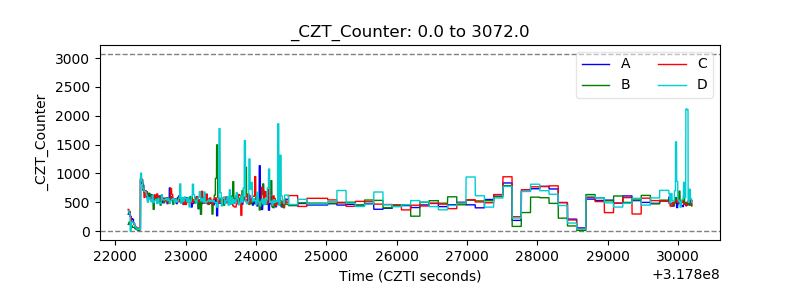 |
| +2.5 Volts monitor | 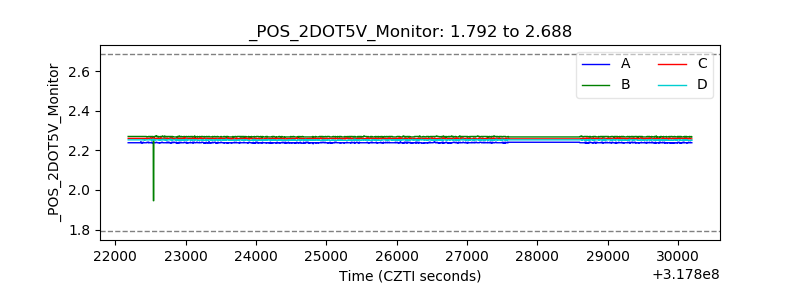 |
| +5 Volts monitor |  |
| _ROLL_ROT | 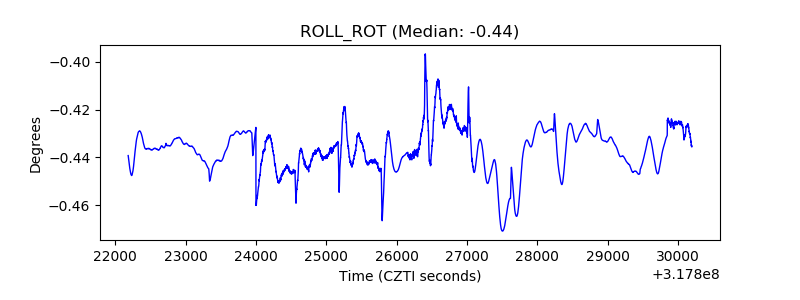 |
| _Roll_DEC | 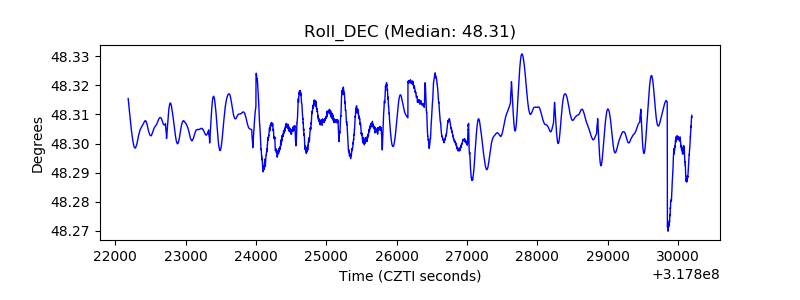 |
| _Roll_RA | 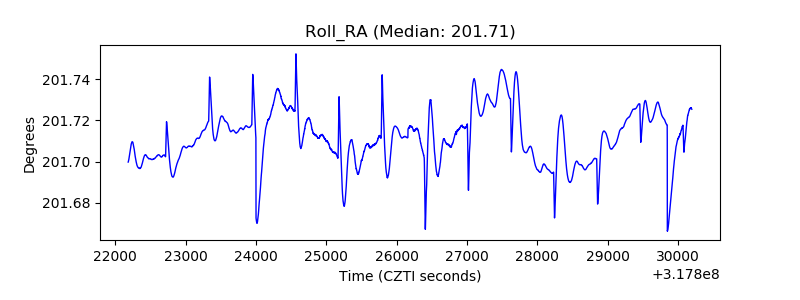 |
| Veto Counter | 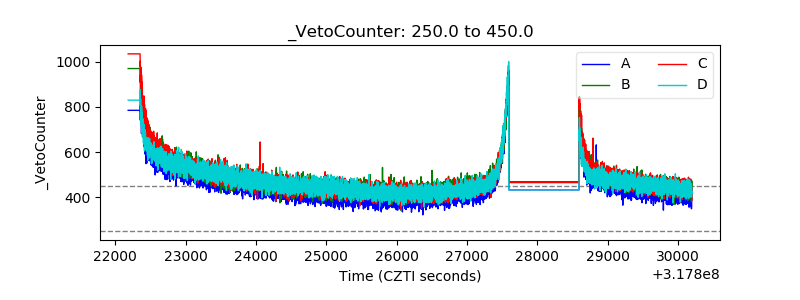 |