| Param | Original file | Final file |
|---|---|---|
| Filename | modeM0/AS1A07_138T04_9000003462_23424cztM0_level2.evt | modeM0/AS1A07_138T04_9000003462_23424cztM0_level2_quad_clean.evt |
| Size (bytes) | 220,970,880 | 27,000,000 |
| Size | 210.7 MB | 25.7 MB |
| Events in quadrant A | 1,264,680 | 160,219 |
| Events in quadrant B | 1,315,995 | 161,389 |
| Events in quadrant C | 1,329,476 | 153,063 |
| Events in quadrant D | 2,593,610 | 146,214 |
| Mode M0 | |||
|---|---|---|---|
| Quadrant | BADHDUFLAG | Total packets | Discarded packets |
| A | 0 | 5524 | 0 |
| B | 0 | 5613 | 0 |
| C | 0 | 5579 | 0 |
| D | 0 | 9509 | 0 |
| Mode SS | |||
|---|---|---|---|
| Quadrant | BADHDUFLAG | Total packets | Discarded packets |
| A | 0 | 56 | 0 |
| B | 0 | 56 | 0 |
| C | 0 | 56 | 0 |
| D | 0 | 56 | 0 |
| Quadrant | Total seconds | Saturated seconds | Saturation percentage |
|---|---|---|---|
| A | 2737 | 0 | 0.000000% |
| B | 2737 | 10 | 0.365364% |
| C | 2737 | 19 | 0.694191% |
| D | 2737 | 364 | 13.299233% |
Noise dominated data is calculated using 1-second bins in cleaned event files. If a bin has >2000 counts, and if more than 50% of those come from <1% of pixels, then it is considered to be noise-dominated and hence unusable.
| Quadrant | # 1 sec bins | Bins with >0 counts | Bins with >2000 counts | High rate bins dominated by noise | Noise dominated (total time) | Noise dominated (detector-on time) | Marked lightcurve |
|---|---|---|---|---|---|---|---|
| A | 2737 | 2737 | 0 | 0 | 0.00% | 0.00% | 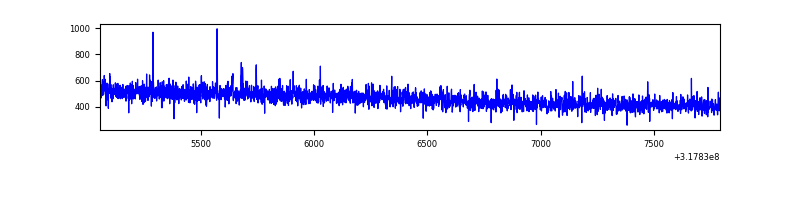 |
| B | 2737 | 2737 | 3 | 3 | 0.11% | 0.11% | 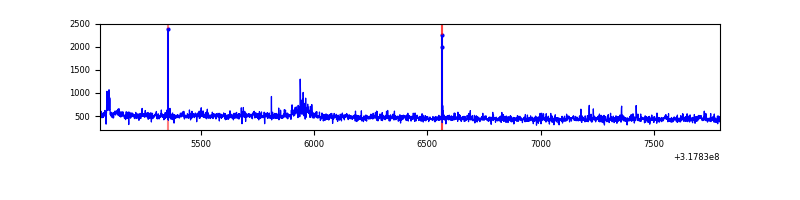 |
| C | 2737 | 2737 | 0 | 0 | 0.00% | 0.00% | 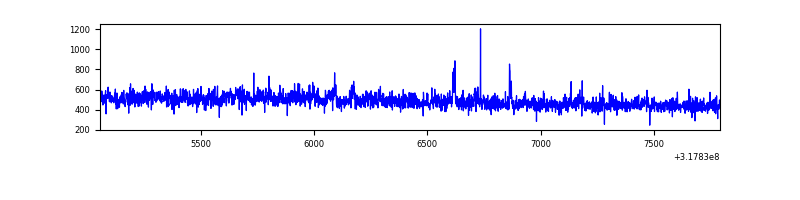 |
| D | 2737 | 2737 | 355 | 355 | 12.97% | 12.97% | 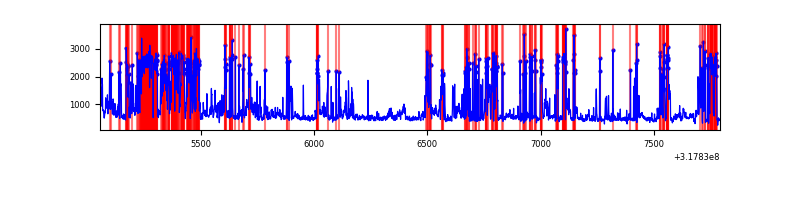 |
Top three noisy pixels from each quadrant. If the there are fewer than three noisy pixels in the level2.evt file, extra rows are filled as -1
| Pixel properties | Quadrant properties | ||||||
|---|---|---|---|---|---|---|---|
| Quadrant | DetID | PixID | Counts | Sigma | Mean | Median | Sigma |
| A | 8 | 205 | 4702 | 64.04 | 326 | 318 | 68.5 |
| A | 13 | 254 | 4203 | 56.75 | 326 | 318 | 68.5 |
| A | 0 | 226 | 2837 | 36.8 | 326 | 318 | 68.5 |
| B | 0 | 190 | 22448 | 353.38 | 325 | 317 | 62.6 |
| B | 12 | 111 | 7273 | 111.07 | 325 | 317 | 62.6 |
| B | 0 | 229 | 6831 | 104.01 | 325 | 317 | 62.6 |
| C | 14 | 238 | 49837 | 664.95 | 313 | 315 | 74.5 |
| C | 10 | 9 | 40099 | 534.19 | 313 | 315 | 74.5 |
| C | 7 | 247 | 13843 | 181.64 | 313 | 315 | 74.5 |
| D | 1 | 52 | 1282748 | 16979.02 | 304 | 295 | 75.5 |
| D | 12 | 233 | 54162 | 713.17 | 304 | 295 | 75.5 |
| D | 12 | 227 | 49720 | 654.36 | 304 | 295 | 75.5 |
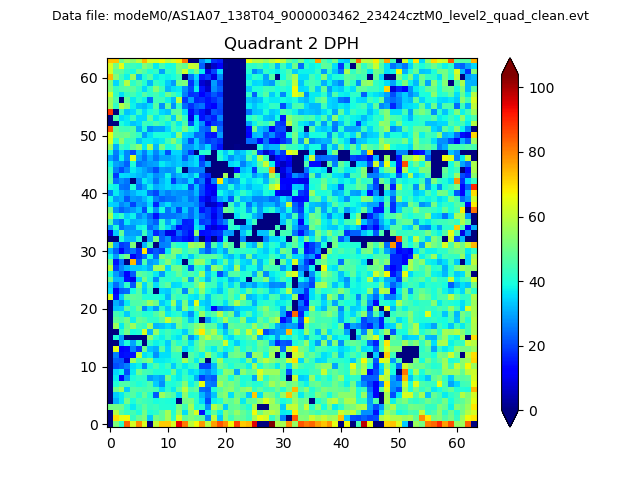
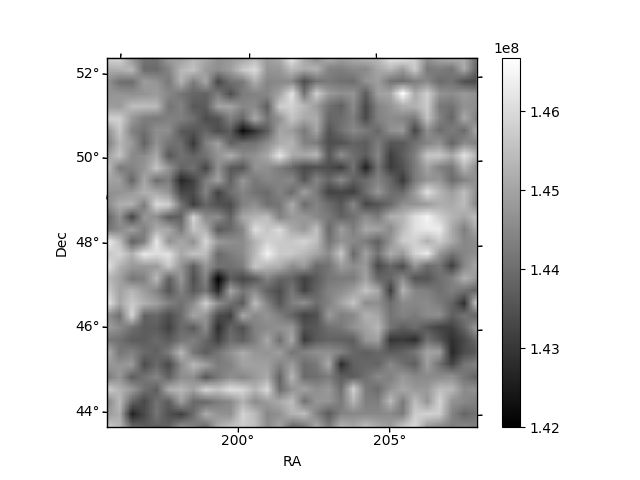
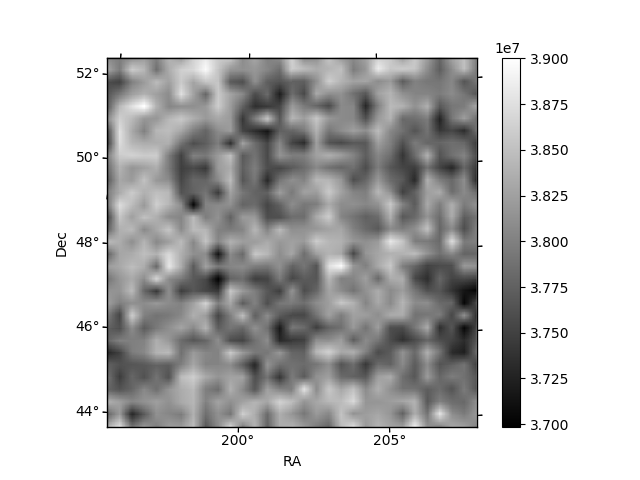
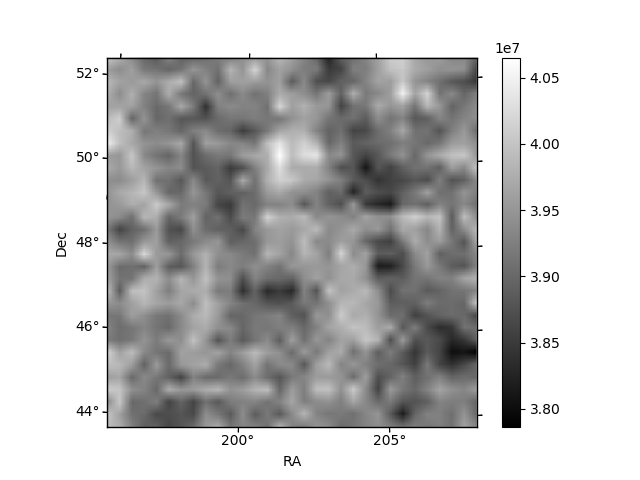
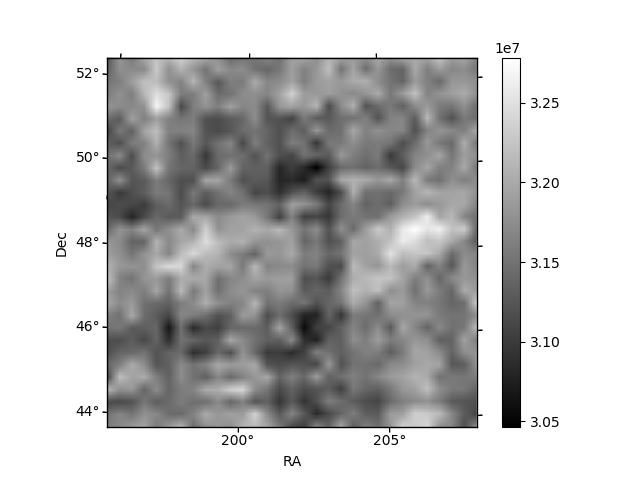
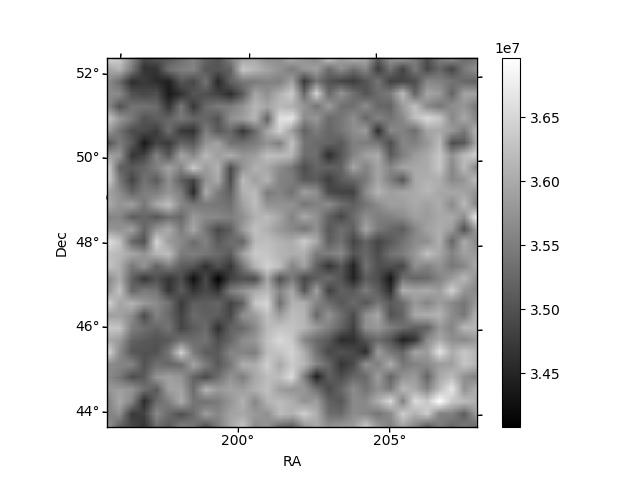
Histogram calculated using DETX and DETY for each event in the final _common_clean file
| Quadrant A | 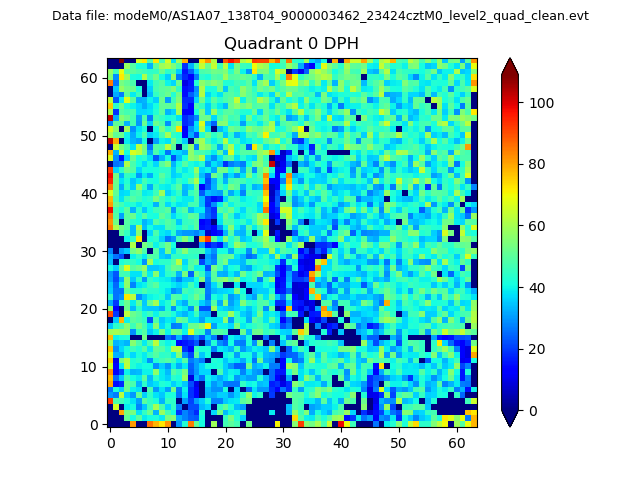 |
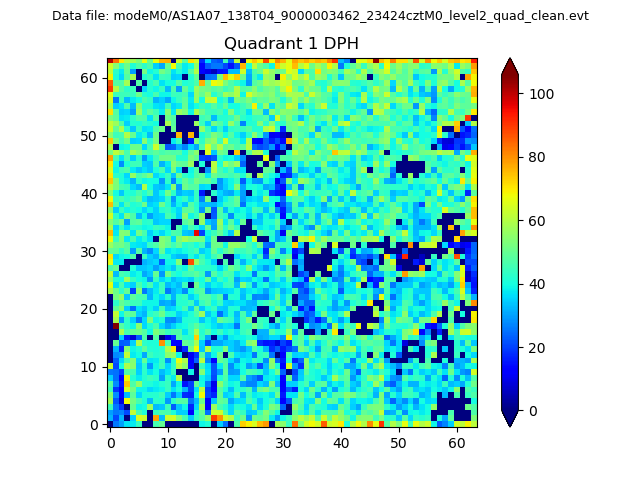 |
Quadrant B |
|---|---|---|---|
| Quadrant D | 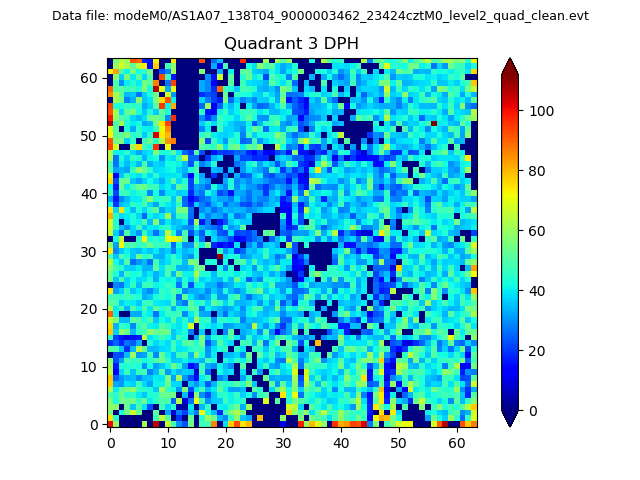 |
 |
Quadrant C |
| Plot type | Count rate plots | Images |
|---|---|---|
| Comparison with Poisson distribution Blue bars denote a histogram of data divided into 1 sec bins. Red curve is a Poisson curve with rate = median count rate of data. |
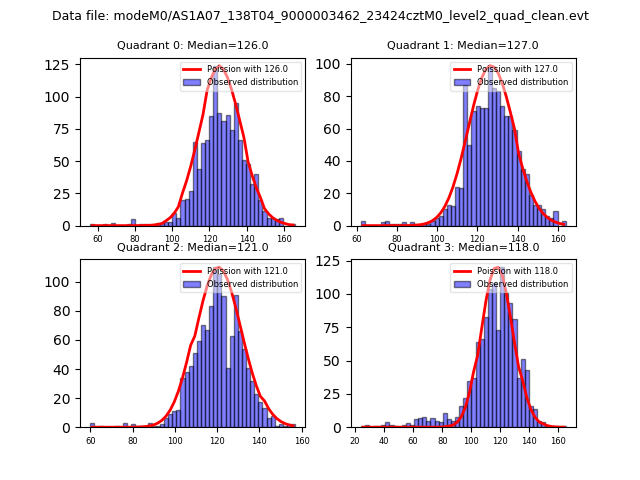 |
 |
| Quadrant-wise count rates Data is divided into 100 sec bins |
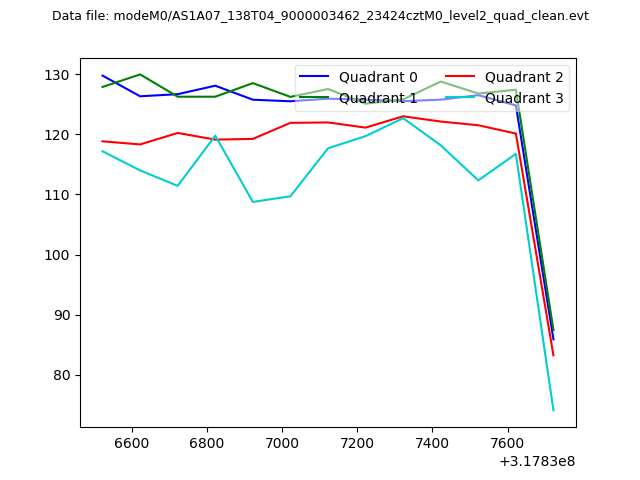 |
|
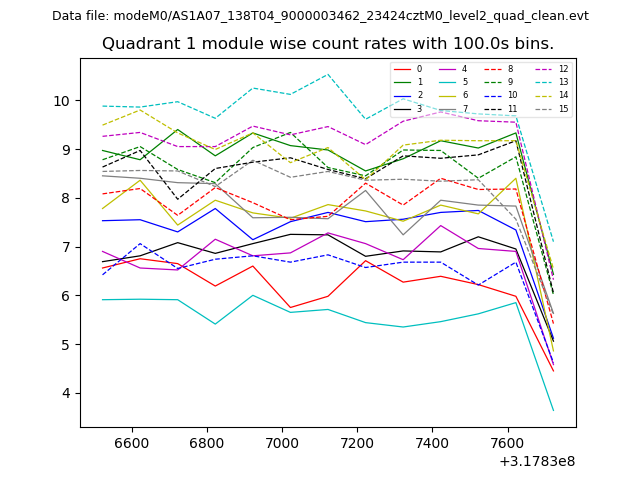
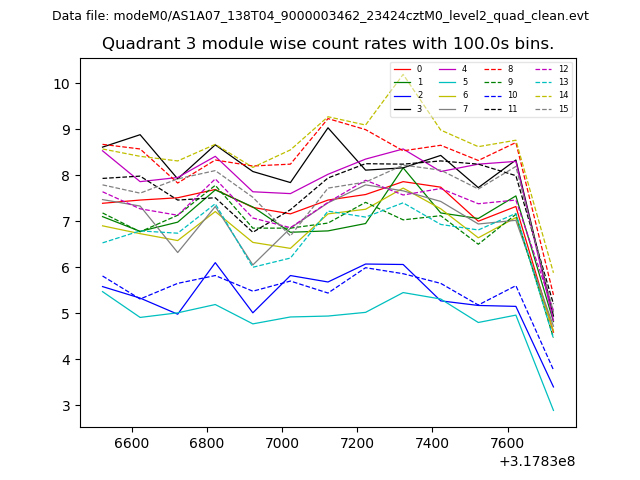
| Module-wise count rates for Quadrant A Data is divided into 100 sec bins |
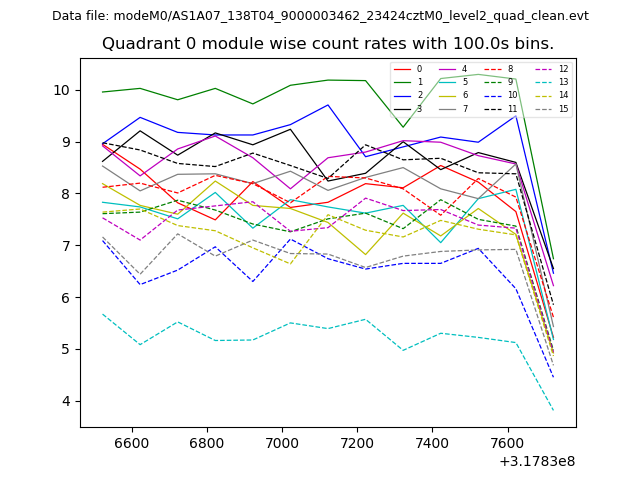 |
 |
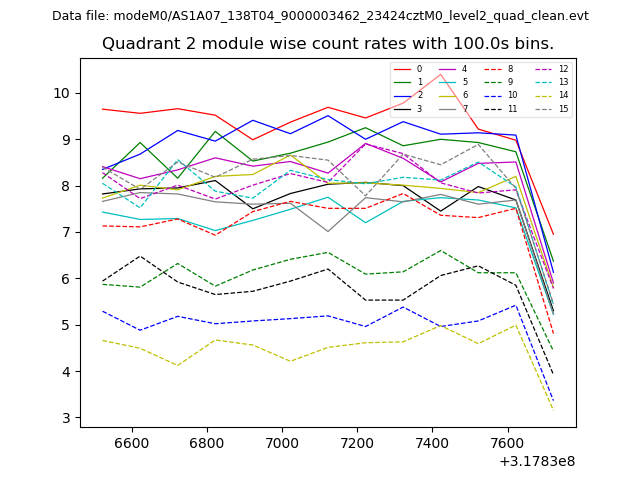
| Module-wise count rates for Quadrant B Data is divided into 100 sec bins |
 |
 |
| Module-wise count rates for Quadrant C Data is divided into 100 sec bins |
 |
 |
| Module-wise count rates for Quadrant D Data is divided into 100 sec bins |
 |
 |
| Parameter | Plot |
|---|---|
| CZT HV Monitor | 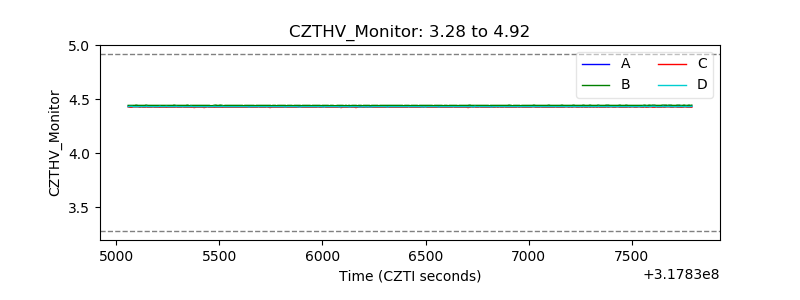 |
| D_VDD | 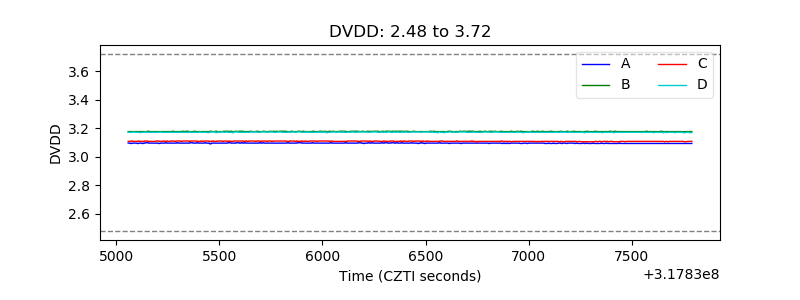 |
| Temperature 1 | 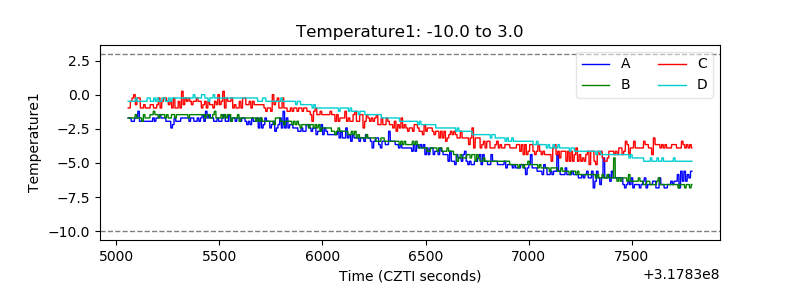 |
| Veto HV Monitor | 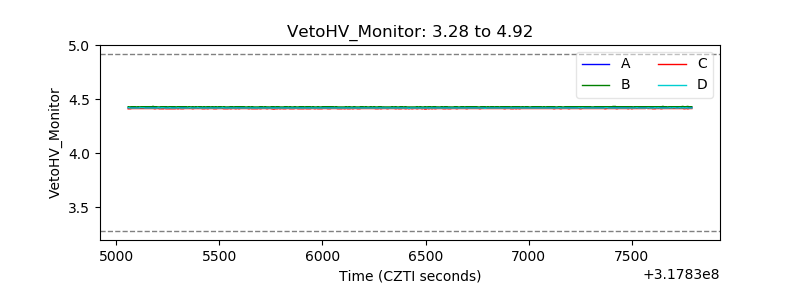 |
| Veto LLD | 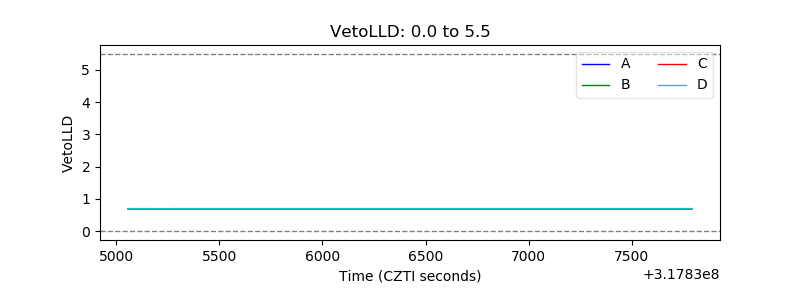 |
| Alpha Counter |  |
| _CPM_Rate | 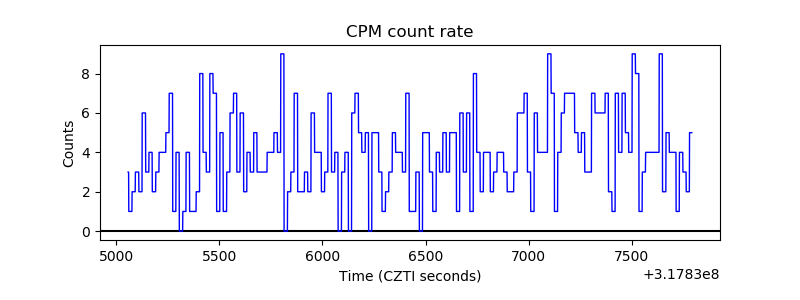 |
| CZT Counter | 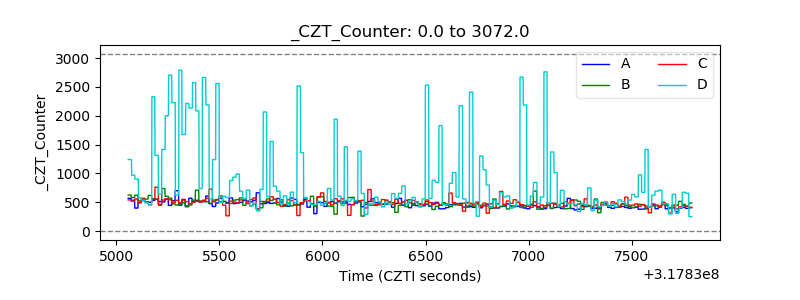 |
| +2.5 Volts monitor |  |
| +5 Volts monitor |  |
| _ROLL_ROT | 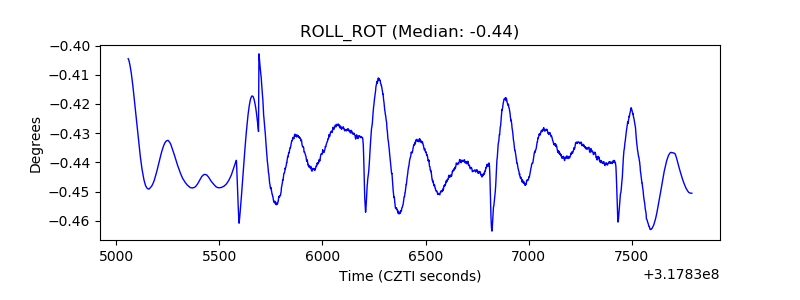 |
| _Roll_DEC | 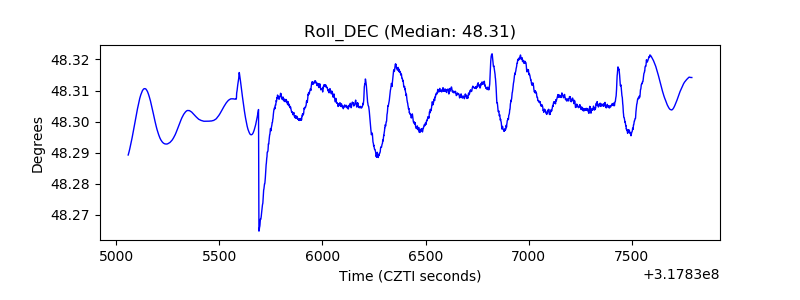 |
| _Roll_RA | 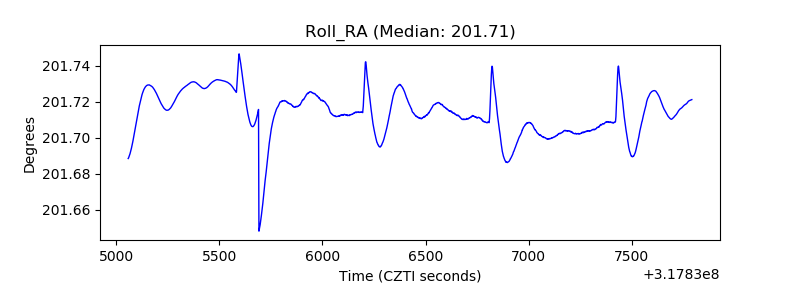 |
| Veto Counter | 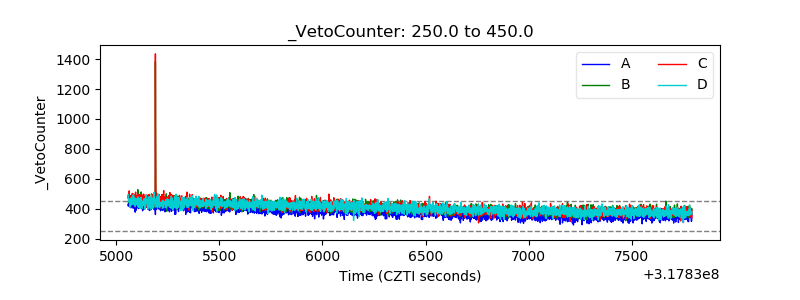 |