| Param | Original file | Final file |
|---|---|---|
| Filename | modeM0/AS1A07_100T02_9000003470_23442cztM0_level2.evt | modeM0/AS1A07_100T02_9000003470_23442cztM0_level2_quad_clean.evt |
| Size (bytes) | 324,616,320 | 52,534,080 |
| Size | 309.6 MB | 50.1 MB |
| Events in quadrant A | 1,771,901 | 341,130 |
| Events in quadrant B | 1,879,959 | 346,991 |
| Events in quadrant C | 2,066,782 | 326,033 |
| Events in quadrant D | 3,846,045 | 300,604 |
| Mode M0 | |||
|---|---|---|---|
| Quadrant | BADHDUFLAG | Total packets | Discarded packets |
| A | 0 | 7899 | 0 |
| B | 0 | 8224 | 0 |
| C | 0 | 8602 | 0 |
| D | 0 | 14069 | 0 |
| Mode SS | |||
|---|---|---|---|
| Quadrant | BADHDUFLAG | Total packets | Discarded packets |
| A | 0 | 78 | 0 |
| B | 0 | 78 | 0 |
| C | 0 | 78 | 0 |
| D | 0 | 78 | 0 |
| Quadrant | Total seconds | Saturated seconds | Saturation percentage |
|---|---|---|---|
| A | 3904 | 12 | 0.307377% |
| B | 3904 | 40 | 1.024590% |
| C | 3904 | 70 | 1.793033% |
| D | 3904 | 483 | 12.371926% |
Noise dominated data is calculated using 1-second bins in cleaned event files. If a bin has >2000 counts, and if more than 50% of those come from <1% of pixels, then it is considered to be noise-dominated and hence unusable.
| Quadrant | # 1 sec bins | Bins with >0 counts | Bins with >2000 counts | High rate bins dominated by noise | Noise dominated (total time) | Noise dominated (detector-on time) | Marked lightcurve |
|---|---|---|---|---|---|---|---|
| A | 3904 | 3904 | 0 | 0 | 0.00% | 0.00% | 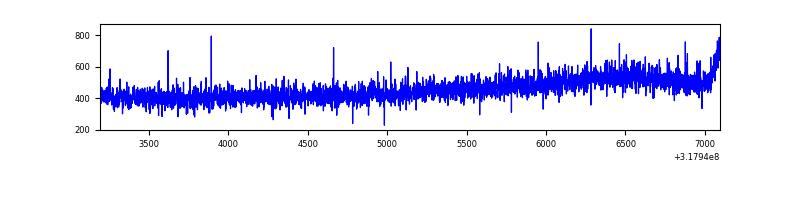 |
| B | 3903 | 3903 | 12 | 12 | 0.31% | 0.31% | 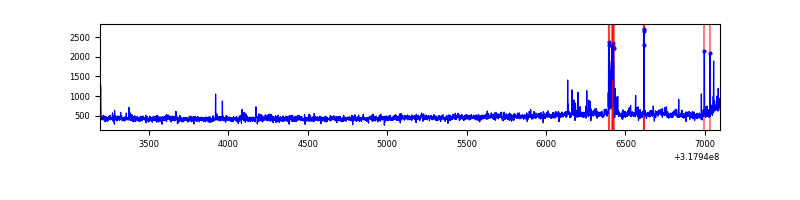 |
| C | 3904 | 3904 | 30 | 30 | 0.77% | 0.77% | 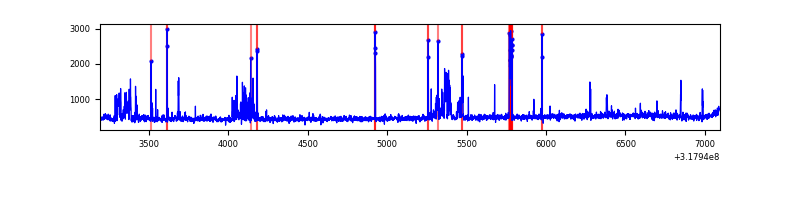 |
| D | 3904 | 3904 | 490 | 490 | 12.55% | 12.55% | 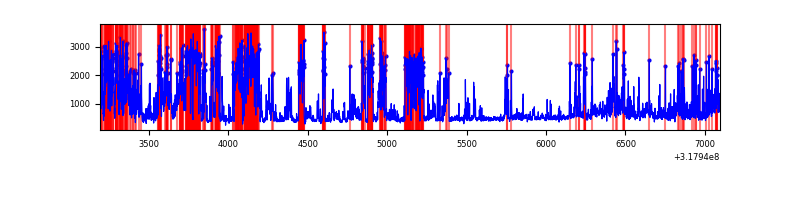 |
Top three noisy pixels from each quadrant. If the there are fewer than three noisy pixels in the level2.evt file, extra rows are filled as -1
| Pixel properties | Quadrant properties | ||||||
|---|---|---|---|---|---|---|---|
| Quadrant | DetID | PixID | Counts | Sigma | Mean | Median | Sigma |
| A | 13 | 254 | 5694 | 56.22 | 459 | 449 | 93.3 |
| A | 0 | 226 | 4022 | 38.3 | 459 | 449 | 93.3 |
| A | 3 | 137 | 4004 | 38.11 | 459 | 449 | 93.3 |
| B | 0 | 190 | 52089 | 584.88 | 454 | 442 | 88.3 |
| B | 0 | 189 | 19039 | 210.6 | 454 | 442 | 88.3 |
| B | 0 | 229 | 11139 | 121.14 | 454 | 442 | 88.3 |
| C | 10 | 9 | 256530 | 2450.03 | 444 | 447 | 104.5 |
| C | 14 | 238 | 70288 | 668.19 | 444 | 447 | 104.5 |
| C | 3 | 233 | 4904 | 42.64 | 444 | 447 | 104.5 |
| D | 1 | 52 | 2021325 | 18830.95 | 437 | 424 | 107.3 |
| D | 7 | 238 | 82435 | 764.19 | 437 | 424 | 107.3 |
| D | 12 | 233 | 42823 | 395.08 | 437 | 424 | 107.3 |
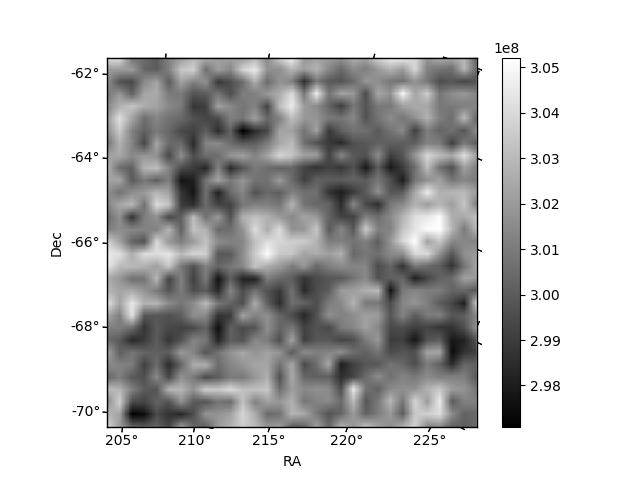
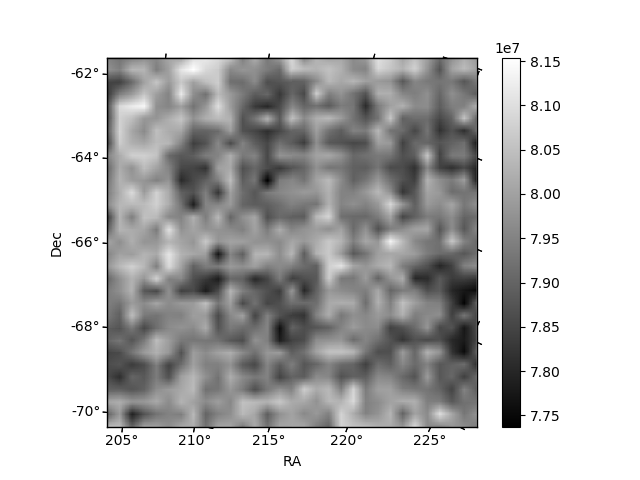
Histogram calculated using DETX and DETY for each event in the final _common_clean file
| Quadrant A |  |
 |
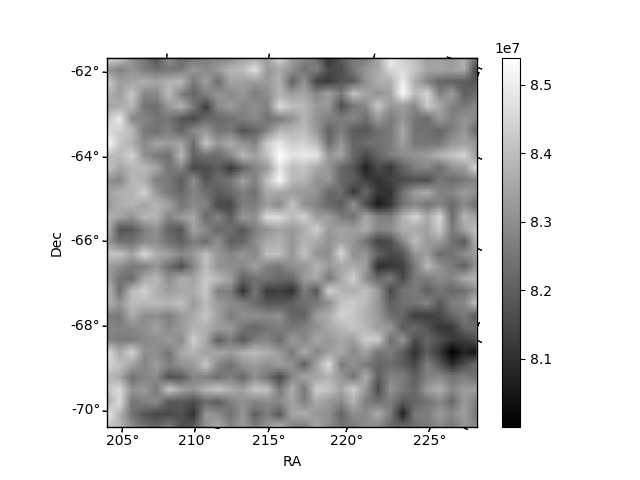
Quadrant B |
|---|---|---|---|
| Quadrant D |  |
 |
Quadrant C |
| Plot type | Count rate plots | Images |
|---|---|---|
| Comparison with Poisson distribution Blue bars denote a histogram of data divided into 1 sec bins. Red curve is a Poisson curve with rate = median count rate of data. |
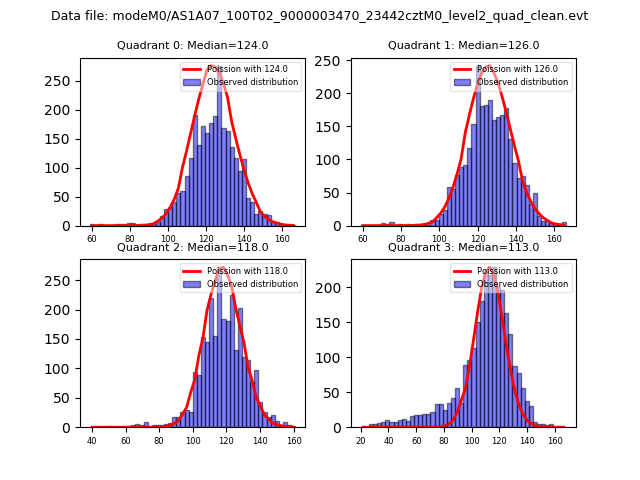 |
 |
| Quadrant-wise count rates Data is divided into 100 sec bins |
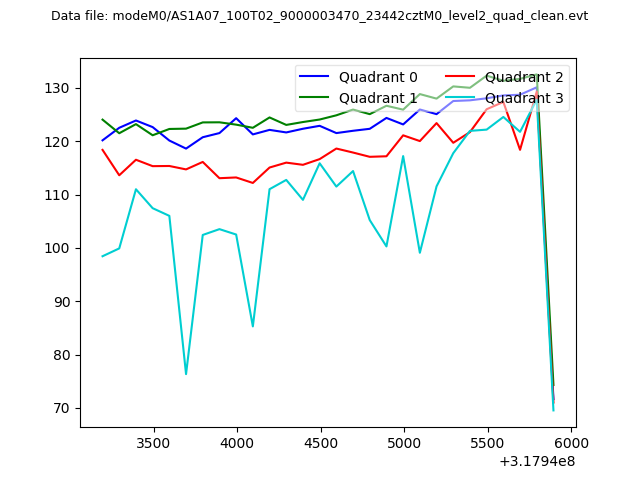 |
|
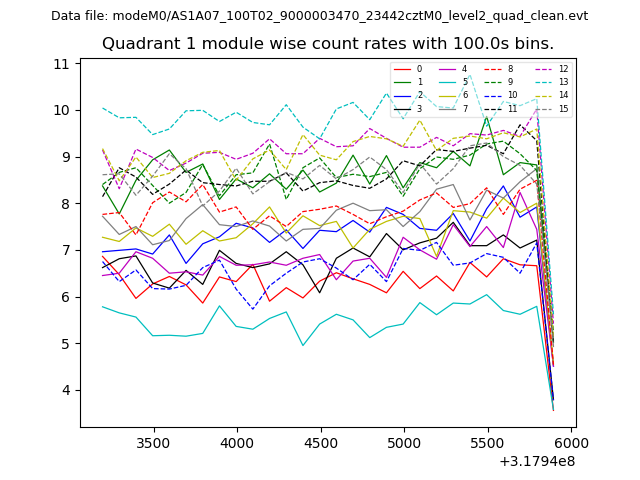
| Module-wise count rates for Quadrant A Data is divided into 100 sec bins |
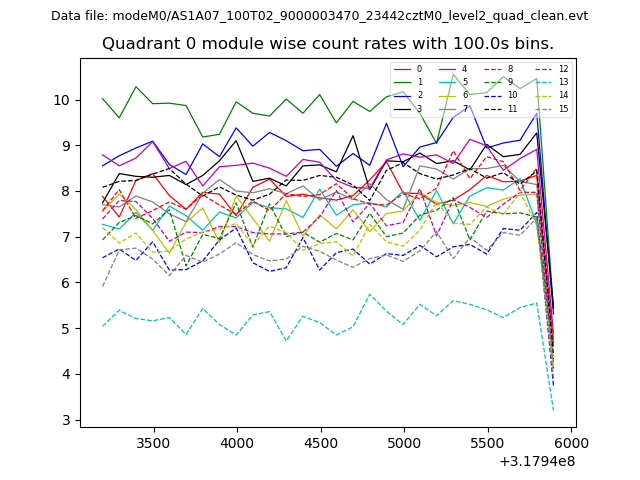 |
 |
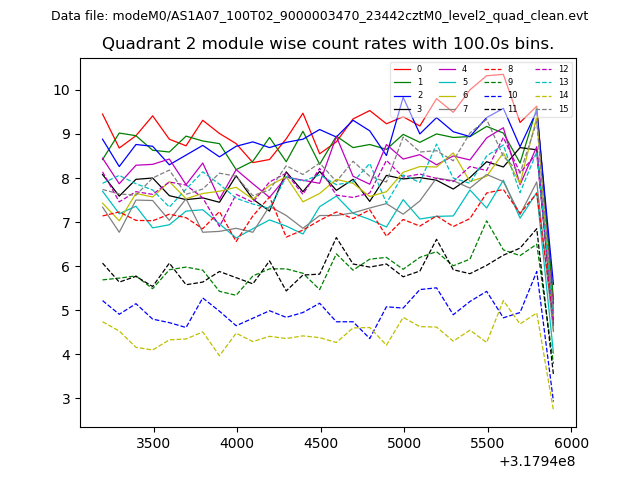
| Module-wise count rates for Quadrant B Data is divided into 100 sec bins |
 |
 |
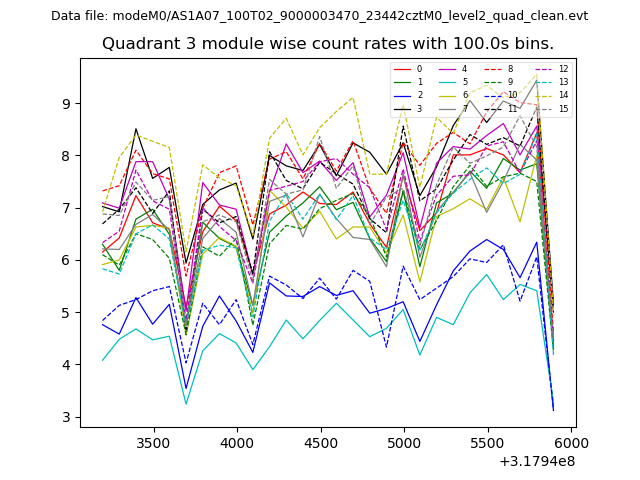
| Module-wise count rates for Quadrant C Data is divided into 100 sec bins |
 |
 |
| Module-wise count rates for Quadrant D Data is divided into 100 sec bins |
 |
 |
| Parameter | Plot |
|---|---|
| CZT HV Monitor | 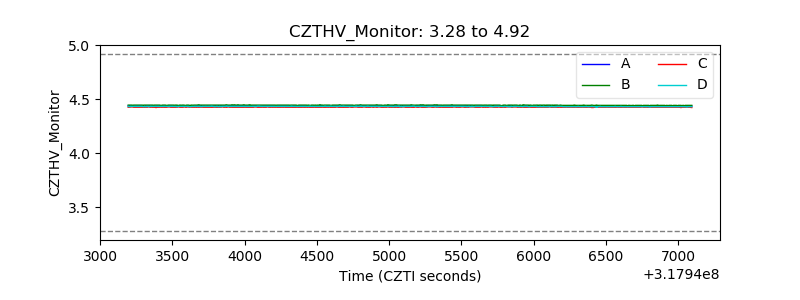 |
| D_VDD | 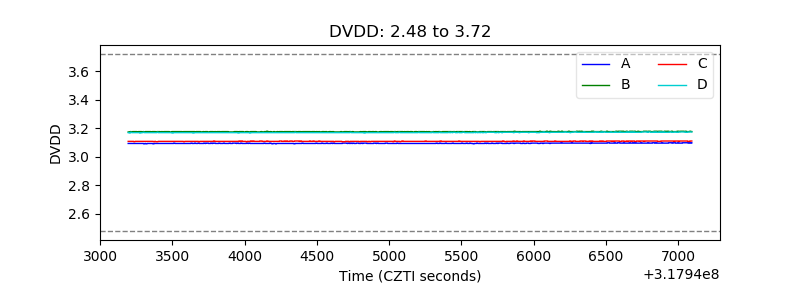 |
| Temperature 1 | 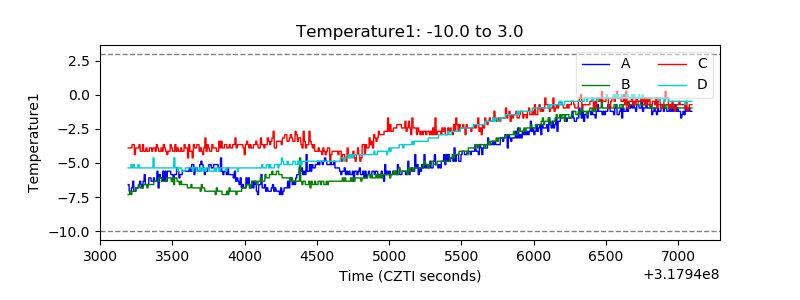 |
| Veto HV Monitor | 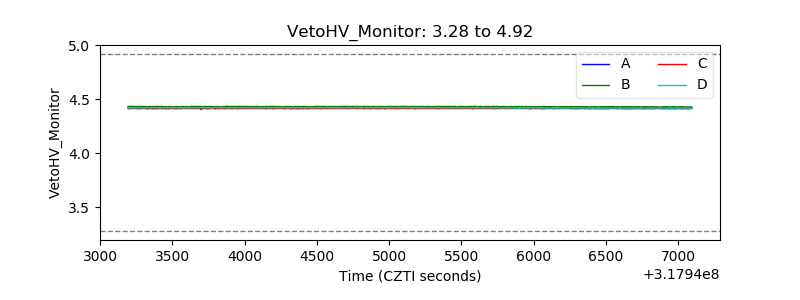 |
| Veto LLD |  |
| Alpha Counter | 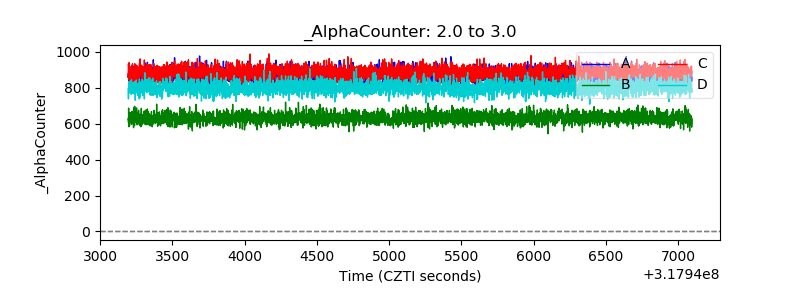 |
| _CPM_Rate | 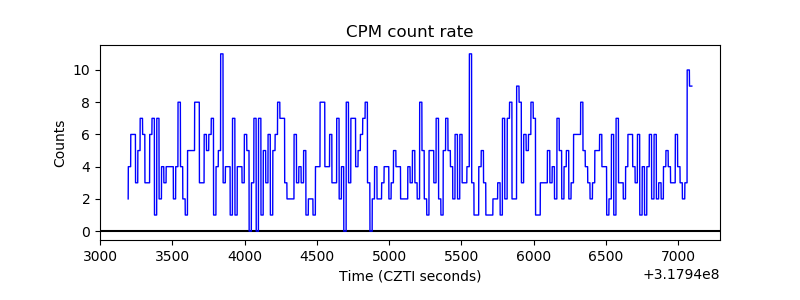 |
| CZT Counter |  |
| +2.5 Volts monitor |  |
| +5 Volts monitor |  |
| _ROLL_ROT | 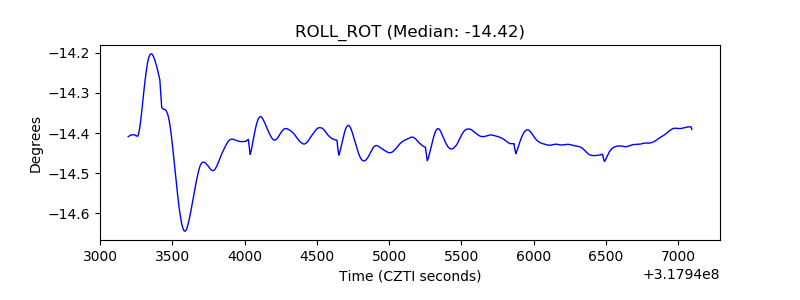 |
| _Roll_DEC | 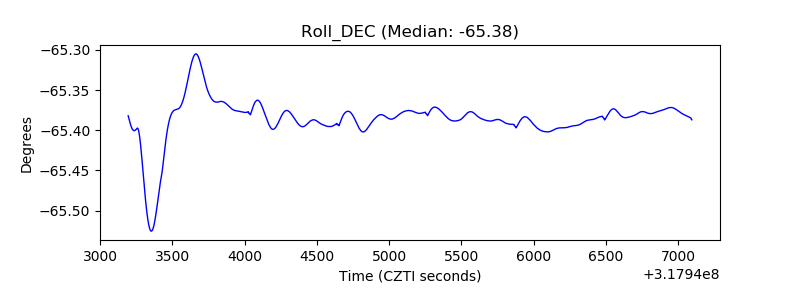 |
| _Roll_RA | 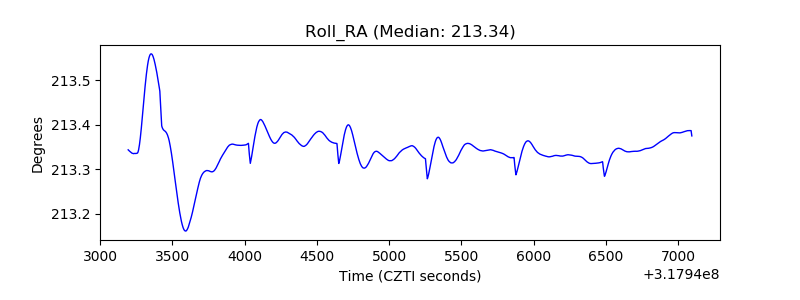 |
| Veto Counter | 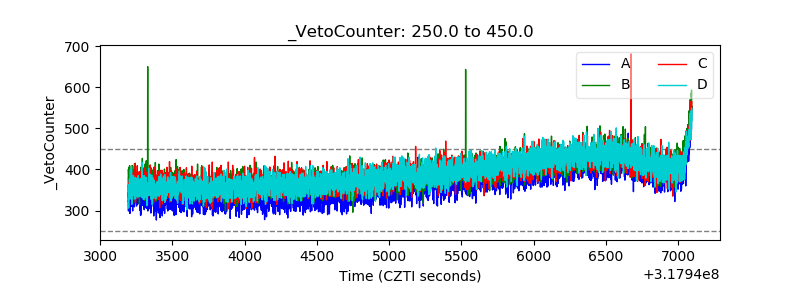 |