| Param | Original file | Final file |
|---|---|---|
| Filename | modeM0/AS1A07_100T02_9000003470_23443cztM0_level2.evt | modeM0/AS1A07_100T02_9000003470_23443cztM0_level2_quad_clean.evt |
| Size (bytes) | 537,373,440 | 107,449,920 |
| Size | 512.5 MB | 102.5 MB |
| Events in quadrant A | 3,444,264 | 701,217 |
| Events in quadrant B | 3,760,840 | 714,283 |
| Events in quadrant C | 3,650,767 | 677,611 |
| Events in quadrant D | 4,916,358 | 646,069 |
| Mode M0 | |||
|---|---|---|---|
| Quadrant | BADHDUFLAG | Total packets | Discarded packets |
| A | 0 | 15026 | 3 |
| B | 0 | 15842 | 2 |
| C | 0 | 15414 | 2 |
| D | 0 | 19564 | 2 |
| Mode M9 | |||
|---|---|---|---|
| Quadrant | BADHDUFLAG | Total packets | Discarded packets |
| A | 0 | 16 | 0 |
| B | 0 | 16 | 0 |
| C | 0 | 16 | 0 |
| D | 0 | 16 | 0 |
| Mode SS | |||
|---|---|---|---|
| Quadrant | BADHDUFLAG | Total packets | Discarded packets |
| A | 0 | 152 | 0 |
| B | 0 | 152 | 0 |
| C | 0 | 152 | 0 |
| D | 0 | 152 | 0 |
| Quadrant | Total seconds | Saturated seconds | Saturation percentage |
|---|---|---|---|
| A | 7399 | 27 | 0.364914% |
| B | 7399 | 84 | 1.135289% |
| C | 7399 | 81 | 1.094743% |
| D | 7400 | 341 | 4.608108% |
Noise dominated data is calculated using 1-second bins in cleaned event files. If a bin has >2000 counts, and if more than 50% of those come from <1% of pixels, then it is considered to be noise-dominated and hence unusable.
| Quadrant | # 1 sec bins | Bins with >0 counts | Bins with >2000 counts | High rate bins dominated by noise | Noise dominated (total time) | Noise dominated (detector-on time) | Marked lightcurve |
|---|---|---|---|---|---|---|---|
| A | 8979 | 7401 | 0 | 0 | 0.00% | 0.00% |  |
| B | 8979 | 7400 | 23 | 23 | 0.26% | 0.31% |  |
| C | 8979 | 7400 | 14 | 14 | 0.16% | 0.19% |  |
| D | 8980 | 7402 | 274 | 274 | 3.05% | 3.70% |  |
Top three noisy pixels from each quadrant. If the there are fewer than three noisy pixels in the level2.evt file, extra rows are filled as -1
| Pixel properties | Quadrant properties | ||||||
|---|---|---|---|---|---|---|---|
| Quadrant | DetID | PixID | Counts | Sigma | Mean | Median | Sigma |
| A | 13 | 254 | 12786 | 65.85 | 892 | 872 | 180.9 |
| A | 3 | 137 | 8031 | 39.57 | 892 | 872 | 180.9 |
| A | 0 | 226 | 7685 | 37.65 | 892 | 872 | 180.9 |
| B | 5 | 172 | 85466 | 500.04 | 894 | 874 | 169.2 |
| B | 0 | 229 | 68448 | 399.44 | 894 | 874 | 169.2 |
| B | 0 | 189 | 45816 | 265.66 | 894 | 874 | 169.2 |
| C | 14 | 238 | 135566 | 672.61 | 859 | 865 | 200.3 |
| C | 10 | 9 | 131986 | 654.73 | 859 | 865 | 200.3 |
| C | 7 | 247 | 15051 | 70.84 | 859 | 865 | 200.3 |
| D | 7 | 238 | 885313 | 4308.22 | 847 | 822 | 205.3 |
| D | 1 | 52 | 558573 | 2716.72 | 847 | 822 | 205.3 |
| D | 12 | 233 | 201171 | 975.87 | 847 | 822 | 205.3 |
Histogram calculated using DETX and DETY for each event in the final _common_clean file
| Quadrant A |  |
 |
Quadrant B |
|---|---|---|---|
| Quadrant D |  |
 |
Quadrant C |
| Plot type | Count rate plots | Images |
|---|---|---|
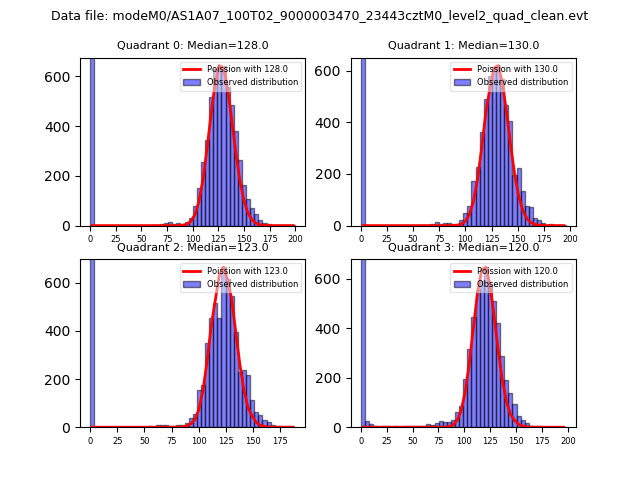
| Comparison with Poisson distribution Blue bars denote a histogram of data divided into 1 sec bins. Red curve is a Poisson curve with rate = median count rate of data. |
 |
 |
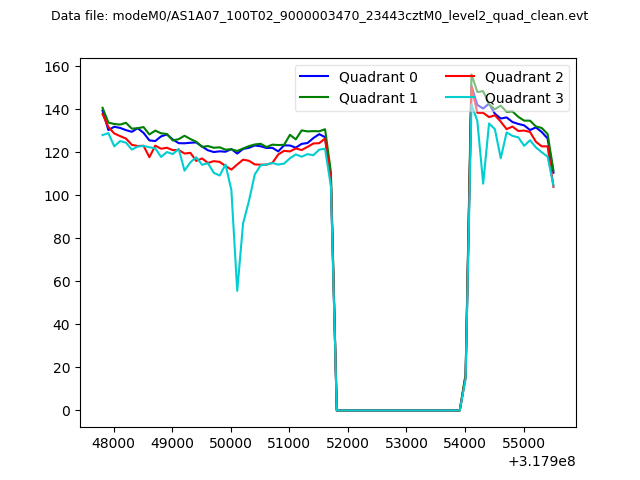
| Quadrant-wise count rates Data is divided into 100 sec bins |
 |
|
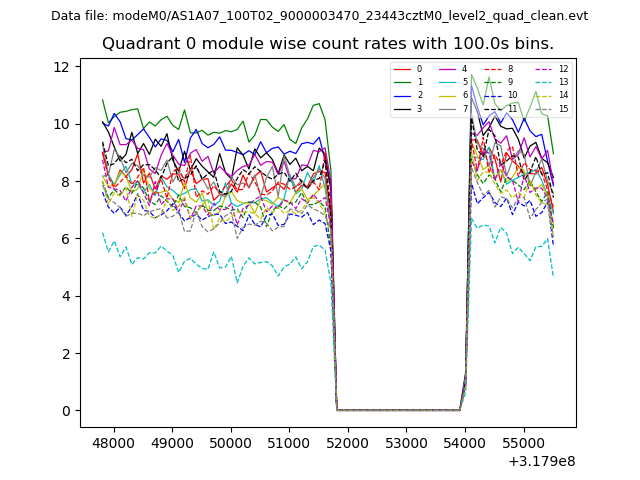
| Module-wise count rates for Quadrant A Data is divided into 100 sec bins |
 |
 |
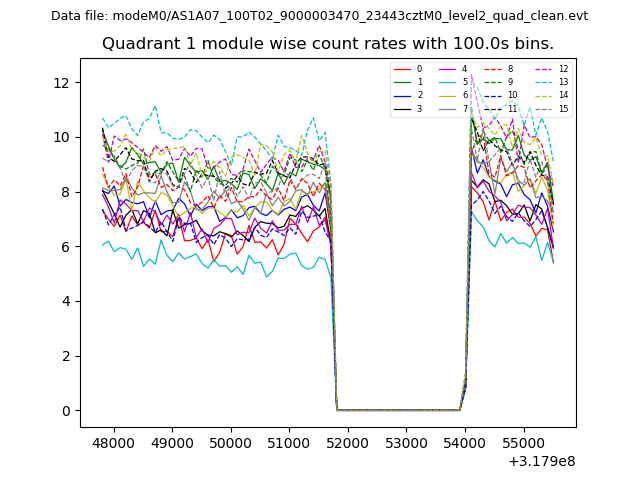
| Module-wise count rates for Quadrant B Data is divided into 100 sec bins |
 |
 |
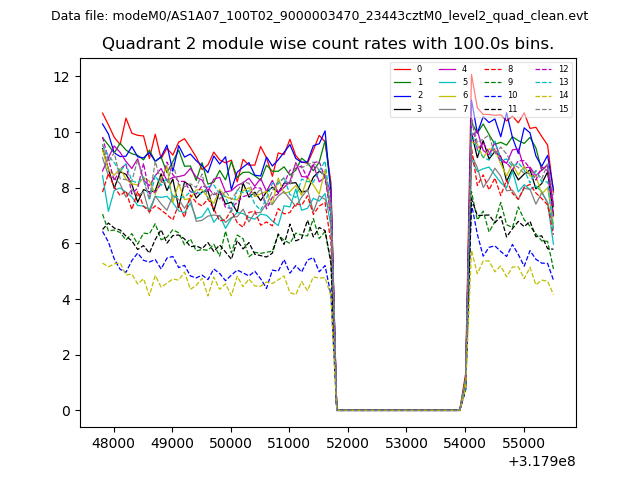
| Module-wise count rates for Quadrant C Data is divided into 100 sec bins |
 |
 |
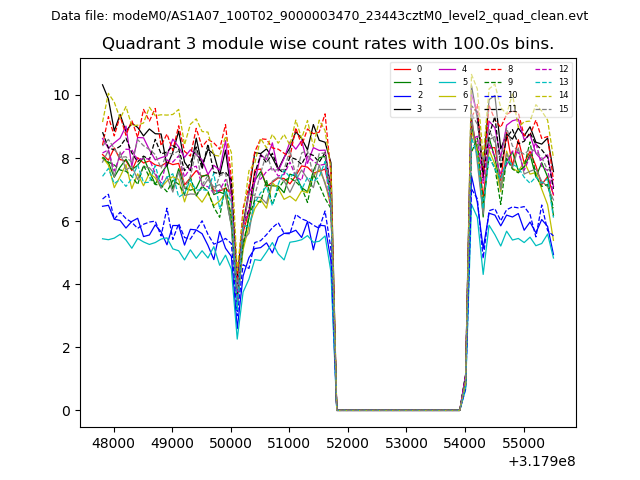
| Module-wise count rates for Quadrant D Data is divided into 100 sec bins |
 |
 |
| Parameter | Plot |
|---|---|
| CZT HV Monitor | 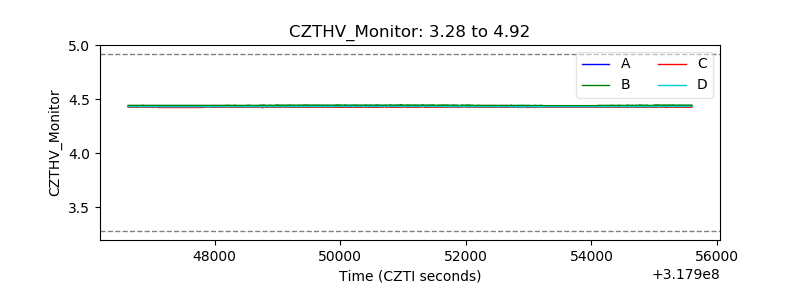 |
| D_VDD |  |
| Temperature 1 |  |
| Veto HV Monitor |  |
| Veto LLD |  |
| Alpha Counter | 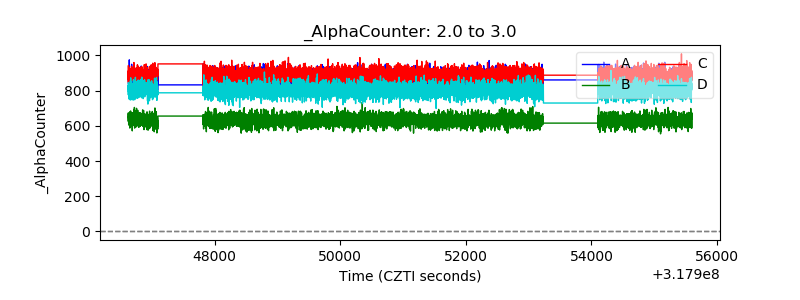 |
| _CPM_Rate | 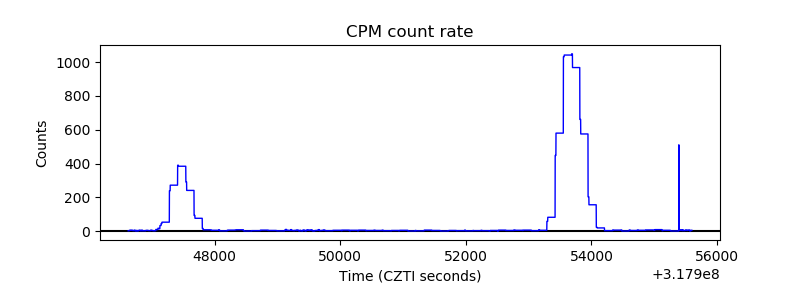 |
| CZT Counter |  |
| +2.5 Volts monitor |  |
| +5 Volts monitor |  |
| _ROLL_ROT | 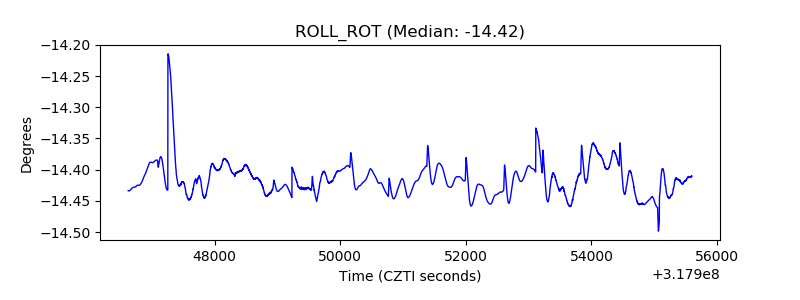 |
| _Roll_DEC | 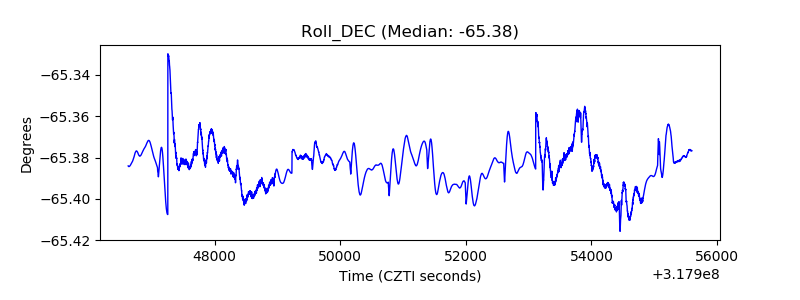 |
| _Roll_RA |  |
| Veto Counter | 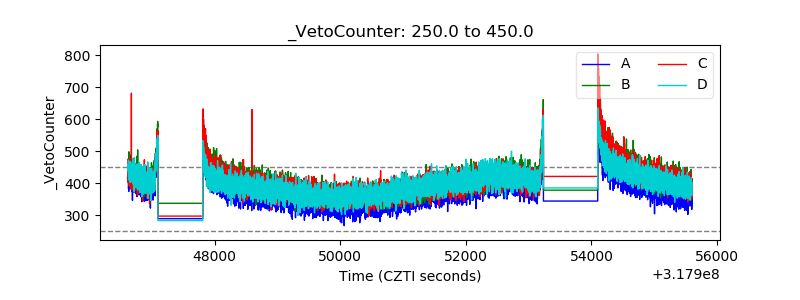 |