| Param | Original file | Final file |
|---|---|---|
| Filename | modeM0/AS1A07_100T02_9000003470_23444cztM0_level2.evt | modeM0/AS1A07_100T02_9000003470_23444cztM0_level2_quad_clean.evt |
| Size (bytes) | 578,211,840 | 104,166,720 |
| Size | 551.4 MB | 99.3 MB |
| Events in quadrant A | 3,215,408 | 687,266 |
| Events in quadrant B | 3,467,741 | 704,721 |
| Events in quadrant C | 3,338,452 | 671,759 |
| Events in quadrant D | 7,028,445 | 616,992 |
| Mode M0 | |||
|---|---|---|---|
| Quadrant | BADHDUFLAG | Total packets | Discarded packets |
| A | 0 | 13920 | 2 |
| B | 0 | 14562 | 2 |
| C | 0 | 14077 | 2 |
| D | 0 | 25424 | 2 |
| Mode M9 | |||
|---|---|---|---|
| Quadrant | BADHDUFLAG | Total packets | Discarded packets |
| A | 0 | 20 | 0 |
| B | 0 | 20 | 0 |
| C | 0 | 20 | 0 |
| D | 0 | 20 | 0 |
| Mode SS | |||
|---|---|---|---|
| Quadrant | BADHDUFLAG | Total packets | Discarded packets |
| A | 0 | 138 | 0 |
| B | 0 | 138 | 0 |
| C | 0 | 138 | 0 |
| D | 0 | 138 | 0 |
| Quadrant | Total seconds | Saturated seconds | Saturation percentage |
|---|---|---|---|
| A | 6806 | 25 | 0.367323% |
| B | 6806 | 53 | 0.778725% |
| C | 6806 | 84 | 1.234205% |
| D | 6806 | 1286 | 18.895093% |
Noise dominated data is calculated using 1-second bins in cleaned event files. If a bin has >2000 counts, and if more than 50% of those come from <1% of pixels, then it is considered to be noise-dominated and hence unusable.
| Quadrant | # 1 sec bins | Bins with >0 counts | Bins with >2000 counts | High rate bins dominated by noise | Noise dominated (total time) | Noise dominated (detector-on time) | Marked lightcurve |
|---|---|---|---|---|---|---|---|
| A | 8701 | 6808 | 0 | 0 | 0.00% | 0.00% | 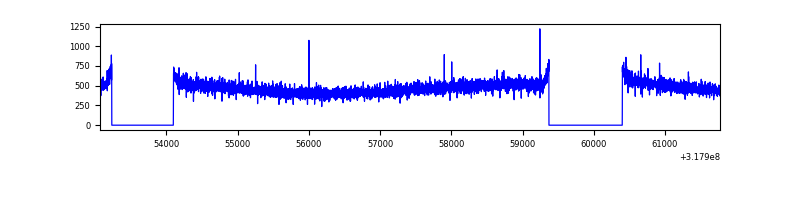 |
| B | 8701 | 6808 | 7 | 7 | 0.08% | 0.10% | 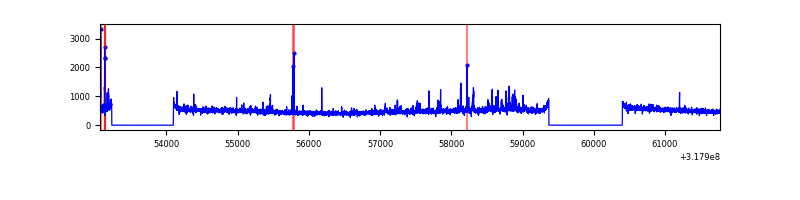 |
| C | 8701 | 6807 | 0 | 0 | 0.00% | 0.00% | 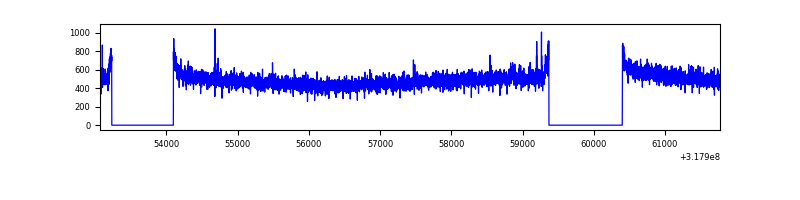 |
| D | 8701 | 6807 | 1115 | 1115 | 12.81% | 16.38% | 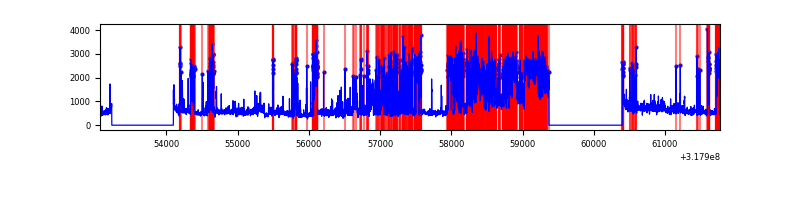 |
Top three noisy pixels from each quadrant. If the there are fewer than three noisy pixels in the level2.evt file, extra rows are filled as -1
| Pixel properties | Quadrant properties | ||||||
|---|---|---|---|---|---|---|---|
| Quadrant | DetID | PixID | Counts | Sigma | Mean | Median | Sigma |
| A | 13 | 254 | 11604 | 64.12 | 833 | 814 | 168.3 |
| A | 0 | 226 | 7388 | 39.06 | 833 | 814 | 168.3 |
| A | 3 | 137 | 7215 | 38.04 | 833 | 814 | 168.3 |
| B | 0 | 229 | 68559 | 424.11 | 838 | 815 | 159.7 |
| B | 0 | 189 | 64254 | 397.16 | 838 | 815 | 159.7 |
| B | 5 | 172 | 24936 | 151.01 | 838 | 815 | 159.7 |
| C | 14 | 238 | 127637 | 667.36 | 812 | 817 | 190.0 |
| C | 3 | 233 | 17326 | 86.87 | 812 | 817 | 190.0 |
| C | 1 | 16 | 13196 | 65.14 | 812 | 817 | 190.0 |
| D | 7 | 238 | 3622699 | 20076.8 | 750 | 729 | 180.4 |
| D | 1 | 52 | 323962 | 1791.7 | 750 | 729 | 180.4 |
| D | 12 | 233 | 111078 | 611.67 | 750 | 729 | 180.4 |
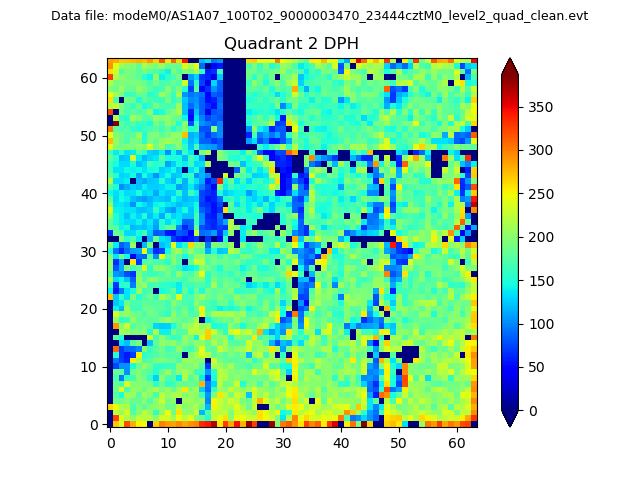
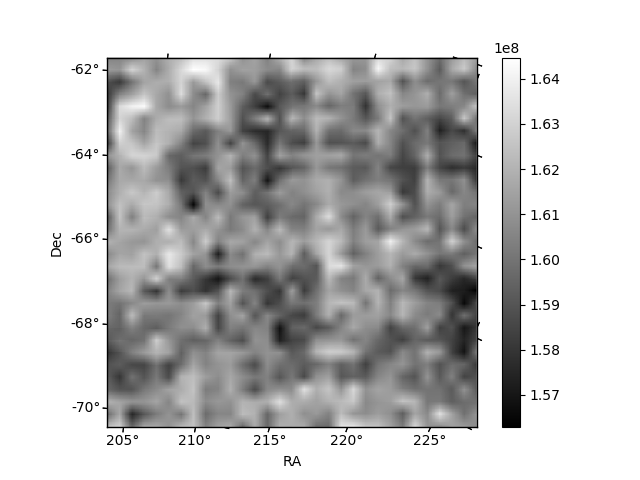
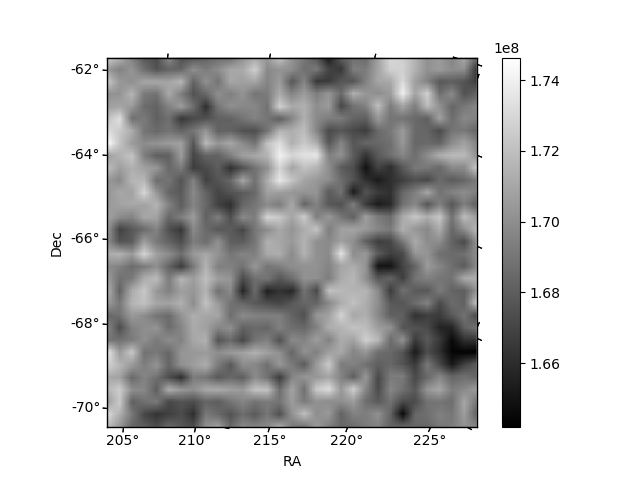
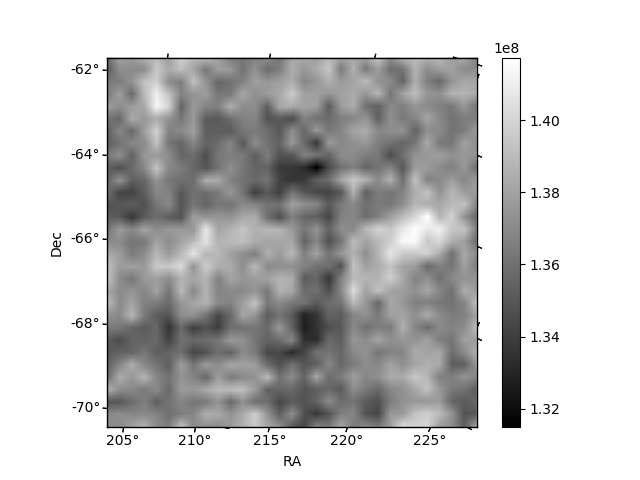
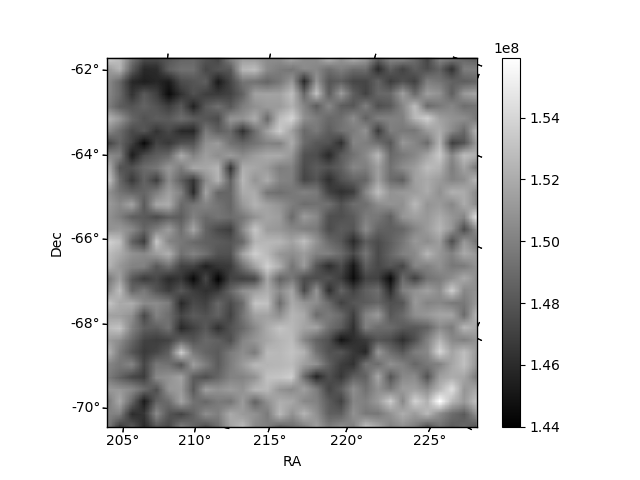
Histogram calculated using DETX and DETY for each event in the final _common_clean file
| Quadrant A | 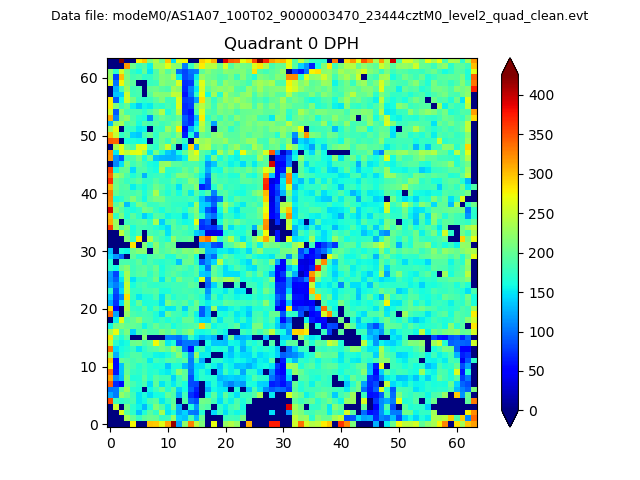 |
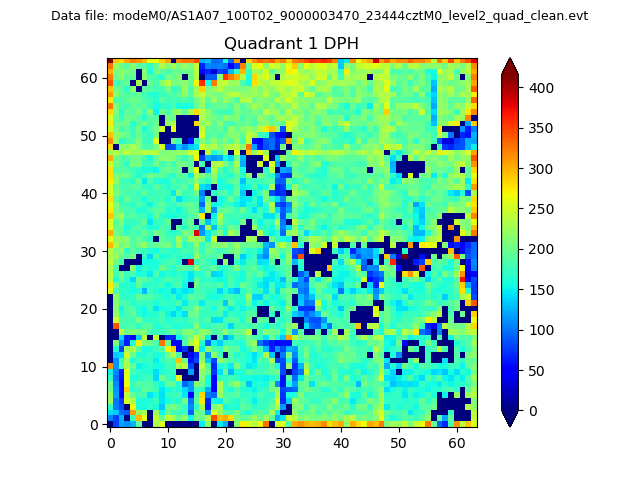 |
Quadrant B |
|---|---|---|---|
| Quadrant D | 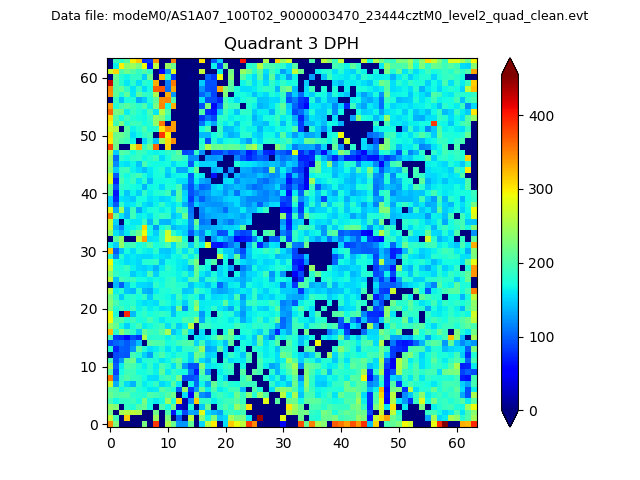 |
 |
Quadrant C |
| Plot type | Count rate plots | Images |
|---|---|---|
| Comparison with Poisson distribution Blue bars denote a histogram of data divided into 1 sec bins. Red curve is a Poisson curve with rate = median count rate of data. |
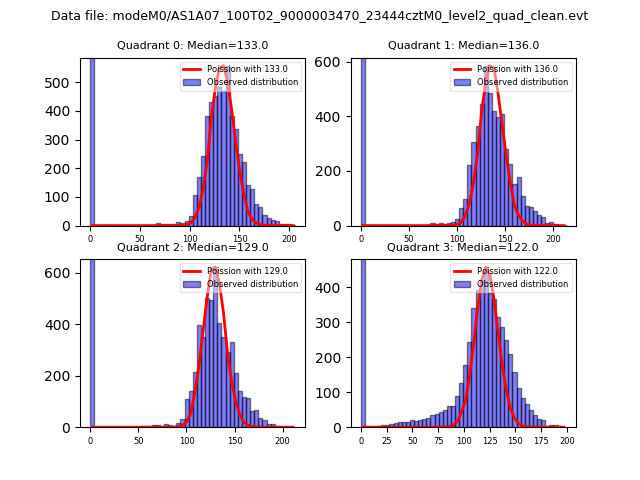 |
 |
| Quadrant-wise count rates Data is divided into 100 sec bins |
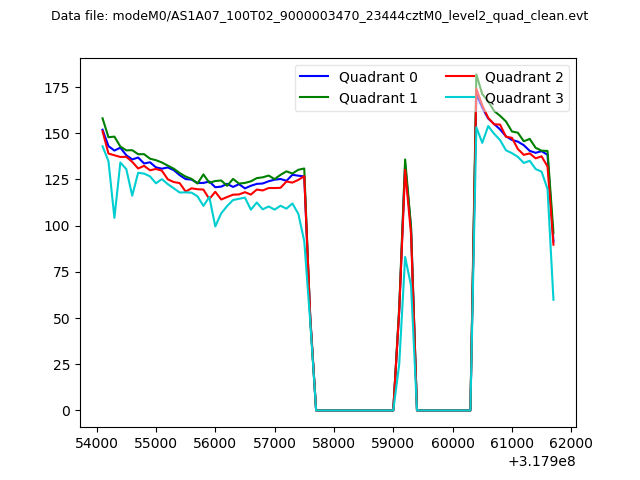 |
|
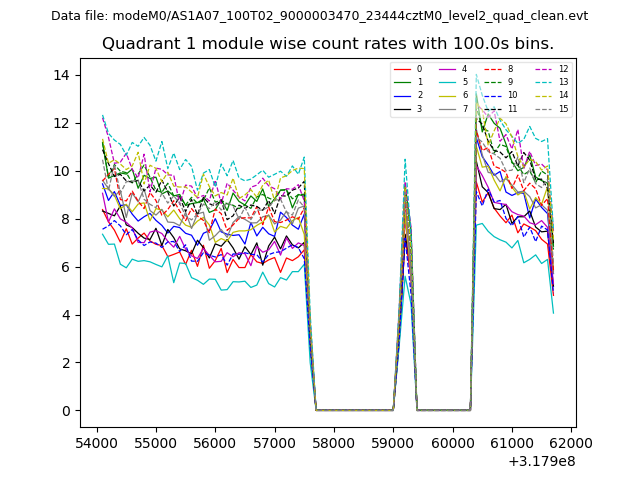
| Module-wise count rates for Quadrant A Data is divided into 100 sec bins |
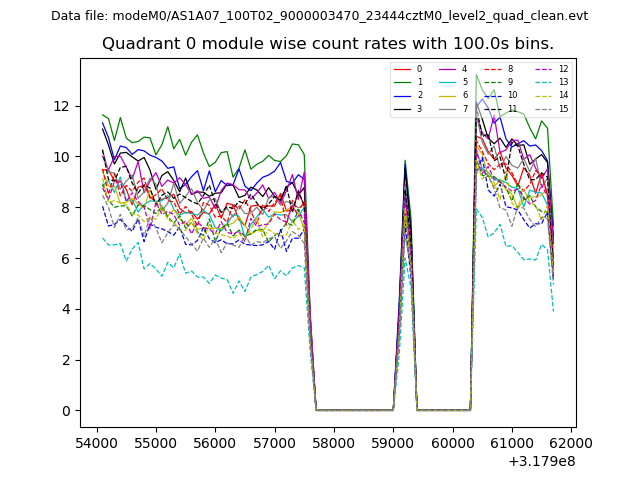 |
 |
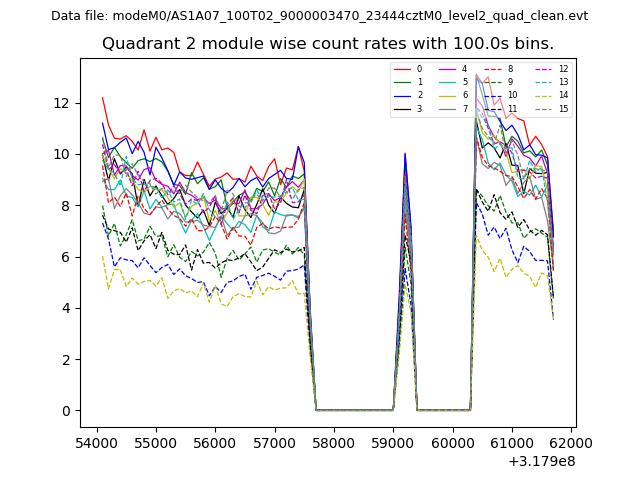
| Module-wise count rates for Quadrant B Data is divided into 100 sec bins |
 |
 |
| Module-wise count rates for Quadrant C Data is divided into 100 sec bins |
 |
 |
| Module-wise count rates for Quadrant D Data is divided into 100 sec bins |
 |
 |
| Parameter | Plot |
|---|---|
| CZT HV Monitor |  |
| D_VDD | 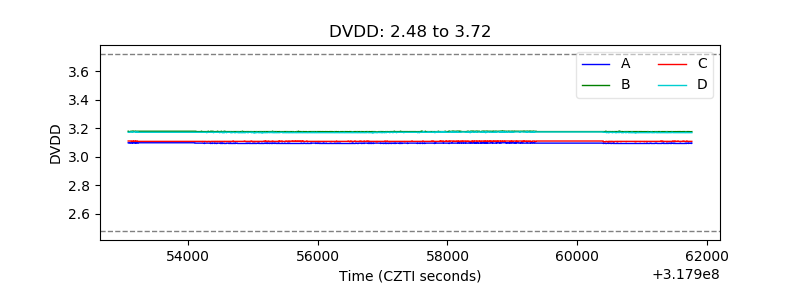 |
| Temperature 1 |  |
| Veto HV Monitor | 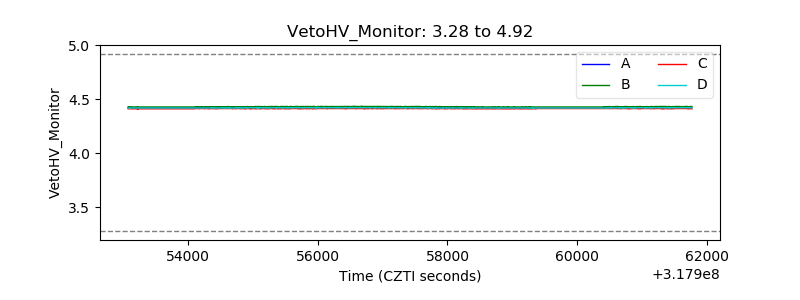 |
| Veto LLD | 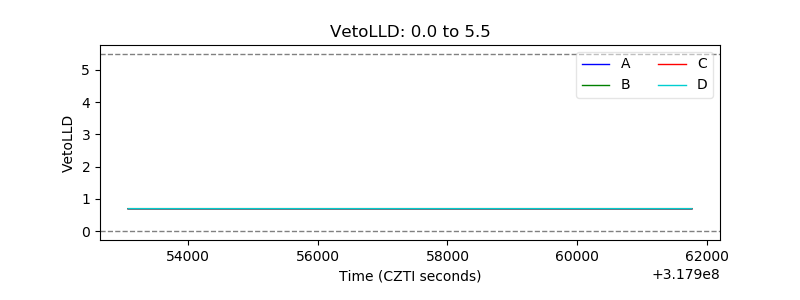 |
| Alpha Counter | 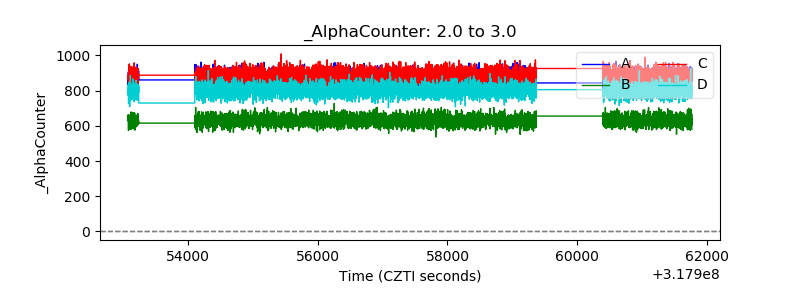 |
| _CPM_Rate | 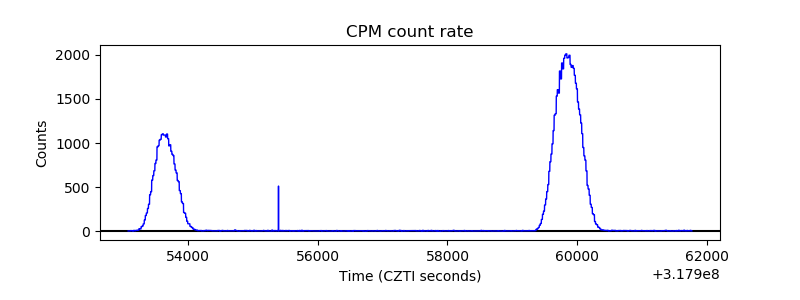 |
| CZT Counter | 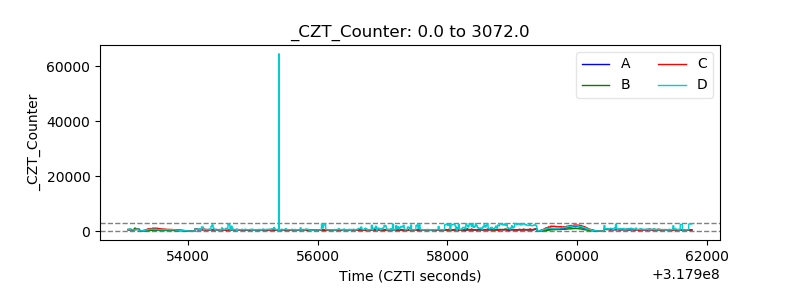 |
| +2.5 Volts monitor |  |
| +5 Volts monitor | 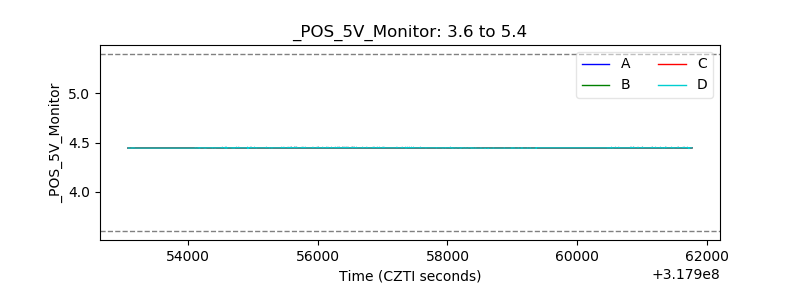 |
| _ROLL_ROT | 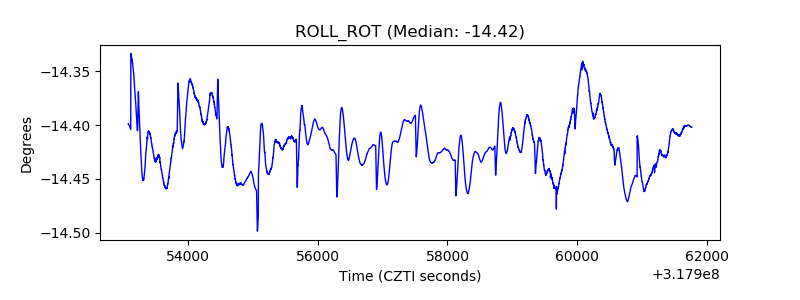 |
| _Roll_DEC | 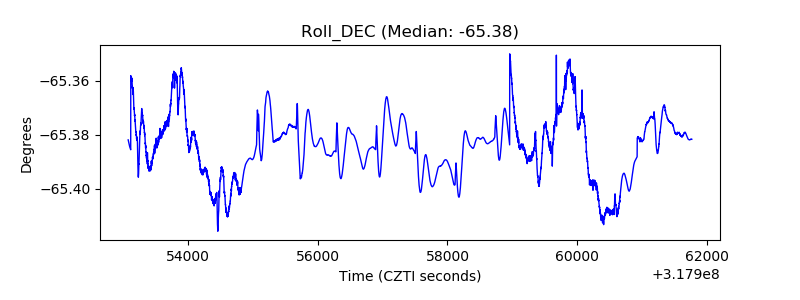 |
| _Roll_RA | 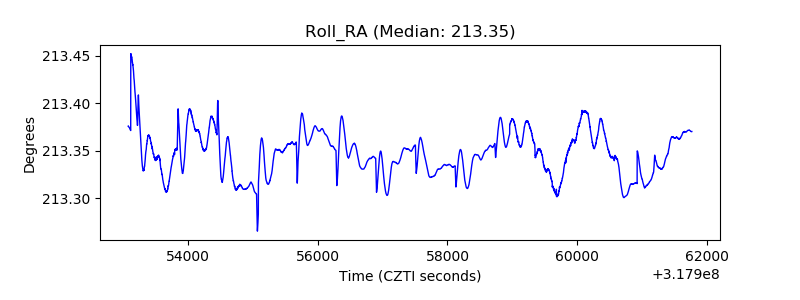 |
| Veto Counter | 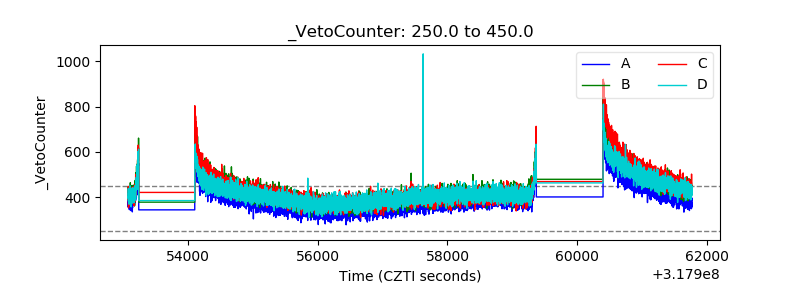 |