| Param | Original file | Final file |
|---|---|---|
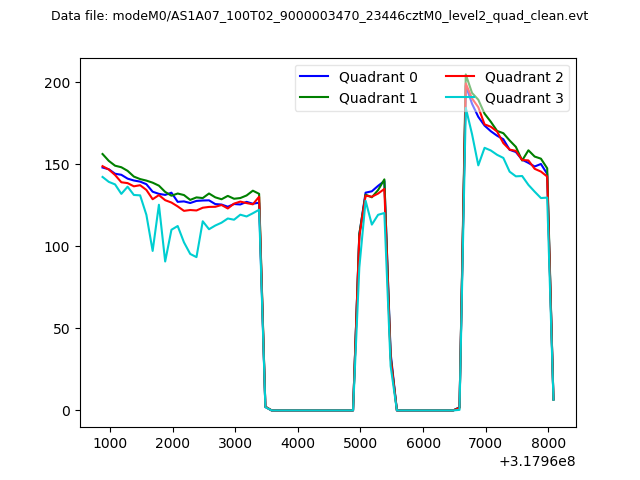
| Filename | modeM0/AS1A07_100T02_9000003470_23446cztM0_level2.evt | modeM0/AS1A07_100T02_9000003470_23446cztM0_level2_quad_clean.evt |
| Size (bytes) | 538,309,440 | 97,084,800 |
| Size | 513.4 MB | 92.6 MB |
| Events in quadrant A | 2,893,200 | 644,085 |
| Events in quadrant B | 3,211,250 | 660,628 |
| Events in quadrant C | 3,066,793 | 637,362 |
| Events in quadrant D | 6,721,925 | 575,703 |
| Mode M0 | |||
|---|---|---|---|
| Quadrant | BADHDUFLAG | Total packets | Discarded packets |
| A | 0 | 12415 | 1 |
| B | 0 | 13449 | 1 |
| C | 0 | 12763 | 1 |
| D | 0 | 24157 | 1 |
| Mode M9 | |||
|---|---|---|---|
| Quadrant | BADHDUFLAG | Total packets | Discarded packets |
| A | 0 | 11 | 0 |
| B | 0 | 11 | 0 |
| C | 0 | 11 | 0 |
| D | 0 | 11 | 0 |
| Mode SS | |||
|---|---|---|---|
| Quadrant | BADHDUFLAG | Total packets | Discarded packets |
| A | 0 | 126 | 0 |
| B | 0 | 126 | 0 |
| C | 0 | 126 | 0 |
| D | 0 | 126 | 0 |
| Quadrant | Total seconds | Saturated seconds | Saturation percentage |
|---|---|---|---|
| A | 6034 | 16 | 0.265164% |
| B | 6034 | 66 | 1.093802% |
| C | 6034 | 59 | 0.977793% |
| D | 6034 | 684 | 11.335764% |
Noise dominated data is calculated using 1-second bins in cleaned event files. If a bin has >2000 counts, and if more than 50% of those come from <1% of pixels, then it is considered to be noise-dominated and hence unusable.
| Quadrant | # 1 sec bins | Bins with >0 counts | Bins with >2000 counts | High rate bins dominated by noise | Noise dominated (total time) | Noise dominated (detector-on time) | Marked lightcurve |
|---|---|---|---|---|---|---|---|
| A | 7209 | 6035 | 0 | 0 | 0.00% | 0.00% | 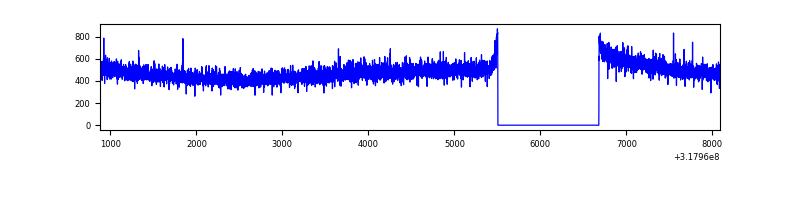 |
| B | 7209 | 6035 | 23 | 23 | 0.32% | 0.38% | 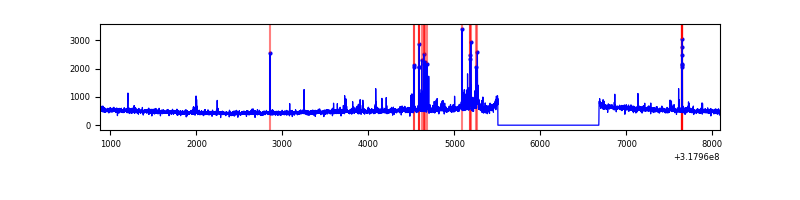 |
| C | 7209 | 6035 | 0 | 0 | 0.00% | 0.00% | 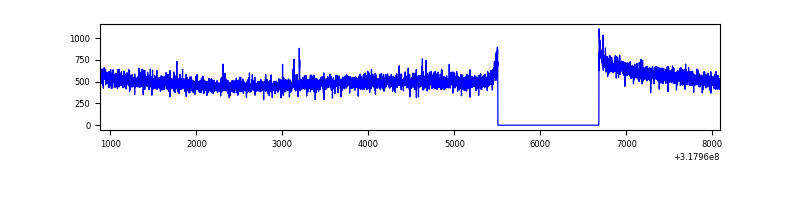 |
| D | 7209 | 6034 | 611 | 611 | 8.48% | 10.13% | 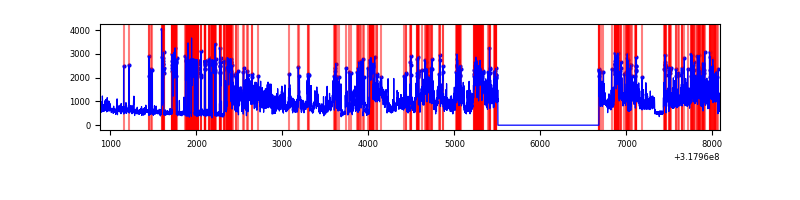 |
Top three noisy pixels from each quadrant. If the there are fewer than three noisy pixels in the level2.evt file, extra rows are filled as -1
| Pixel properties | Quadrant properties | ||||||
|---|---|---|---|---|---|---|---|
| Quadrant | DetID | PixID | Counts | Sigma | Mean | Median | Sigma |
| A | 13 | 254 | 10055 | 61.72 | 749 | 732 | 151.0 |
| A | 0 | 226 | 6429 | 37.72 | 749 | 732 | 151.0 |
| A | 3 | 137 | 6185 | 36.1 | 749 | 732 | 151.0 |
| B | 0 | 229 | 117954 | 819.71 | 754 | 736 | 143.0 |
| B | 0 | 189 | 58595 | 404.61 | 754 | 736 | 143.0 |
| B | 0 | 190 | 35750 | 244.85 | 754 | 736 | 143.0 |
| C | 14 | 238 | 118224 | 680.35 | 741 | 745 | 172.7 |
| C | 1 | 16 | 36572 | 207.48 | 741 | 745 | 172.7 |
| C | 7 | 247 | 12311 | 66.98 | 741 | 745 | 172.7 |
| D | 7 | 238 | 3515231 | 20187.35 | 716 | 696 | 174.1 |
| D | 1 | 52 | 179905 | 1029.37 | 716 | 696 | 174.1 |
| D | 12 | 233 | 99789 | 569.19 | 716 | 696 | 174.1 |
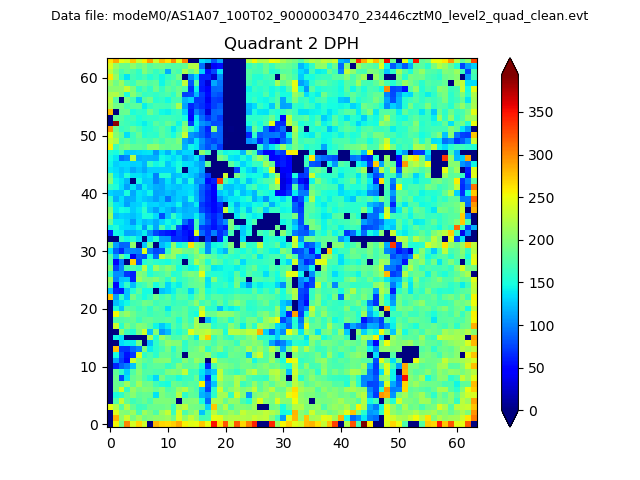
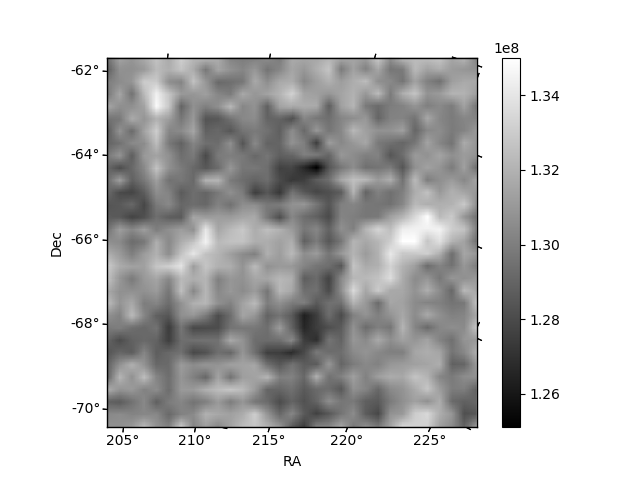
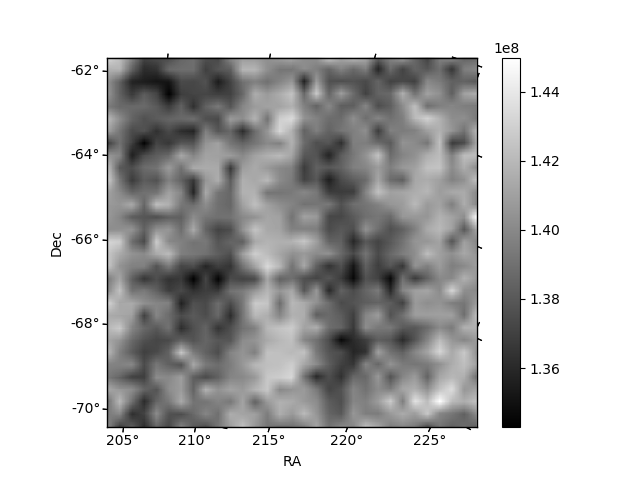
Histogram calculated using DETX and DETY for each event in the final _common_clean file
| Quadrant A | 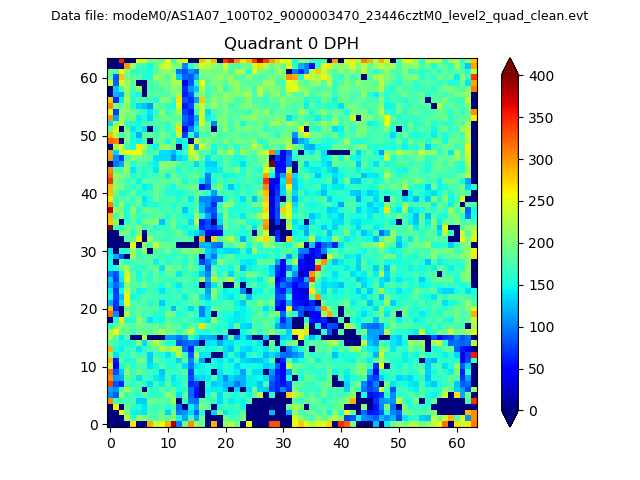 |
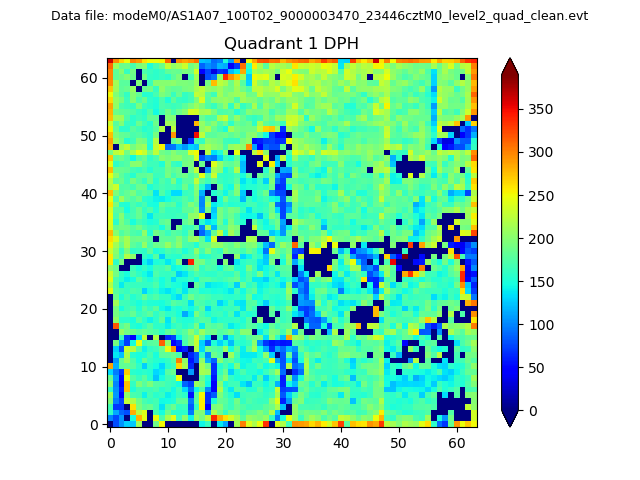 |
Quadrant B |
|---|---|---|---|
| Quadrant D | 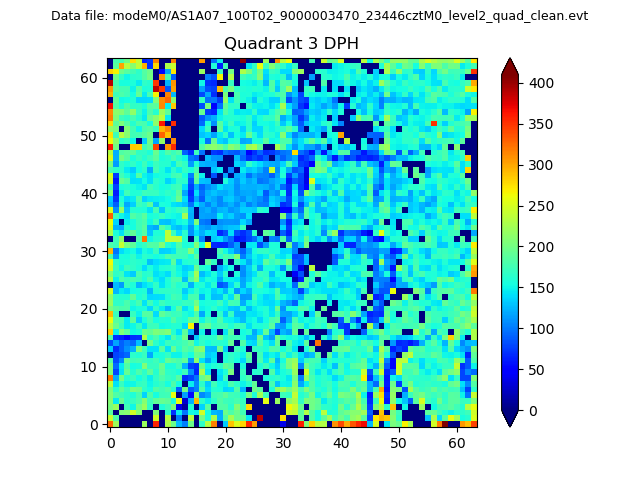 |
 |
Quadrant C |
| Plot type | Count rate plots | Images |
|---|---|---|
| Comparison with Poisson distribution Blue bars denote a histogram of data divided into 1 sec bins. Red curve is a Poisson curve with rate = median count rate of data. |
 |
 |
| Quadrant-wise count rates Data is divided into 100 sec bins |
 |
|
| Module-wise count rates for Quadrant A Data is divided into 100 sec bins |
 |
 |
| Module-wise count rates for Quadrant B Data is divided into 100 sec bins |
 |
 |
| Module-wise count rates for Quadrant C Data is divided into 100 sec bins |
 |
 |
| Module-wise count rates for Quadrant D Data is divided into 100 sec bins |
 |
 |
| Parameter | Plot |
|---|---|
| CZT HV Monitor | 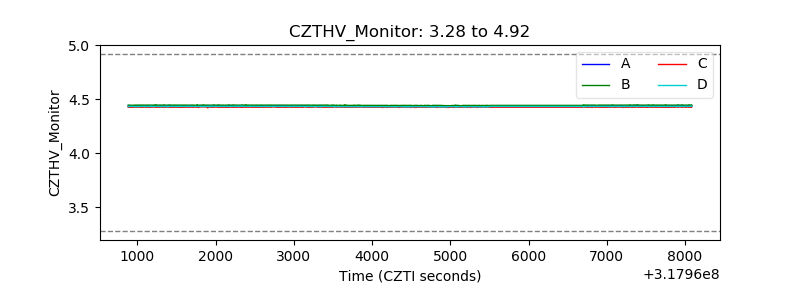 |
| D_VDD | 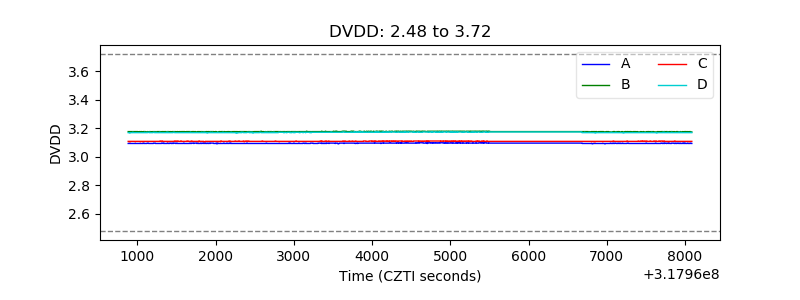 |
| Temperature 1 |  |
| Veto HV Monitor | 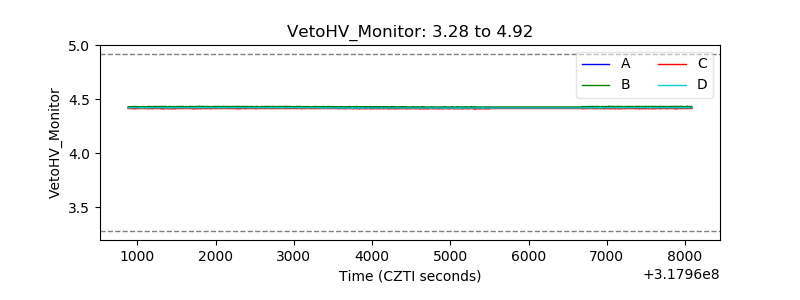 |
| Veto LLD | 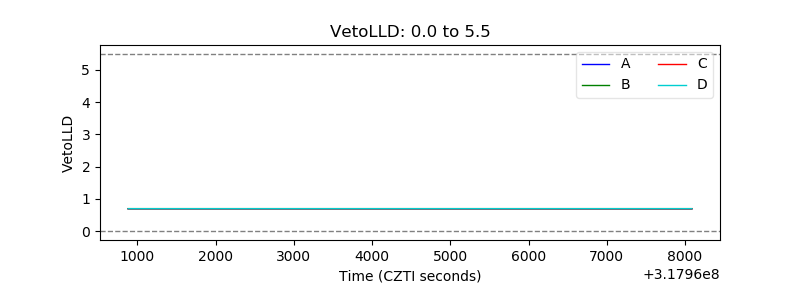 |
| Alpha Counter | 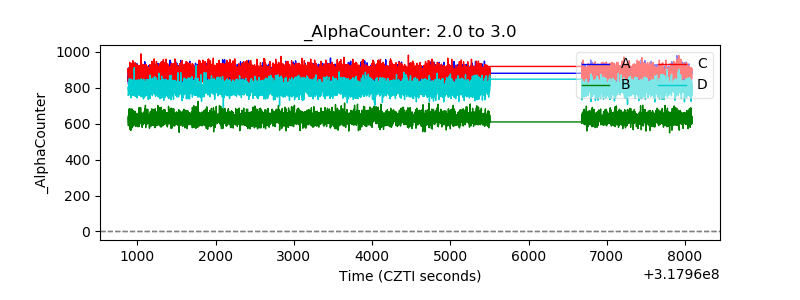 |
| _CPM_Rate | 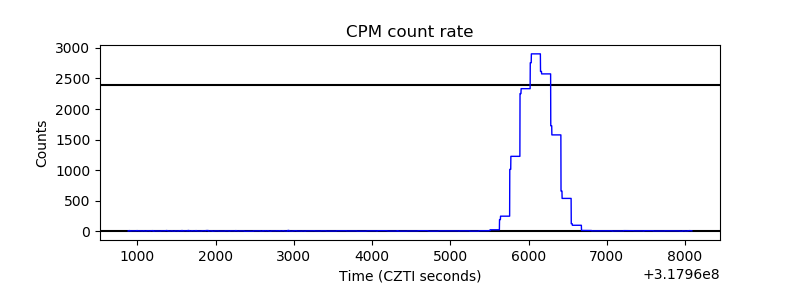 |
| CZT Counter | 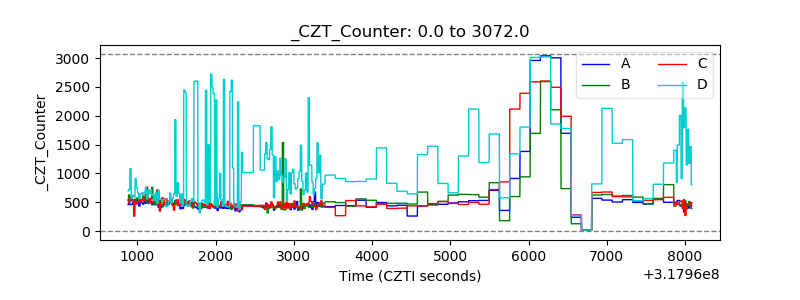 |
| +2.5 Volts monitor |  |
| +5 Volts monitor |  |
| _ROLL_ROT |  |
| _Roll_DEC |  |
| _Roll_RA | 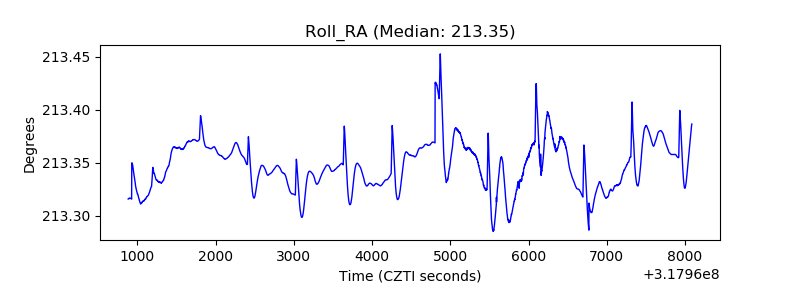 |
| Veto Counter |  |