| Param | Original file | Final file |
|---|---|---|
| Filename | modeM0/AS1A07_100T02_9000003470_23447cztM0_level2.evt | modeM0/AS1A07_100T02_9000003470_23447cztM0_level2_quad_clean.evt |
| Size (bytes) | 614,750,400 | 101,390,400 |
| Size | 586.3 MB | 96.7 MB |
| Events in quadrant A | 3,006,285 | 691,158 |
| Events in quadrant B | 3,199,892 | 710,953 |
| Events in quadrant C | 3,182,587 | 687,865 |
| Events in quadrant D | 8,825,632 | 563,907 |
| Mode M0 | |||
|---|---|---|---|
| Quadrant | BADHDUFLAG | Total packets | Discarded packets |
| A | 0 | 12870 | 311 |
| B | 0 | 13498 | 328 |
| C | 0 | 13426 | 384 |
| D | 0 | 31293 | 889 |
| Mode M9 | |||
|---|---|---|---|
| Quadrant | BADHDUFLAG | Total packets | Discarded packets |
| A | 0 | 13 | 0 |
| B | 0 | 13 | 0 |
| C | 0 | 13 | 0 |
| D | 0 | 13 | 0 |
| Mode SS | |||
|---|---|---|---|
| Quadrant | BADHDUFLAG | Total packets | Discarded packets |
| A | 0 | 124 | 4 |
| B | 0 | 124 | 2 |
| C | 0 | 124 | 2 |
| D | 0 | 124 | 4 |
| Quadrant | Total seconds | Saturated seconds | Saturation percentage |
|---|---|---|---|
| A | 5964 | 12 | 0.201207% |
| B | 5974 | 35 | 0.585872% |
| C | 5964 | 56 | 0.938967% |
| D | 5939 | 1723 | 29.011618% |
Noise dominated data is calculated using 1-second bins in cleaned event files. If a bin has >2000 counts, and if more than 50% of those come from <1% of pixels, then it is considered to be noise-dominated and hence unusable.
| Quadrant | # 1 sec bins | Bins with >0 counts | Bins with >2000 counts | High rate bins dominated by noise | Noise dominated (total time) | Noise dominated (detector-on time) | Marked lightcurve |
|---|---|---|---|---|---|---|---|
| A | 7371 | 5993 | 0 | 0 | 0.00% | 0.00% | 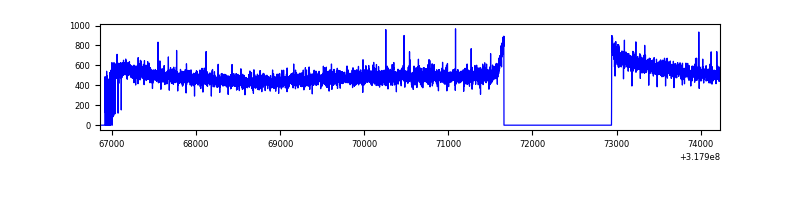 |
| B | 7352 | 5998 | 13 | 13 | 0.18% | 0.22% | 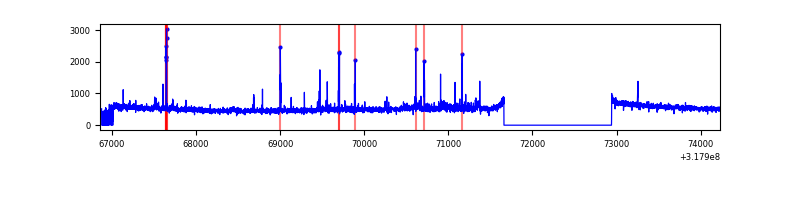 |
| C | 7317 | 5982 | 0 | 0 | 0.00% | 0.00% | 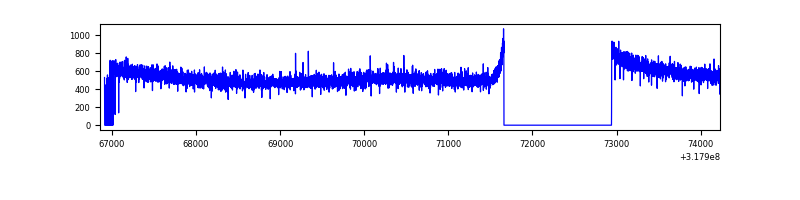 |
| D | 7241 | 5947 | 1637 | 1637 | 22.61% | 27.53% | 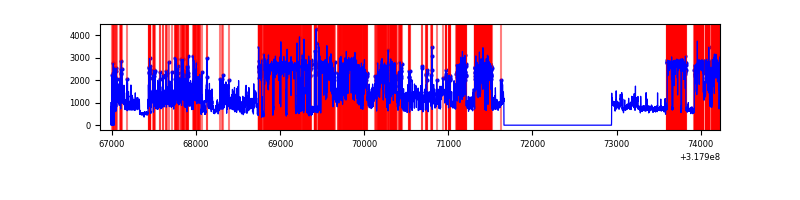 |
Top three noisy pixels from each quadrant. If the there are fewer than three noisy pixels in the level2.evt file, extra rows are filled as -1
| Pixel properties | Quadrant properties | ||||||
|---|---|---|---|---|---|---|---|
| Quadrant | DetID | PixID | Counts | Sigma | Mean | Median | Sigma |
| A | 13 | 254 | 10081 | 60.26 | 779 | 765 | 154.6 |
| A | 0 | 226 | 6614 | 37.83 | 779 | 765 | 154.6 |
| A | 3 | 137 | 5995 | 33.83 | 779 | 765 | 154.6 |
| B | 5 | 172 | 44834 | 305.43 | 780 | 765 | 144.3 |
| B | 0 | 190 | 32989 | 223.33 | 780 | 765 | 144.3 |
| B | 0 | 229 | 24357 | 163.51 | 780 | 765 | 144.3 |
| C | 14 | 238 | 122231 | 680.02 | 771 | 777 | 178.6 |
| C | 1 | 16 | 41159 | 226.1 | 771 | 777 | 178.6 |
| C | 7 | 247 | 13145 | 69.25 | 771 | 777 | 178.6 |
| D | 7 | 238 | 3848152 | 23336.89 | 689 | 669 | 164.9 |
| D | 1 | 52 | 2138497 | 12966.98 | 689 | 669 | 164.9 |
| D | 5 | 172 | 142961 | 863.07 | 689 | 669 | 164.9 |
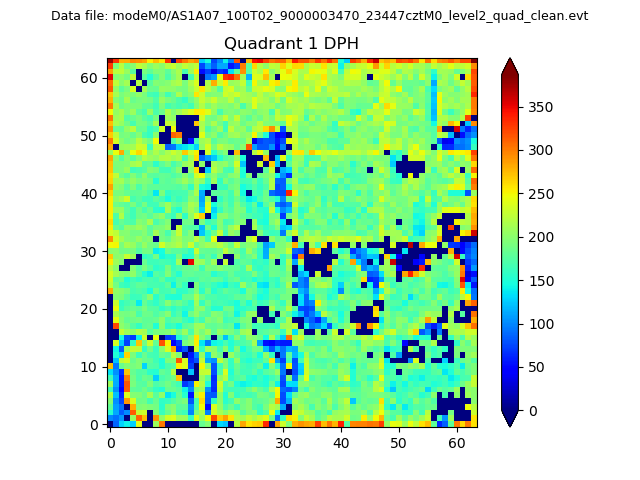
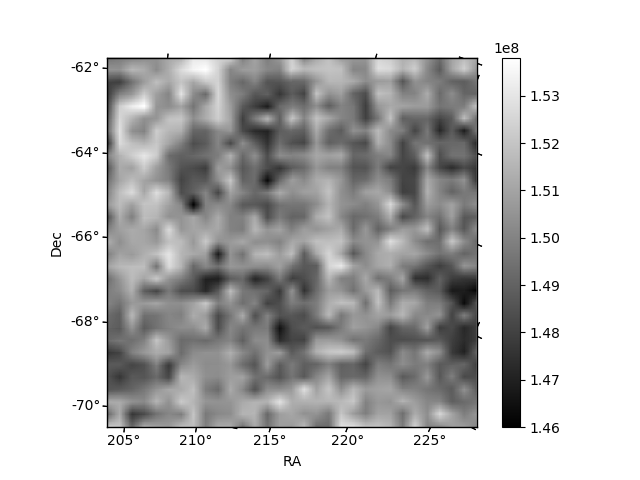
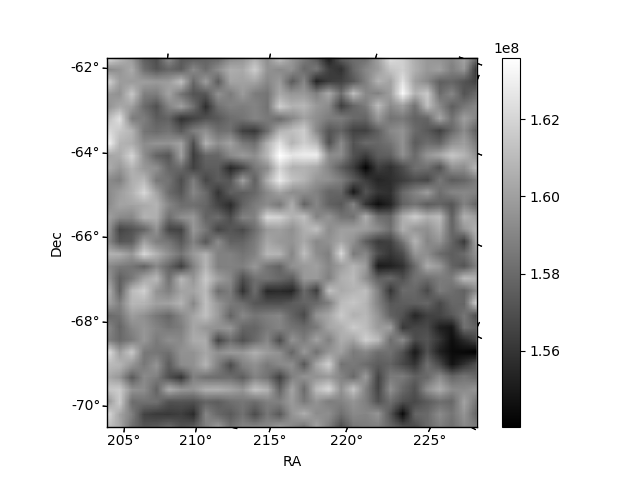
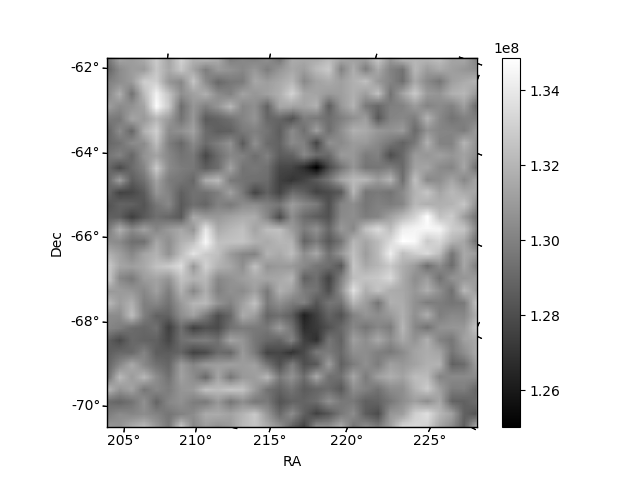
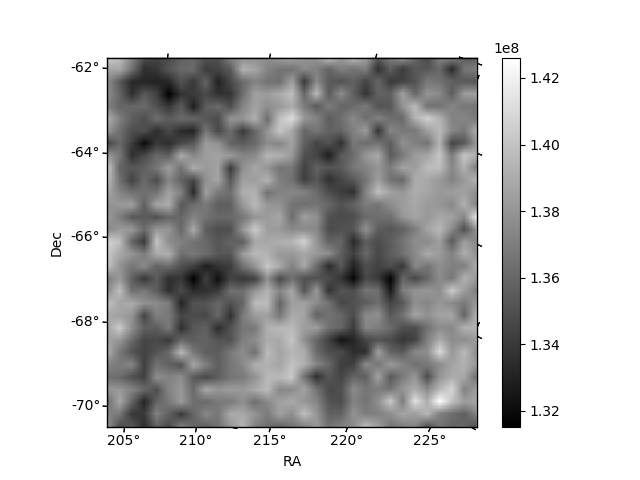
Histogram calculated using DETX and DETY for each event in the final _common_clean file
| Quadrant A |  |
 |
Quadrant B |
|---|---|---|---|
| Quadrant D |  |
 |
Quadrant C |
| Plot type | Count rate plots | Images |
|---|---|---|
| Comparison with Poisson distribution Blue bars denote a histogram of data divided into 1 sec bins. Red curve is a Poisson curve with rate = median count rate of data. |
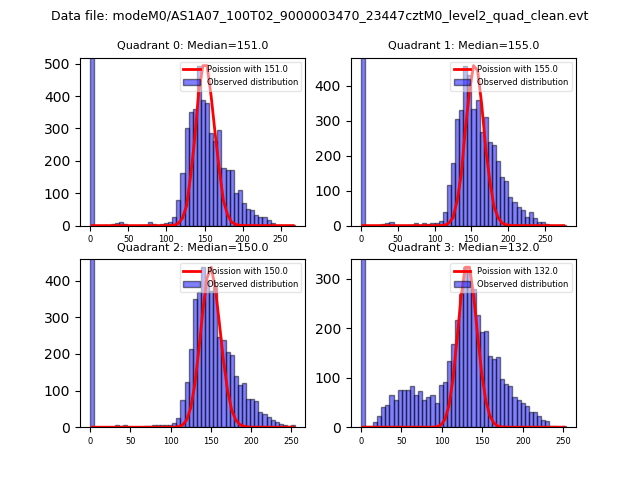 |
 |
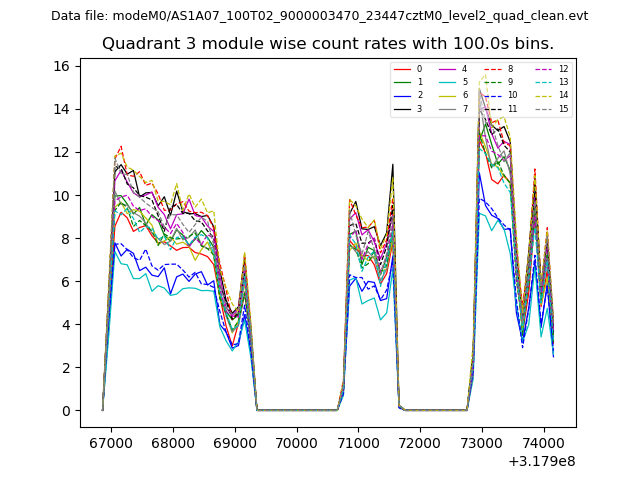
| Quadrant-wise count rates Data is divided into 100 sec bins |
 |
|
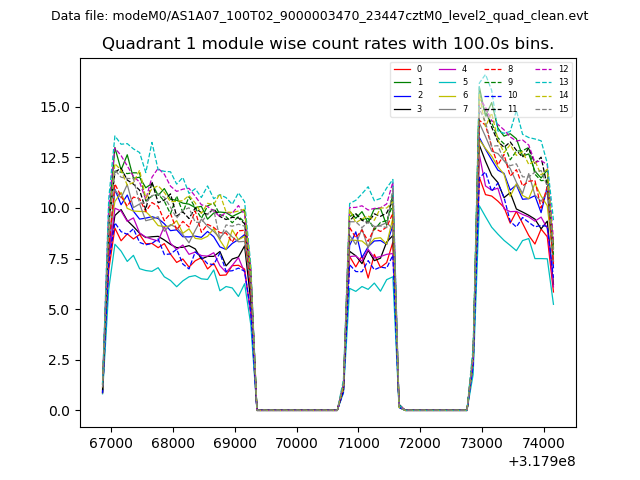
| Module-wise count rates for Quadrant A Data is divided into 100 sec bins |
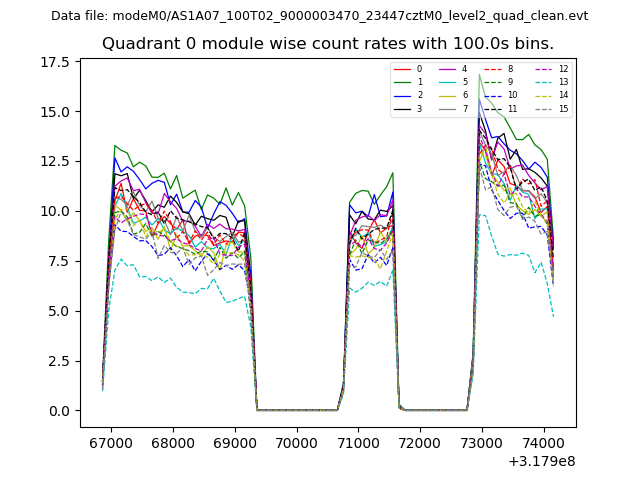 |
 |
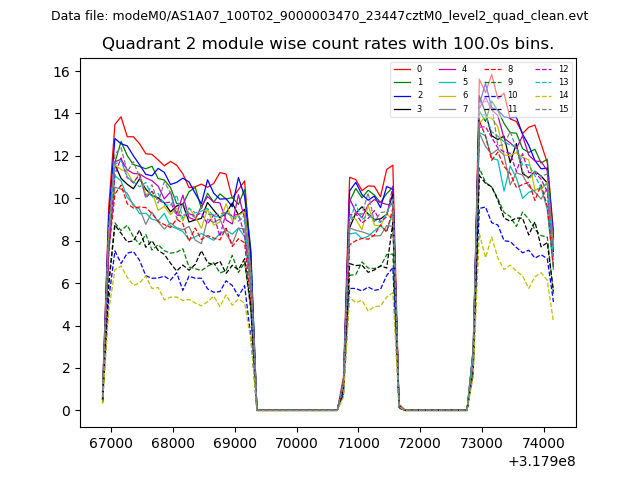
| Module-wise count rates for Quadrant B Data is divided into 100 sec bins |
 |
 |
| Module-wise count rates for Quadrant C Data is divided into 100 sec bins |
 |
 |
| Module-wise count rates for Quadrant D Data is divided into 100 sec bins |
 |
 |
| Parameter | Plot |
|---|---|
| CZT HV Monitor | 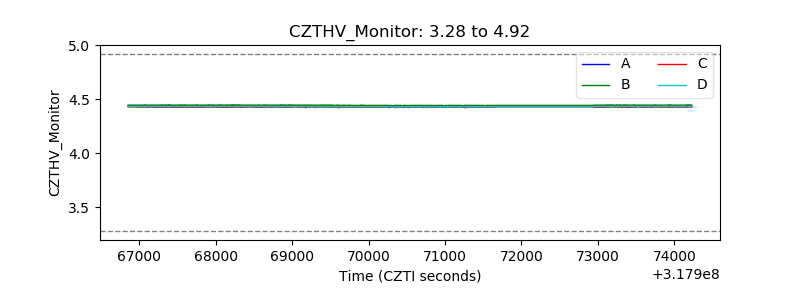 |
| D_VDD | 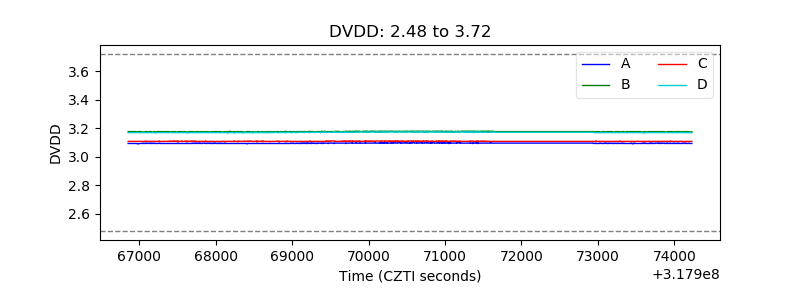 |
| Temperature 1 | 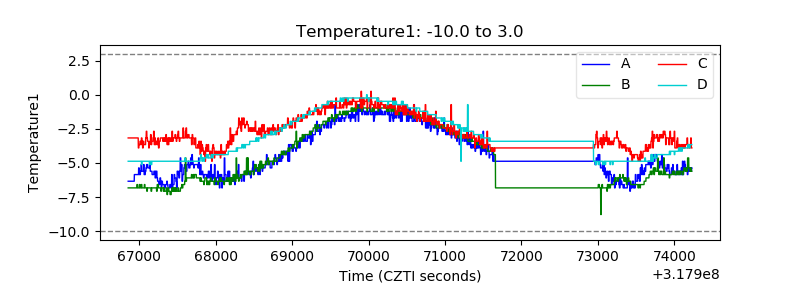 |
| Veto HV Monitor | 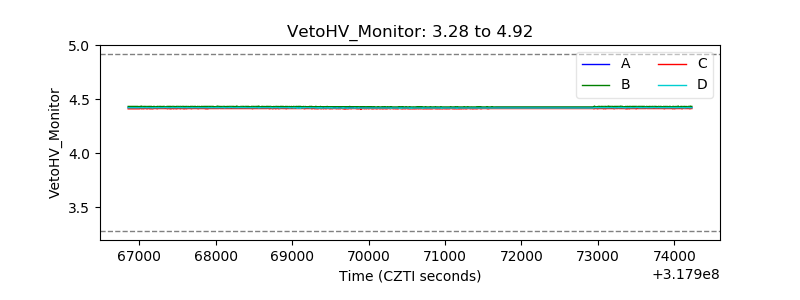 |
| Veto LLD | 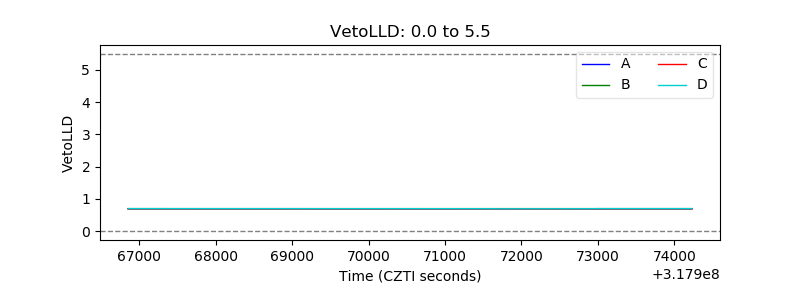 |
| Alpha Counter | 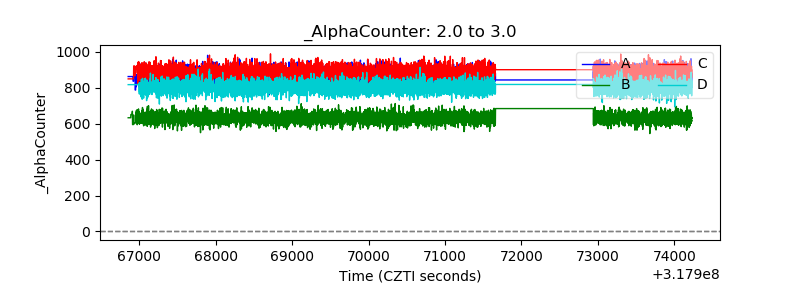 |
| _CPM_Rate | 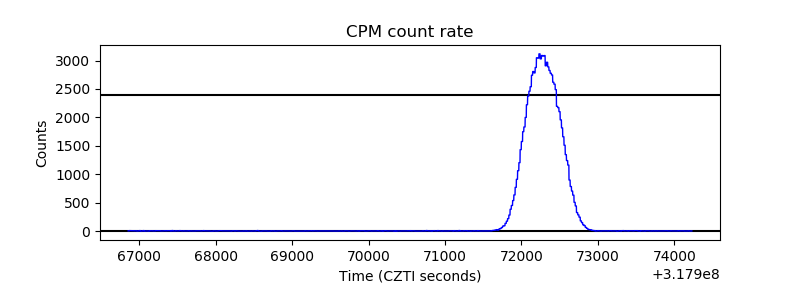 |
| CZT Counter |  |
| +2.5 Volts monitor |  |
| +5 Volts monitor |  |
| _ROLL_ROT | 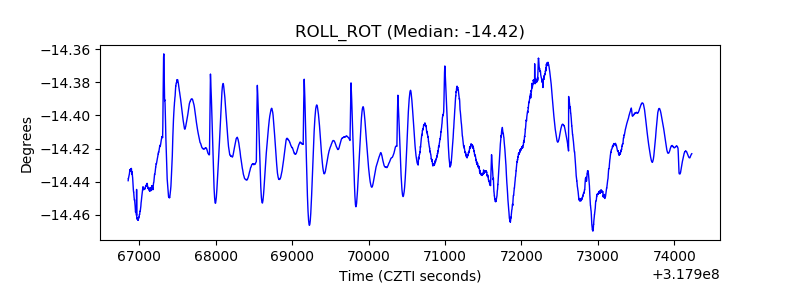 |
| _Roll_DEC | 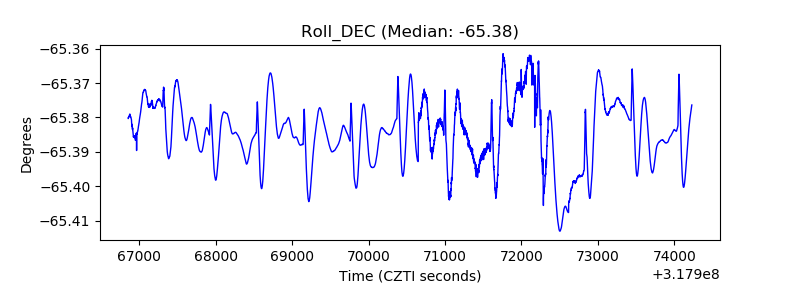 |
| _Roll_RA | 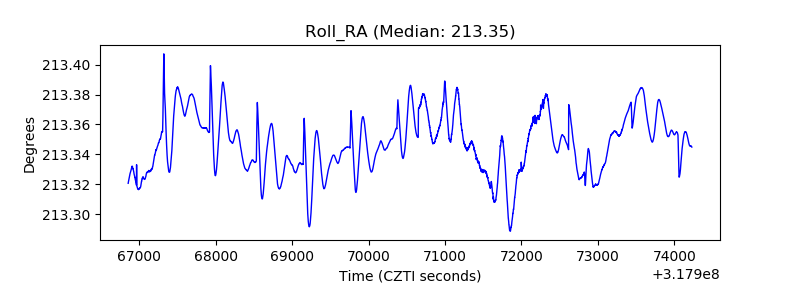 |
| Veto Counter | 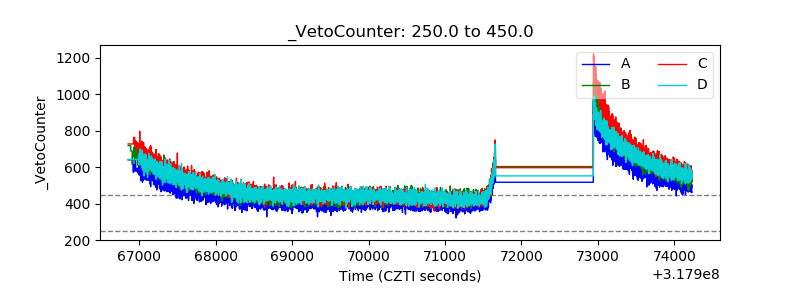 |