| Param | Original file | Final file |
|---|---|---|
| Filename | modeM0/AS1A07_100T02_9000003470_23451cztM0_level2.evt | modeM0/AS1A07_100T02_9000003470_23451cztM0_level2_quad_clean.evt |
| Size (bytes) | 560,545,920 | 92,681,280 |
| Size | 534.6 MB | 88.4 MB |
| Events in quadrant A | 3,549,118 | 601,302 |
| Events in quadrant B | 3,506,567 | 600,749 |
| Events in quadrant C | 3,381,468 | 581,083 |
| Events in quadrant D | 6,085,588 | 557,028 |
| Mode M0 | |||
|---|---|---|---|
| Quadrant | BADHDUFLAG | Total packets | Discarded packets |
| A | 0 | 14552 | 1 |
| B | 0 | 14357 | 1 |
| C | 0 | 13919 | 2 |
| D | 0 | 22655 | 1 |
| Mode M9 | |||
|---|---|---|---|
| Quadrant | BADHDUFLAG | Total packets | Discarded packets |
| A | 0 | 10 | 0 |
| B | 0 | 10 | 0 |
| C | 0 | 10 | 0 |
| D | 0 | 10 | 0 |
| Mode SS | |||
|---|---|---|---|
| Quadrant | BADHDUFLAG | Total packets | Discarded packets |
| A | 0 | 136 | 0 |
| B | 0 | 136 | 0 |
| C | 0 | 136 | 0 |
| D | 0 | 136 | 0 |
| Quadrant | Total seconds | Saturated seconds | Saturation percentage |
|---|---|---|---|
| A | 6689 | 146 | 2.182688% |
| B | 6690 | 223 | 3.333333% |
| C | 6689 | 166 | 2.481686% |
| D | 6689 | 586 | 8.760652% |
Noise dominated data is calculated using 1-second bins in cleaned event files. If a bin has >2000 counts, and if more than 50% of those come from <1% of pixels, then it is considered to be noise-dominated and hence unusable.
| Quadrant | # 1 sec bins | Bins with >0 counts | Bins with >2000 counts | High rate bins dominated by noise | Noise dominated (total time) | Noise dominated (detector-on time) | Marked lightcurve |
|---|---|---|---|---|---|---|---|
| A | 7674 | 6689 | 10 | 10 | 0.13% | 0.15% | 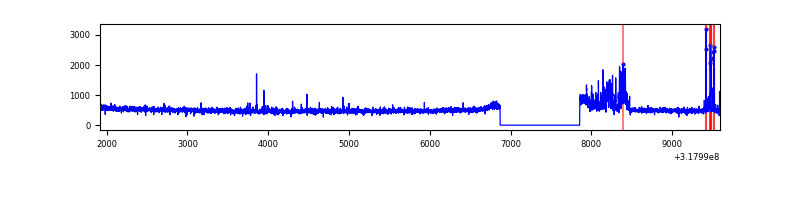 |
| B | 7675 | 6690 | 8 | 8 | 0.10% | 0.12% | 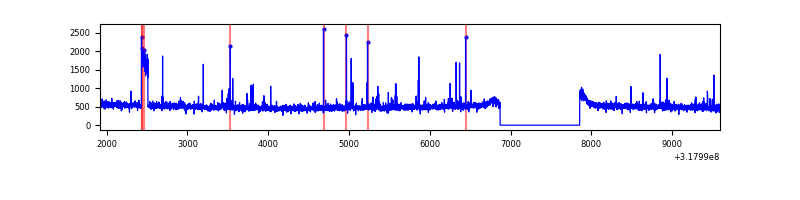 |
| C | 7674 | 6689 | 0 | 0 | 0.00% | 0.00% | 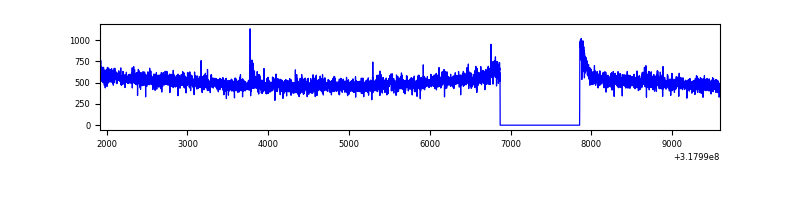 |
| D | 7674 | 6689 | 408 | 408 | 5.32% | 6.10% | 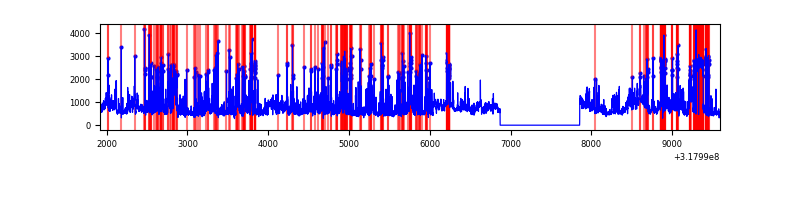 |
Top three noisy pixels from each quadrant. If the there are fewer than three noisy pixels in the level2.evt file, extra rows are filled as -1
| Pixel properties | Quadrant properties | ||||||
|---|---|---|---|---|---|---|---|
| Quadrant | DetID | PixID | Counts | Sigma | Mean | Median | Sigma |
| A | 0 | 31 | 179186 | 1052.37 | 854 | 835 | 169.5 |
| A | 12 | 96 | 72022 | 420.04 | 854 | 835 | 169.5 |
| A | 13 | 254 | 10630 | 57.8 | 854 | 835 | 169.5 |
| B | 7 | 187 | 31397 | 198.56 | 840 | 821 | 154.0 |
| B | 7 | 219 | 28572 | 180.21 | 840 | 821 | 154.0 |
| B | 7 | 251 | 25759 | 161.94 | 840 | 821 | 154.0 |
| C | 14 | 238 | 131057 | 692.9 | 820 | 826 | 188.0 |
| C | 7 | 247 | 19752 | 100.69 | 820 | 826 | 188.0 |
| C | 3 | 233 | 17578 | 89.13 | 820 | 826 | 188.0 |
| D | 1 | 52 | 1740060 | 8901.22 | 812 | 791 | 195.4 |
| D | 7 | 238 | 558459 | 2854.03 | 812 | 791 | 195.4 |
| D | 12 | 233 | 419985 | 2145.35 | 812 | 791 | 195.4 |
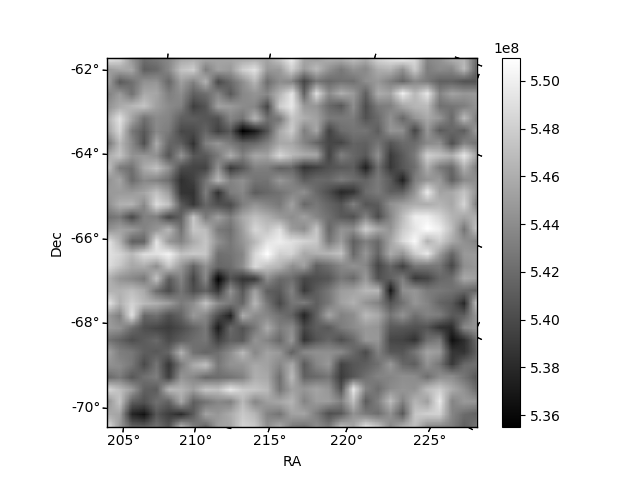
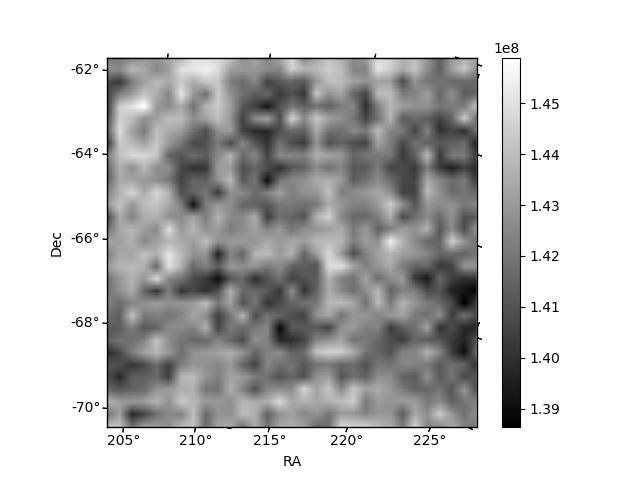
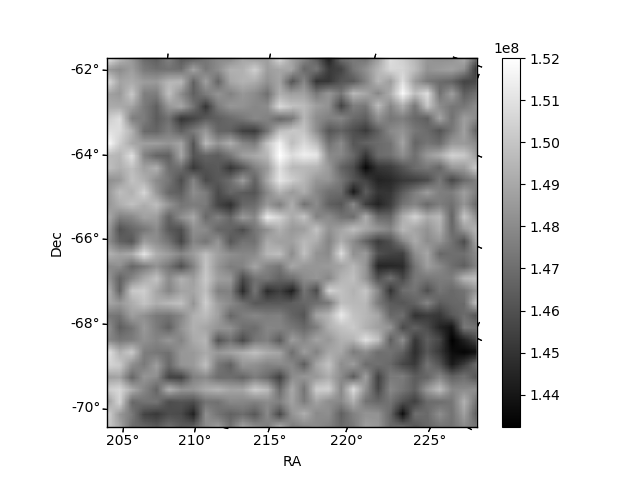
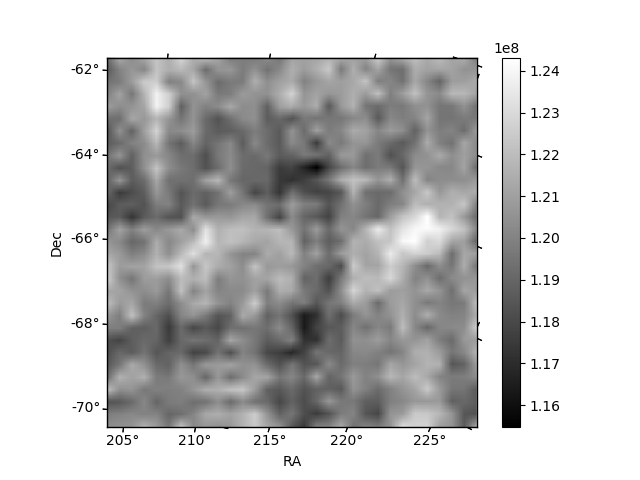
Histogram calculated using DETX and DETY for each event in the final _common_clean file
| Quadrant A | 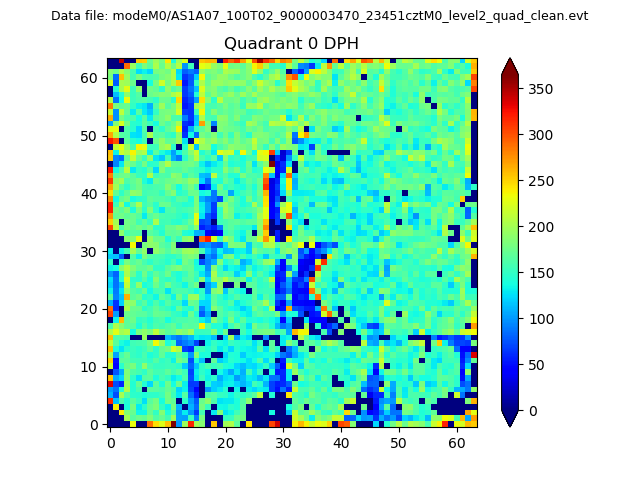 |
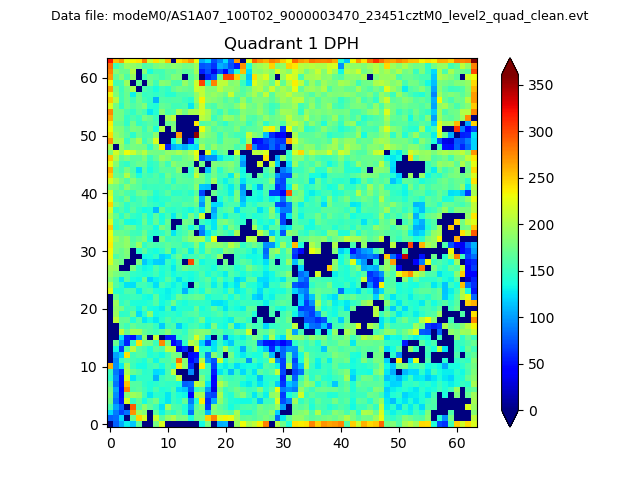 |
Quadrant B |
|---|---|---|---|
| Quadrant D |  |
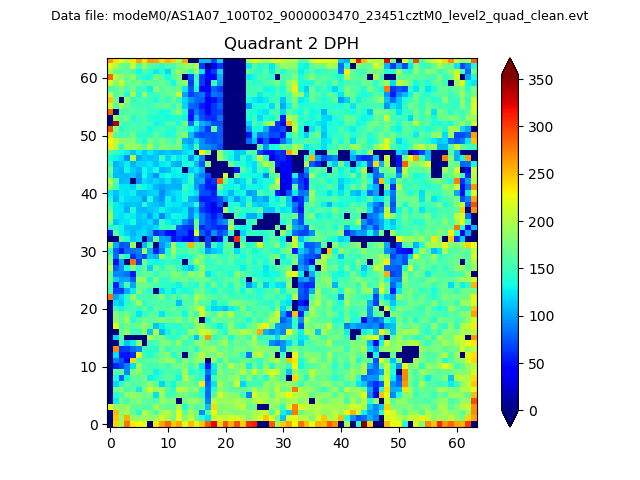 |
Quadrant C |
| Plot type | Count rate plots | Images |
|---|---|---|
| Comparison with Poisson distribution Blue bars denote a histogram of data divided into 1 sec bins. Red curve is a Poisson curve with rate = median count rate of data. |
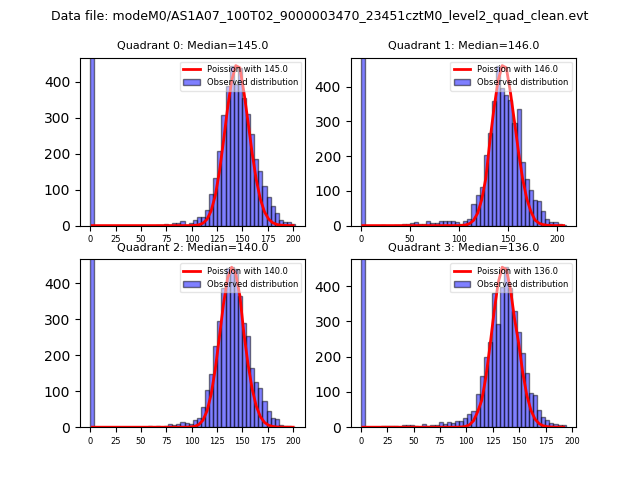 |
 |
| Quadrant-wise count rates Data is divided into 100 sec bins |
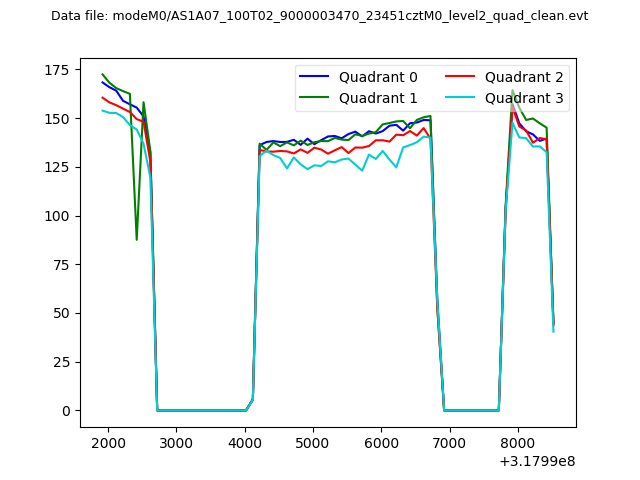 |
|
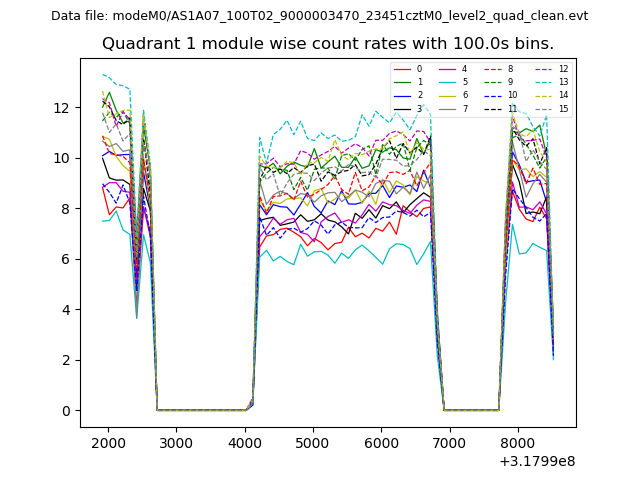
| Module-wise count rates for Quadrant A Data is divided into 100 sec bins |
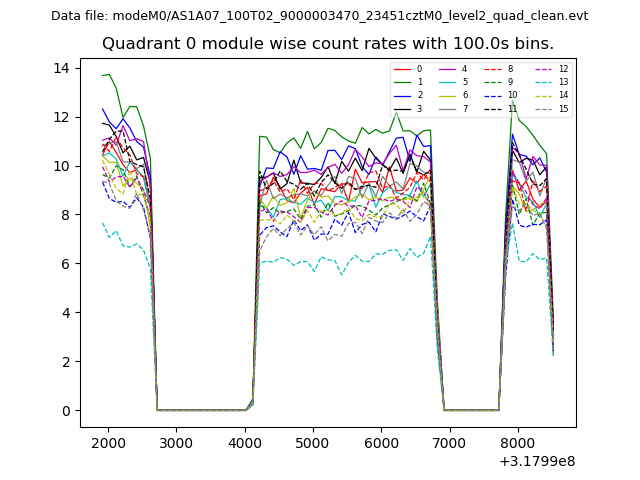 |
 |
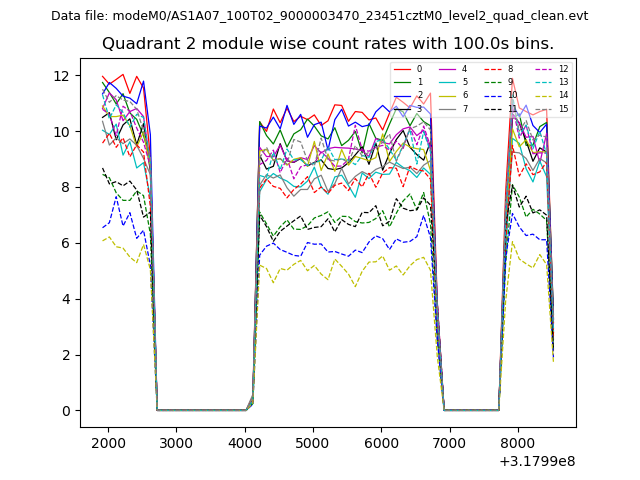
| Module-wise count rates for Quadrant B Data is divided into 100 sec bins |
 |
 |
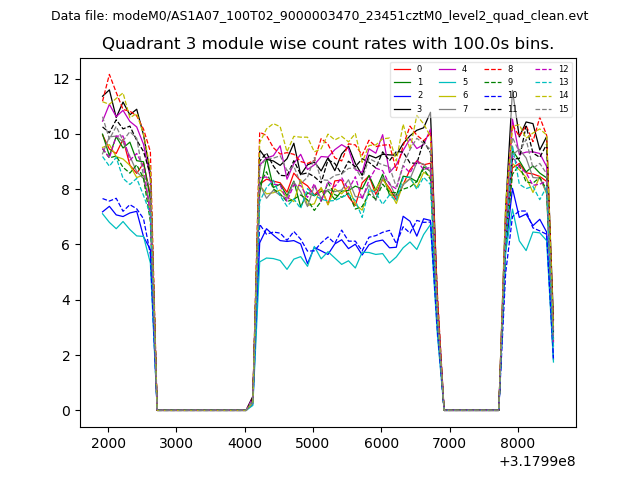
| Module-wise count rates for Quadrant C Data is divided into 100 sec bins |
 |
 |
| Module-wise count rates for Quadrant D Data is divided into 100 sec bins |
 |
 |
| Parameter | Plot |
|---|---|
| CZT HV Monitor |  |
| D_VDD | 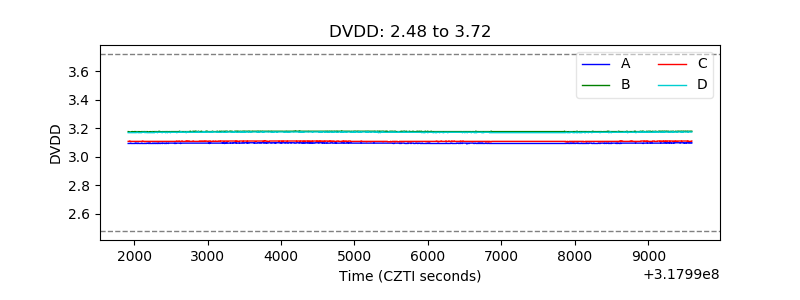 |
| Temperature 1 | 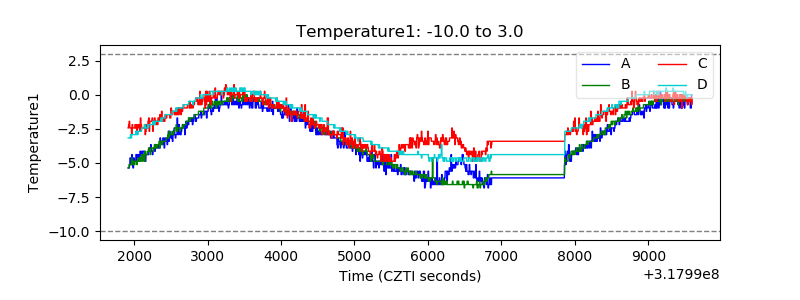 |
| Veto HV Monitor | 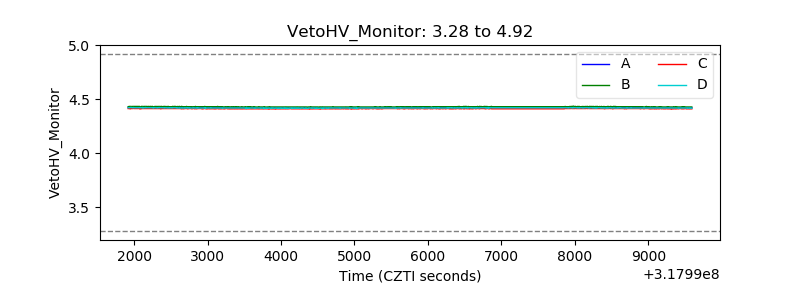 |
| Veto LLD | 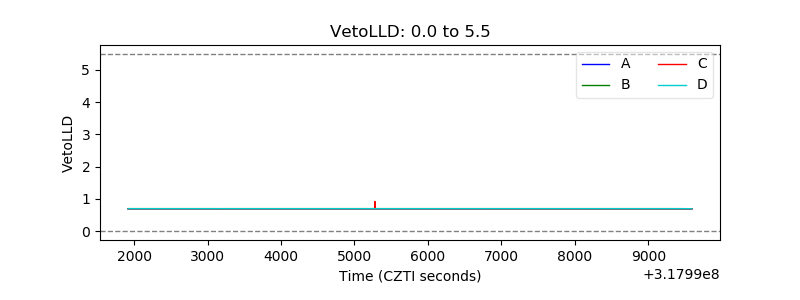 |
| Alpha Counter | 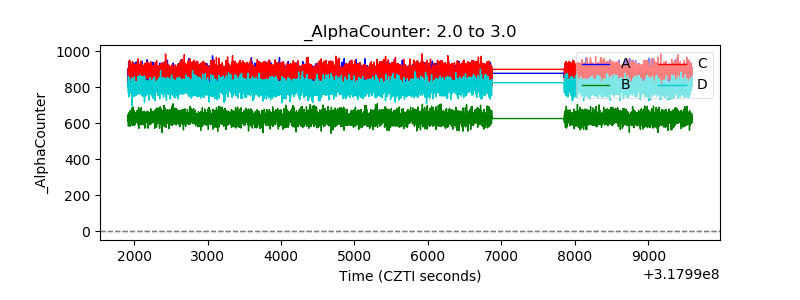 |
| _CPM_Rate | 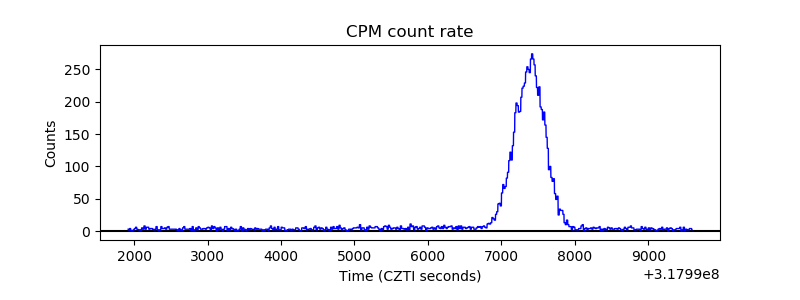 |
| CZT Counter | 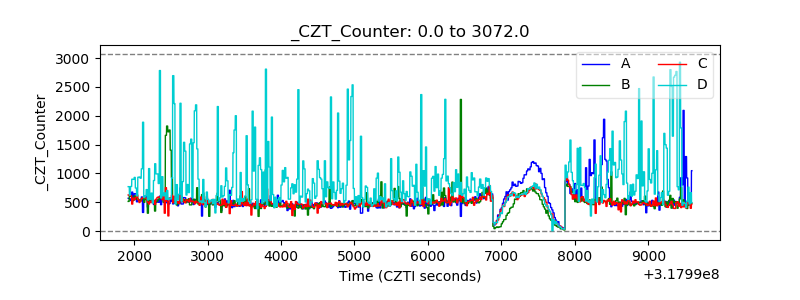 |
| +2.5 Volts monitor |  |
| +5 Volts monitor | 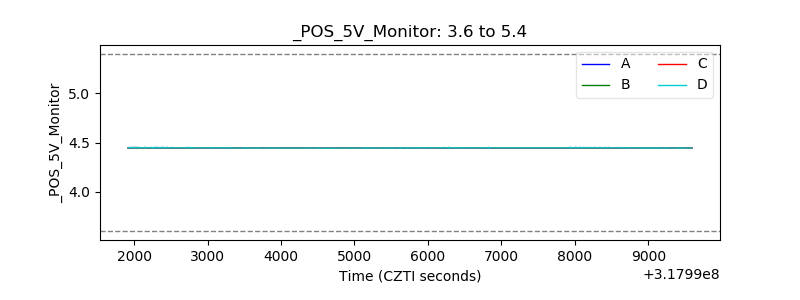 |
| _ROLL_ROT | 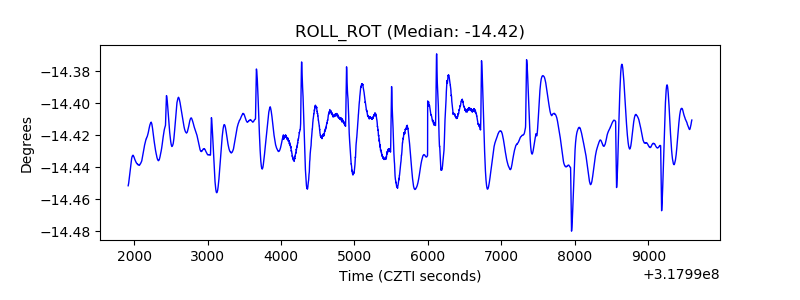 |
| _Roll_DEC | 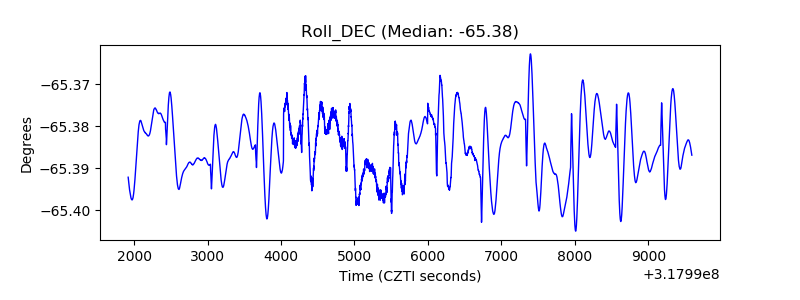 |
| _Roll_RA | 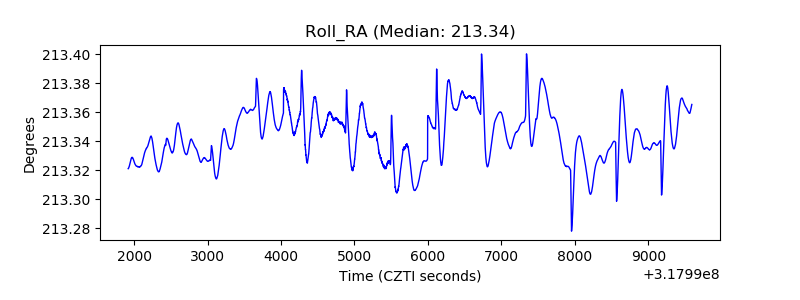 |
| Veto Counter |  |