| Param | Original file | Final file |
|---|---|---|
| Filename | modeM0/AS1A07_100T02_9000003470_23452cztM0_level2.evt | modeM0/AS1A07_100T02_9000003470_23452cztM0_level2_quad_clean.evt |
| Size (bytes) | 609,796,800 | 83,609,280 |
| Size | 581.5 MB | 79.7 MB |
| Events in quadrant A | 3,464,646 | 540,613 |
| Events in quadrant B | 3,568,864 | 549,007 |
| Events in quadrant C | 3,385,373 | 524,594 |
| Events in quadrant D | 7,580,474 | 435,998 |
| Mode M0 | |||
|---|---|---|---|
| Quadrant | BADHDUFLAG | Total packets | Discarded packets |
| A | 0 | 14651 | 1 |
| B | 0 | 14867 | 1 |
| C | 0 | 14293 | 1 |
| D | 0 | 27144 | 1 |
| Mode M9 | |||
|---|---|---|---|
| Quadrant | BADHDUFLAG | Total packets | Discarded packets |
| A | 0 | 6 | 0 |
| B | 0 | 6 | 0 |
| C | 0 | 6 | 0 |
| D | 0 | 6 | 0 |
| Mode SS | |||
|---|---|---|---|
| Quadrant | BADHDUFLAG | Total packets | Discarded packets |
| A | 0 | 142 | 0 |
| B | 0 | 142 | 0 |
| C | 0 | 142 | 0 |
| D | 0 | 142 | 0 |
| Quadrant | Total seconds | Saturated seconds | Saturation percentage |
|---|---|---|---|
| A | 6899 | 128 | 1.855341% |
| B | 6899 | 185 | 2.681548% |
| C | 6900 | 135 | 1.956522% |
| D | 6900 | 1495 | 21.666667% |
Noise dominated data is calculated using 1-second bins in cleaned event files. If a bin has >2000 counts, and if more than 50% of those come from <1% of pixels, then it is considered to be noise-dominated and hence unusable.
| Quadrant | # 1 sec bins | Bins with >0 counts | Bins with >2000 counts | High rate bins dominated by noise | Noise dominated (total time) | Noise dominated (detector-on time) | Marked lightcurve |
|---|---|---|---|---|---|---|---|
| A | 7514 | 6899 | 14 | 14 | 0.19% | 0.20% | 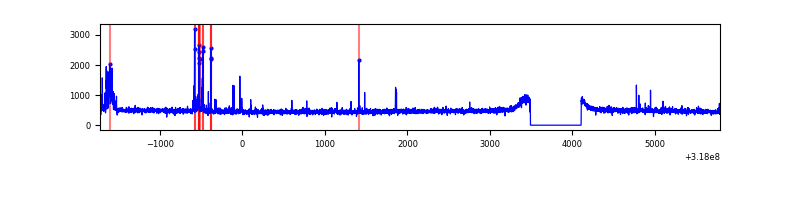 |
| B | 7514 | 6899 | 41 | 41 | 0.55% | 0.59% | 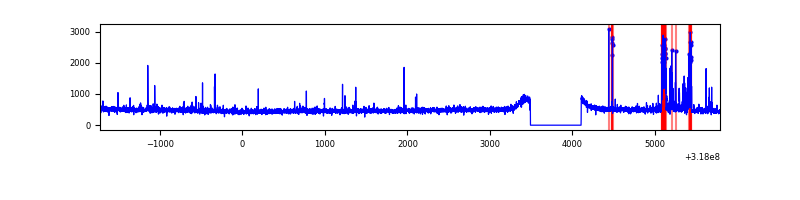 |
| C | 7515 | 6900 | 0 | 0 | 0.00% | 0.00% | 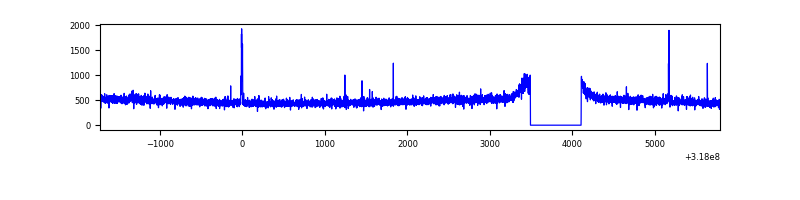 |
| D | 7515 | 6900 | 1122 | 1122 | 14.93% | 16.26% | 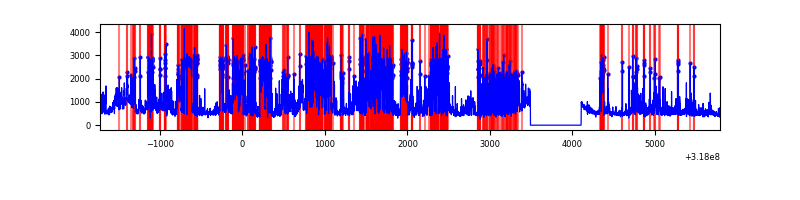 |
Top three noisy pixels from each quadrant. If the there are fewer than three noisy pixels in the level2.evt file, extra rows are filled as -1
| Pixel properties | Quadrant properties | ||||||
|---|---|---|---|---|---|---|---|
| Quadrant | DetID | PixID | Counts | Sigma | Mean | Median | Sigma |
| A | 0 | 31 | 89915 | 522.81 | 849 | 832 | 170.4 |
| A | 12 | 96 | 69162 | 401.02 | 849 | 832 | 170.4 |
| A | 15 | 174 | 27728 | 157.85 | 849 | 832 | 170.4 |
| B | 5 | 172 | 179441 | 1122.52 | 842 | 821 | 159.1 |
| B | 0 | 229 | 29135 | 177.94 | 842 | 821 | 159.1 |
| B | 0 | 228 | 21391 | 129.27 | 842 | 821 | 159.1 |
| C | 14 | 238 | 127127 | 664.86 | 818 | 824 | 190.0 |
| C | 7 | 247 | 32302 | 165.7 | 818 | 824 | 190.0 |
| C | 3 | 233 | 22342 | 113.27 | 818 | 824 | 190.0 |
| D | 1 | 52 | 3476746 | 19146.09 | 746 | 722 | 181.6 |
| D | 7 | 238 | 967237 | 5323.61 | 746 | 722 | 181.6 |
| D | 12 | 227 | 133488 | 731.28 | 746 | 722 | 181.6 |
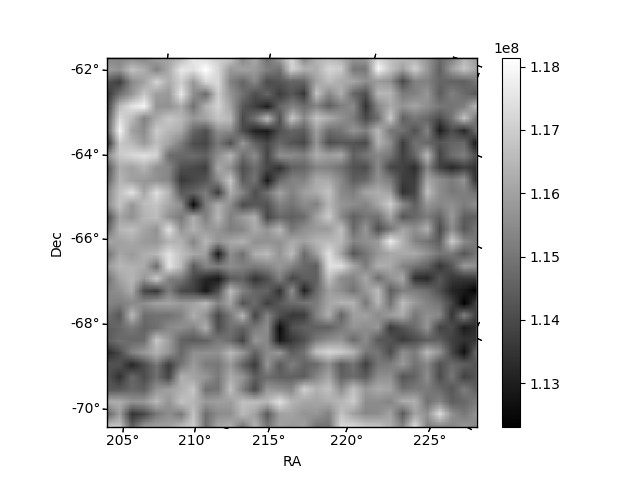
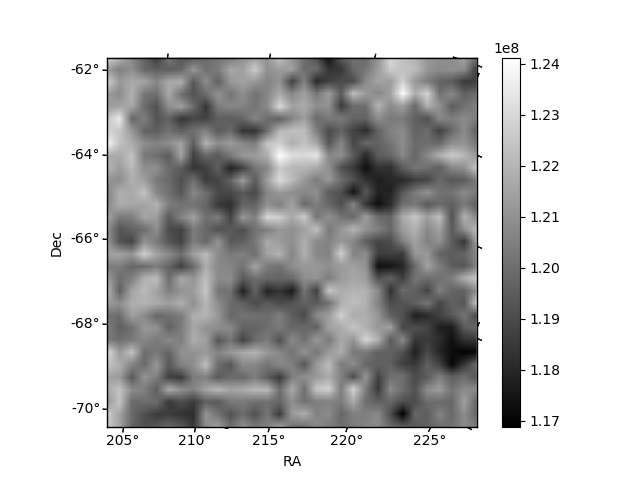
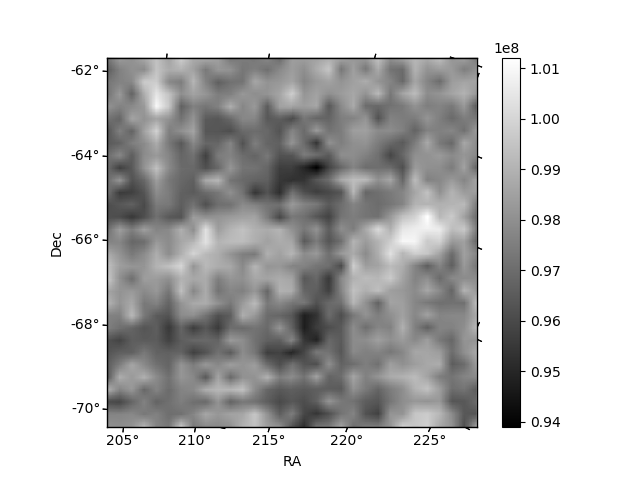
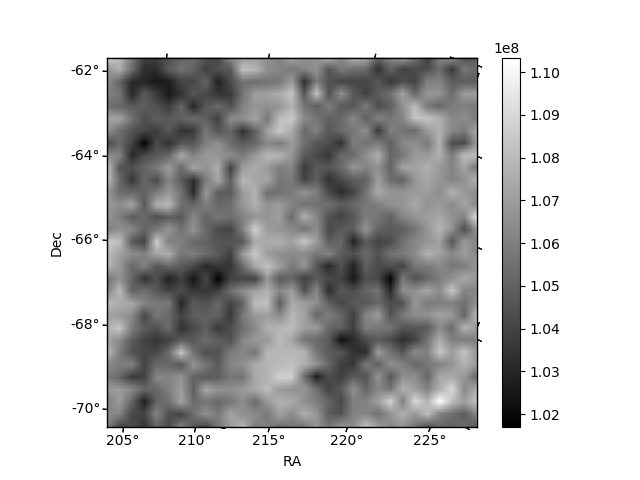
Histogram calculated using DETX and DETY for each event in the final _common_clean file
| Quadrant A | 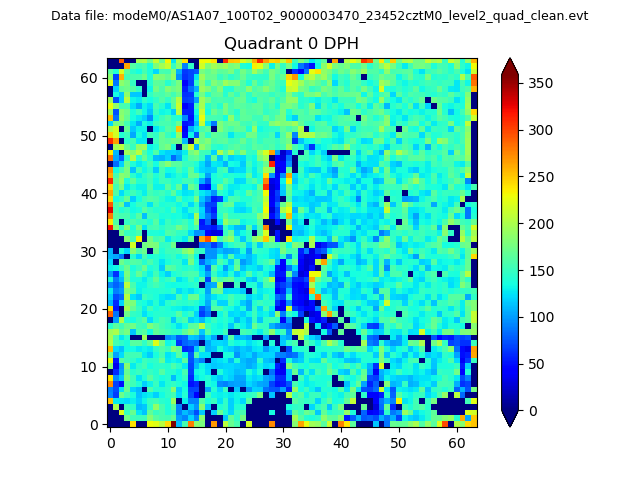 |
 |
Quadrant B |
|---|---|---|---|
| Quadrant D |  |
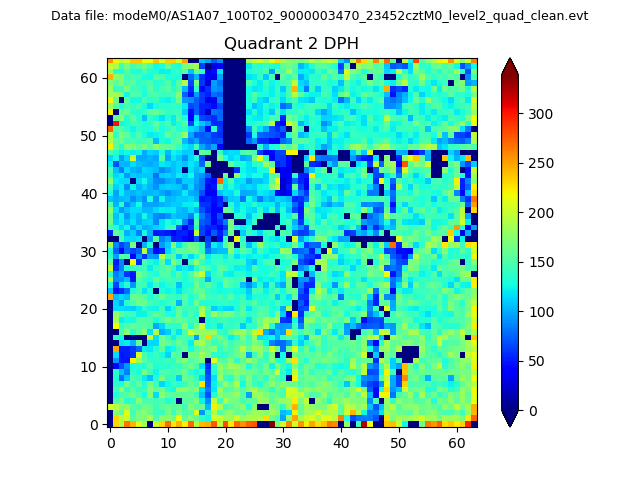 |
Quadrant C |
| Plot type | Count rate plots | Images |
|---|---|---|
| Comparison with Poisson distribution Blue bars denote a histogram of data divided into 1 sec bins. Red curve is a Poisson curve with rate = median count rate of data. |
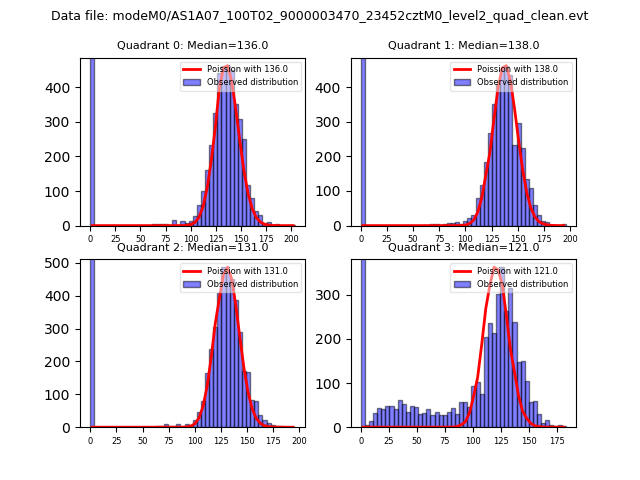 |
 |
| Quadrant-wise count rates Data is divided into 100 sec bins |
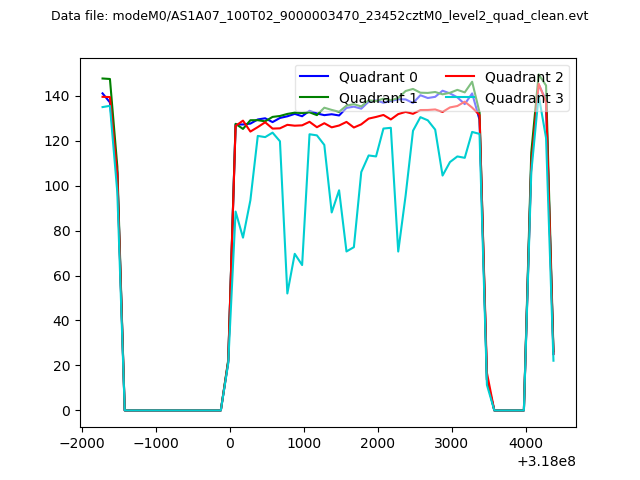 |
|
| Module-wise count rates for Quadrant A Data is divided into 100 sec bins |
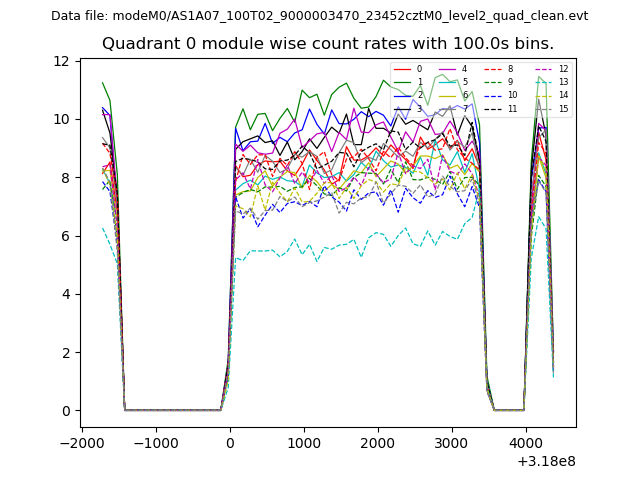 |
 |
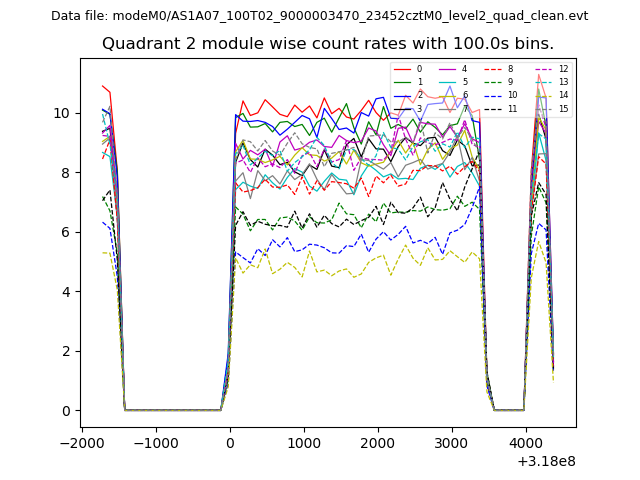
| Module-wise count rates for Quadrant B Data is divided into 100 sec bins |
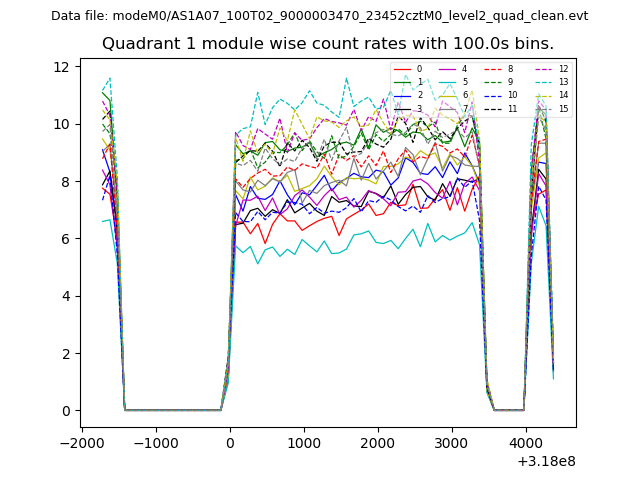 |
 |
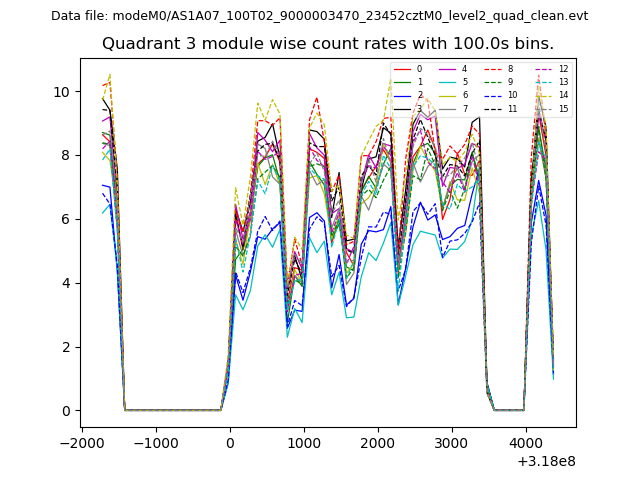
| Module-wise count rates for Quadrant C Data is divided into 100 sec bins |
 |
 |
| Module-wise count rates for Quadrant D Data is divided into 100 sec bins |
 |
 |
| Parameter | Plot |
|---|---|
| CZT HV Monitor |  |
| D_VDD | 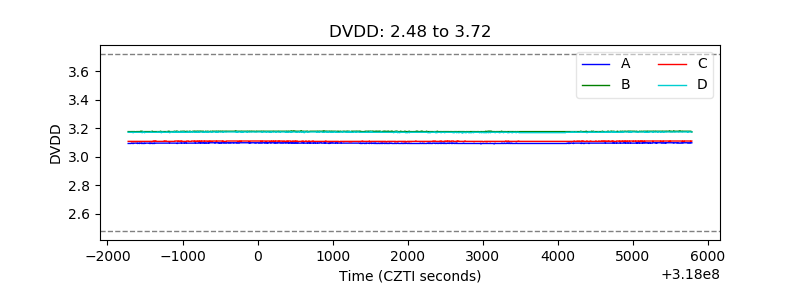 |
| Temperature 1 |  |
| Veto HV Monitor | 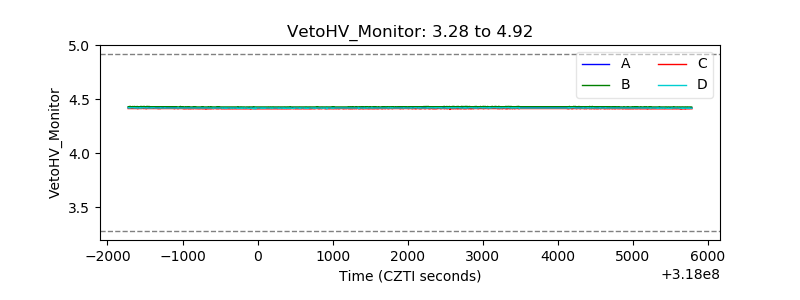 |
| Veto LLD | 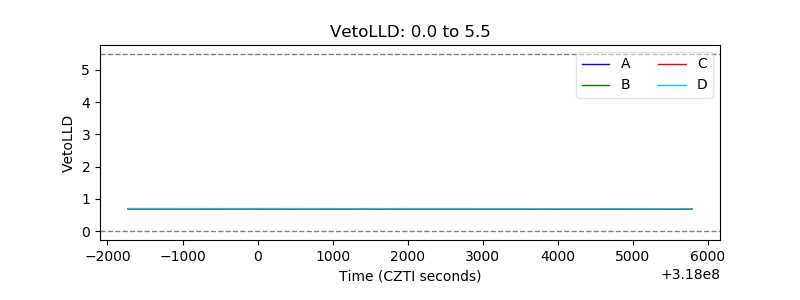 |
| Alpha Counter | 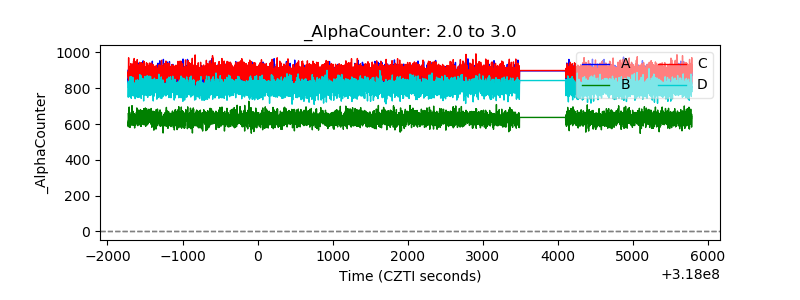 |
| _CPM_Rate | 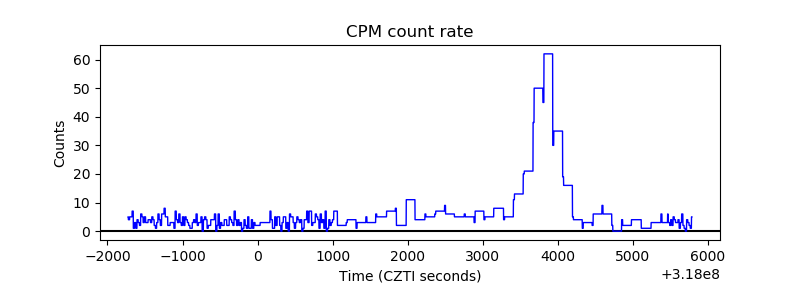 |
| CZT Counter | 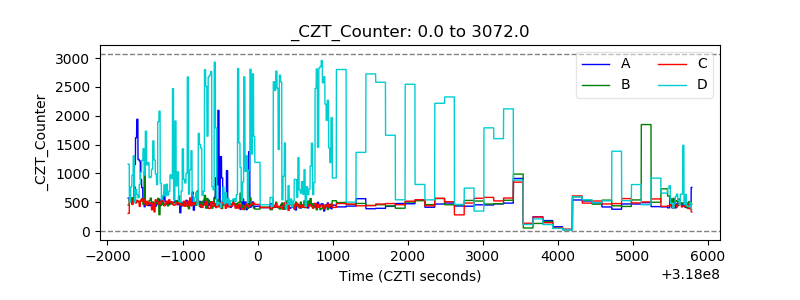 |
| +2.5 Volts monitor |  |
| +5 Volts monitor |  |
| _ROLL_ROT | 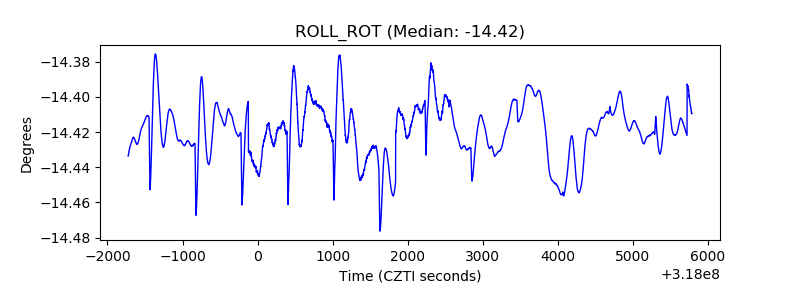 |
| _Roll_DEC | 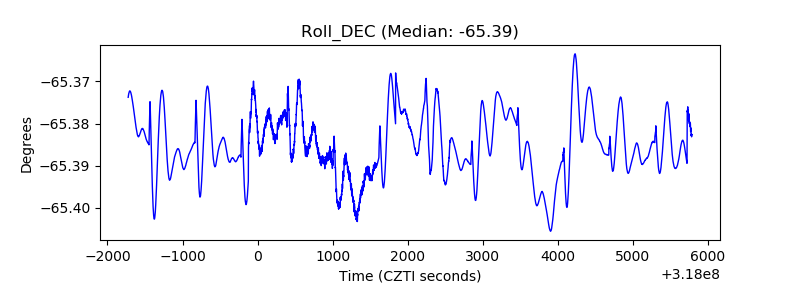 |
| _Roll_RA | 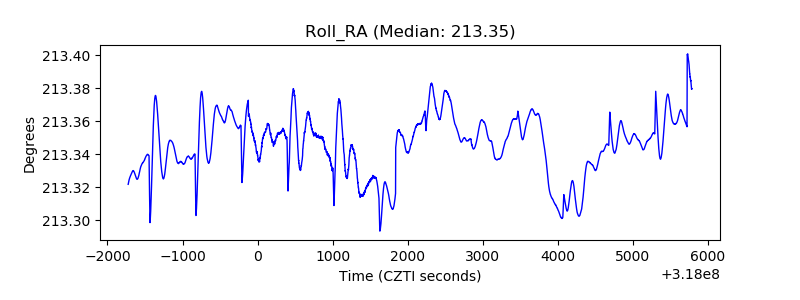 |
| Veto Counter | 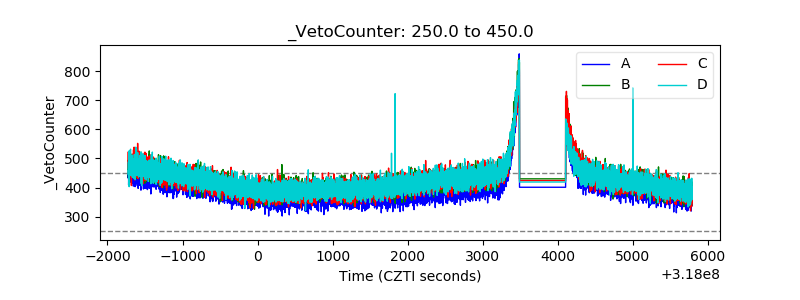 |