| Param | Original file | Final file |
|---|---|---|
| Filename | modeM0/AS1A07_100T02_9000003470_23453cztM0_level2.evt | modeM0/AS1A07_100T02_9000003470_23453cztM0_level2_quad_clean.evt |
| Size (bytes) | 541,549,440 | 89,167,680 |
| Size | 516.5 MB | 85.0 MB |
| Events in quadrant A | 3,436,033 | 562,180 |
| Events in quadrant B | 3,696,783 | 564,966 |
| Events in quadrant C | 3,583,095 | 541,725 |
| Events in quadrant D | 5,194,401 | 528,332 |
| Mode M0 | |||
|---|---|---|---|
| Quadrant | BADHDUFLAG | Total packets | Discarded packets |
| A | 0 | 14907 | 1 |
| B | 0 | 15580 | 1 |
| C | 0 | 15162 | 1 |
| D | 0 | 20138 | 4 |
| Mode M9 | |||
|---|---|---|---|
| Quadrant | BADHDUFLAG | Total packets | Discarded packets |
| A | 0 | 2 | 0 |
| B | 0 | 2 | 0 |
| C | 0 | 2 | 0 |
| D | 0 | 2 | 0 |
| Mode SS | |||
|---|---|---|---|
| Quadrant | BADHDUFLAG | Total packets | Discarded packets |
| A | 0 | 148 | 0 |
| B | 0 | 148 | 0 |
| C | 0 | 148 | 0 |
| D | 0 | 148 | 0 |
| Quadrant | Total seconds | Saturated seconds | Saturation percentage |
|---|---|---|---|
| A | 7220 | 138 | 1.911357% |
| B | 7220 | 233 | 3.227147% |
| C | 7220 | 183 | 2.534626% |
| D | 7220 | 458 | 6.343490% |
Noise dominated data is calculated using 1-second bins in cleaned event files. If a bin has >2000 counts, and if more than 50% of those come from <1% of pixels, then it is considered to be noise-dominated and hence unusable.
| Quadrant | # 1 sec bins | Bins with >0 counts | Bins with >2000 counts | High rate bins dominated by noise | Noise dominated (total time) | Noise dominated (detector-on time) | Marked lightcurve |
|---|---|---|---|---|---|---|---|
| A | 7435 | 7220 | 0 | 0 | 0.00% | 0.00% |  |
| B | 7435 | 7220 | 42 | 42 | 0.56% | 0.58% | 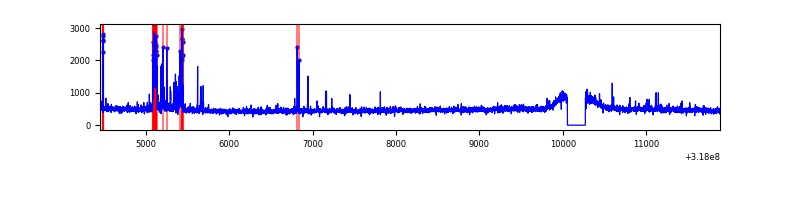 |
| C | 7435 | 7220 | 16 | 16 | 0.22% | 0.22% | 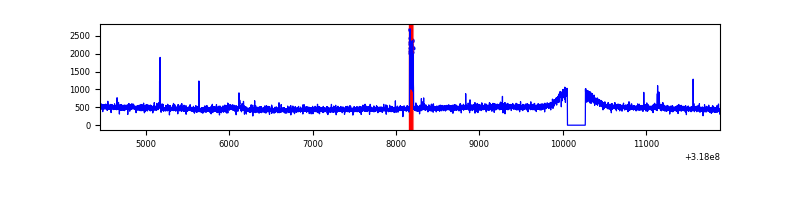 |
| D | 7435 | 7220 | 288 | 288 | 3.87% | 3.99% | 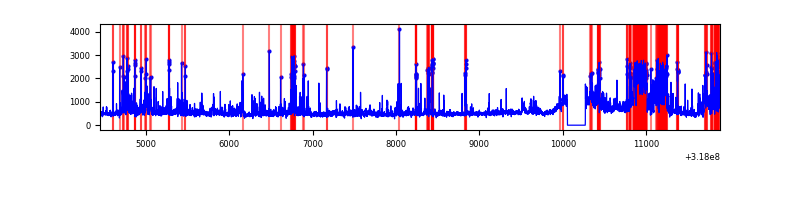 |
Top three noisy pixels from each quadrant. If the there are fewer than three noisy pixels in the level2.evt file, extra rows are filled as -1
| Pixel properties | Quadrant properties | ||||||
|---|---|---|---|---|---|---|---|
| Quadrant | DetID | PixID | Counts | Sigma | Mean | Median | Sigma |
| A | 15 | 174 | 16452 | 87.44 | 886 | 866 | 178.2 |
| A | 13 | 254 | 11745 | 61.03 | 886 | 866 | 178.2 |
| A | 0 | 226 | 7864 | 39.26 | 886 | 866 | 178.2 |
| B | 5 | 172 | 175709 | 1050.98 | 876 | 854 | 166.4 |
| B | 0 | 229 | 32836 | 192.23 | 876 | 854 | 166.4 |
| B | 0 | 228 | 21127 | 121.85 | 876 | 854 | 166.4 |
| C | 14 | 238 | 133758 | 671.85 | 849 | 854 | 197.8 |
| C | 10 | 9 | 67257 | 335.67 | 849 | 854 | 197.8 |
| C | 7 | 247 | 31906 | 156.97 | 849 | 854 | 197.8 |
| D | 7 | 238 | 763783 | 3635.93 | 854 | 827 | 209.8 |
| D | 1 | 52 | 641143 | 3051.48 | 854 | 827 | 209.8 |
| D | 12 | 233 | 209562 | 994.74 | 854 | 827 | 209.8 |
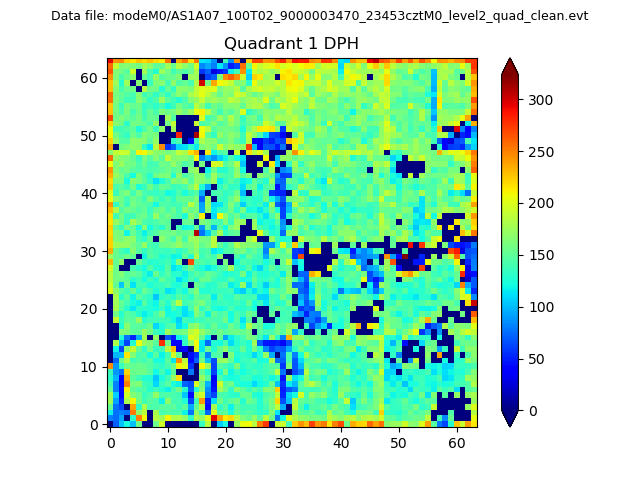
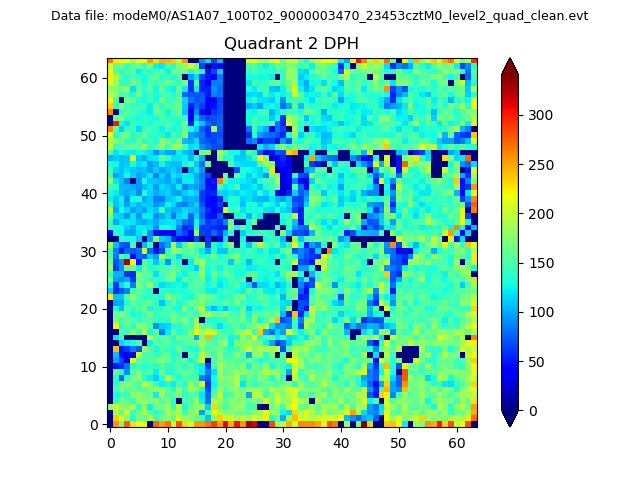
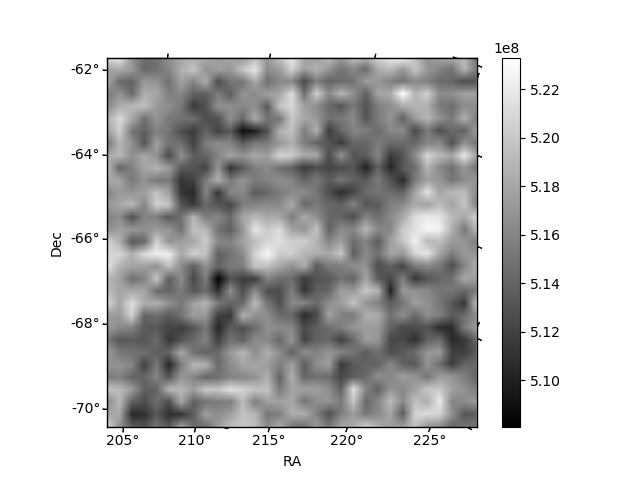
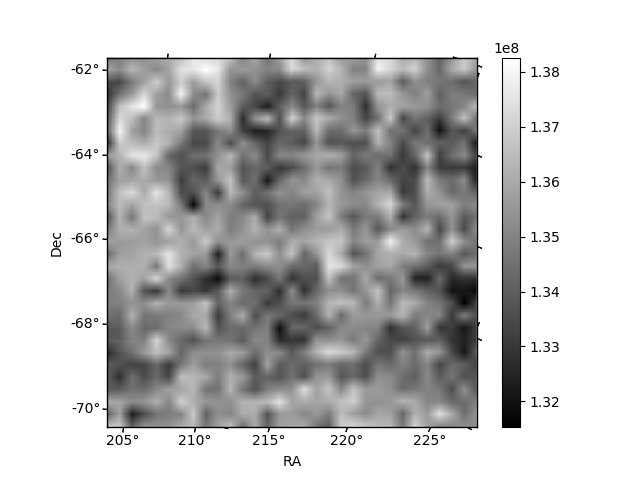
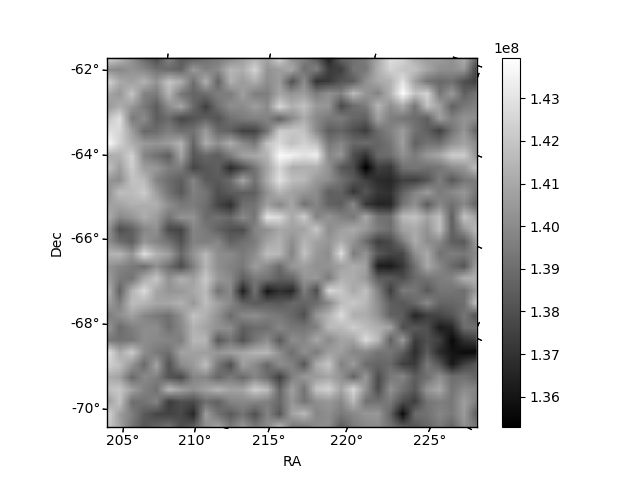
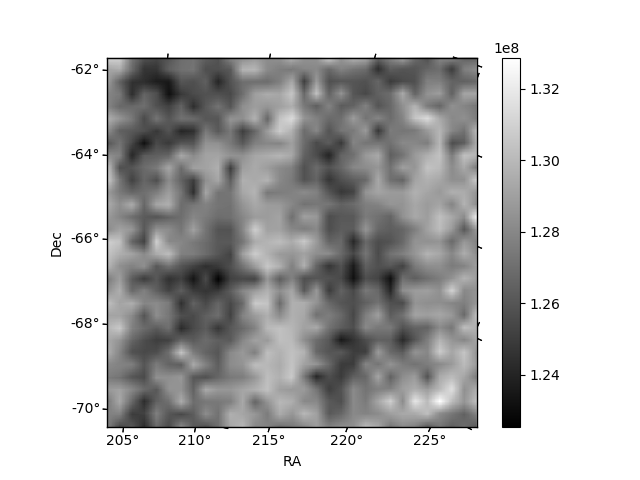
Histogram calculated using DETX and DETY for each event in the final _common_clean file
| Quadrant A | 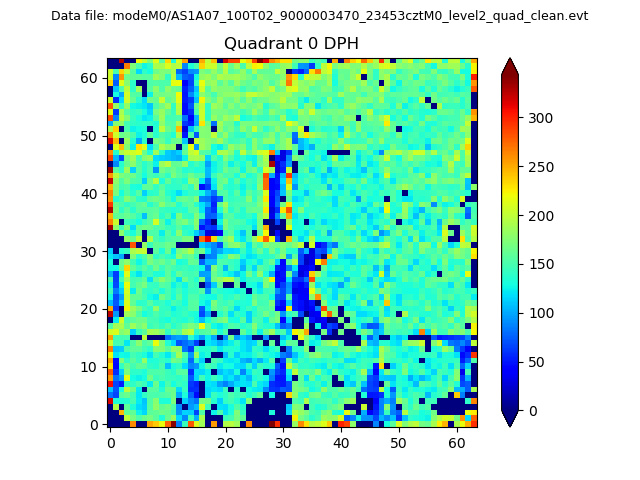 |
 |
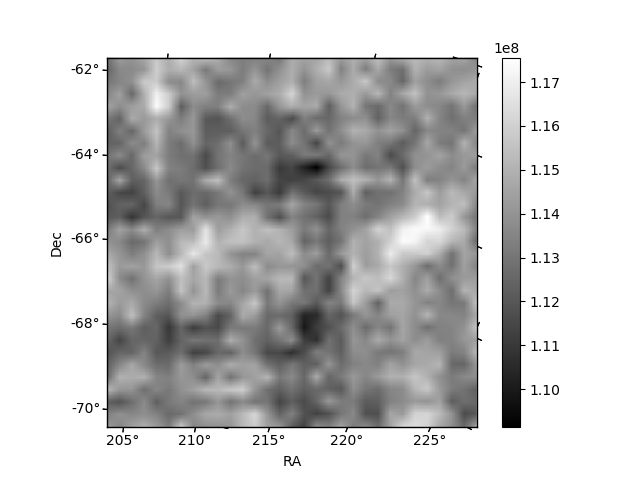
Quadrant B |
|---|---|---|---|
| Quadrant D | 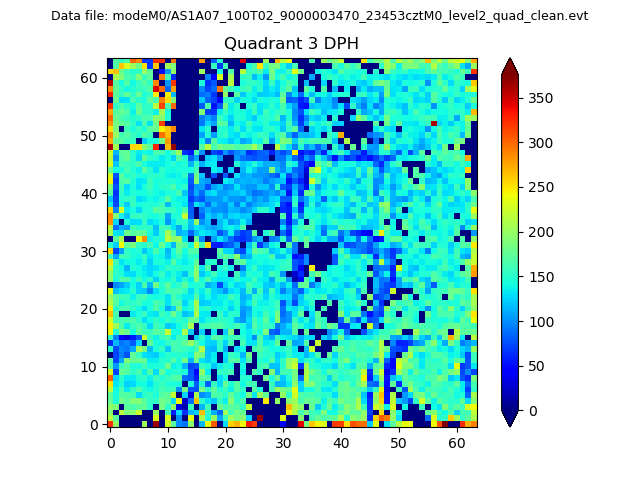 |
 |
Quadrant C |
| Plot type | Count rate plots | Images |
|---|---|---|
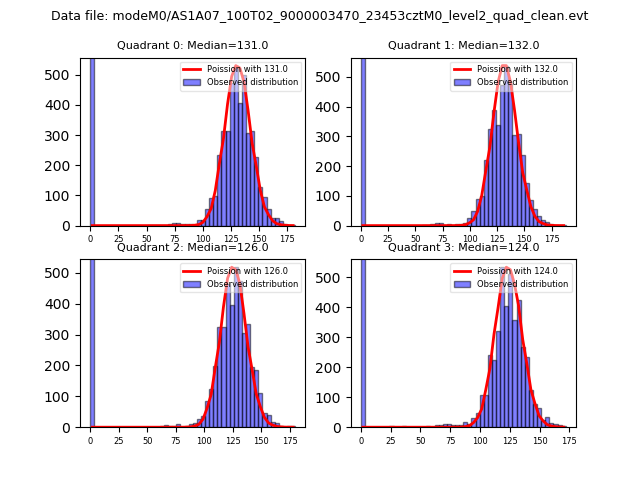
| Comparison with Poisson distribution Blue bars denote a histogram of data divided into 1 sec bins. Red curve is a Poisson curve with rate = median count rate of data. |
 |
 |
| Quadrant-wise count rates Data is divided into 100 sec bins |
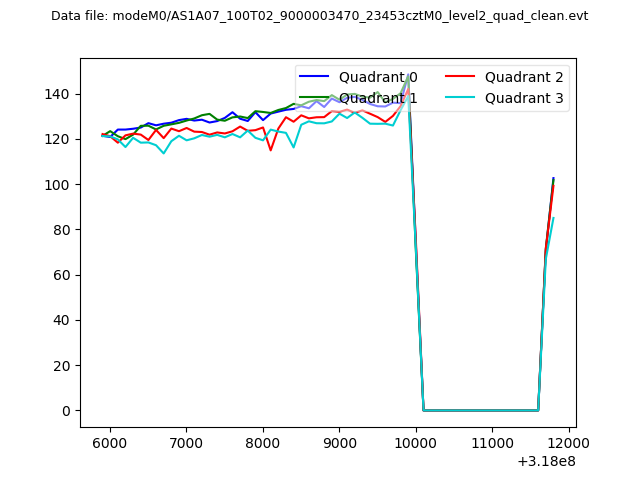 |
|
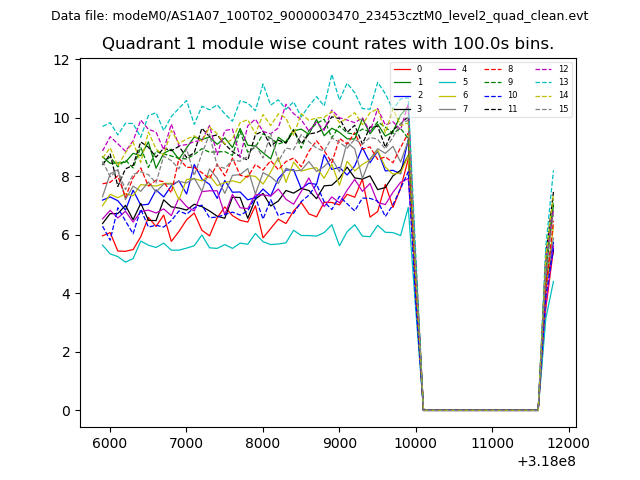
| Module-wise count rates for Quadrant A Data is divided into 100 sec bins |
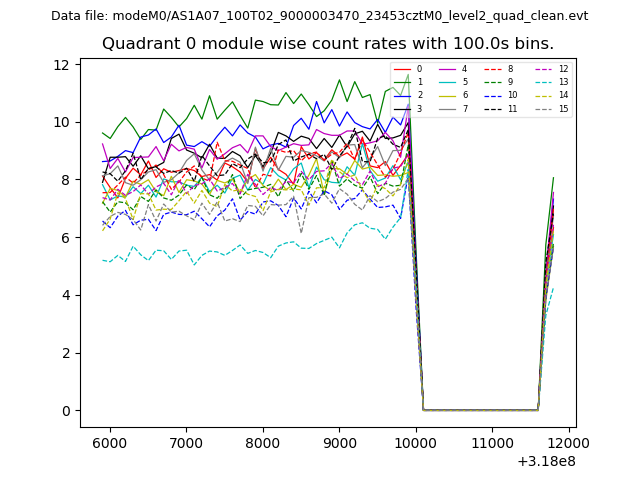 |
 |
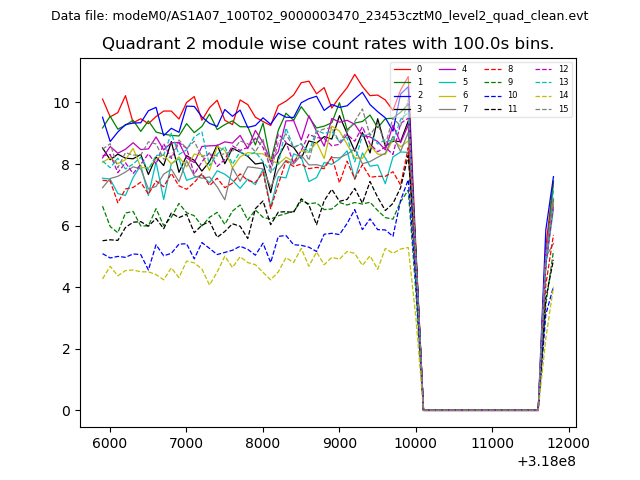
| Module-wise count rates for Quadrant B Data is divided into 100 sec bins |
 |
 |
| Module-wise count rates for Quadrant C Data is divided into 100 sec bins |
 |
 |
| Module-wise count rates for Quadrant D Data is divided into 100 sec bins |
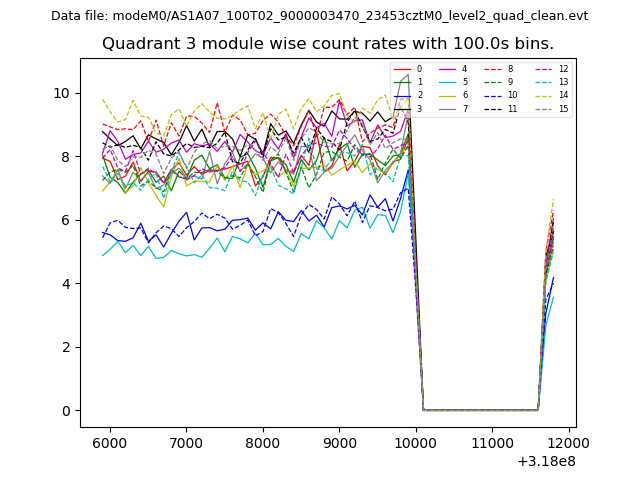 |
 |
| Parameter | Plot |
|---|---|
| CZT HV Monitor | 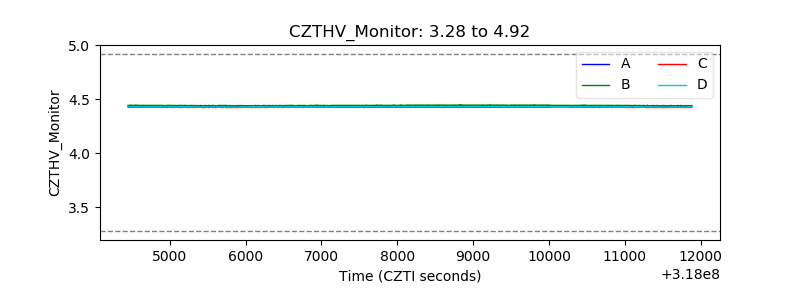 |
| D_VDD | 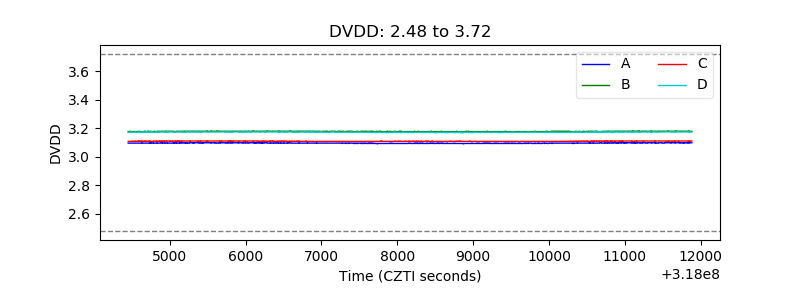 |
| Temperature 1 | 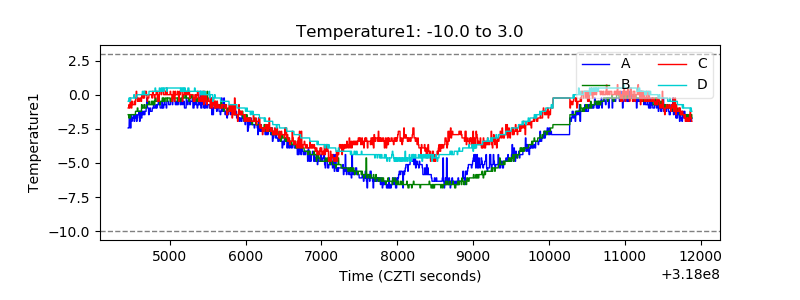 |
| Veto HV Monitor | 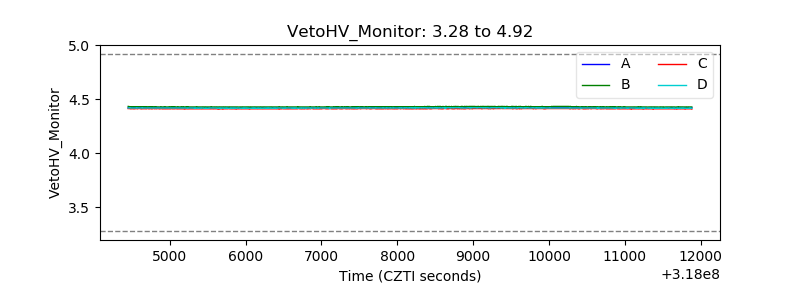 |
| Veto LLD | 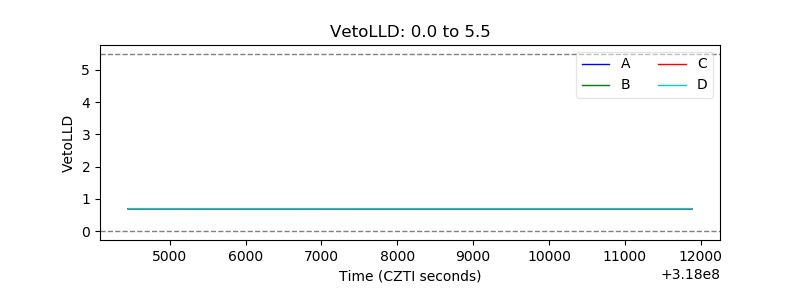 |
| Alpha Counter | 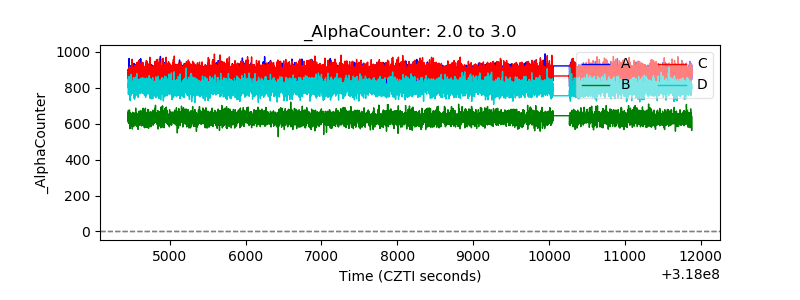 |
| _CPM_Rate | 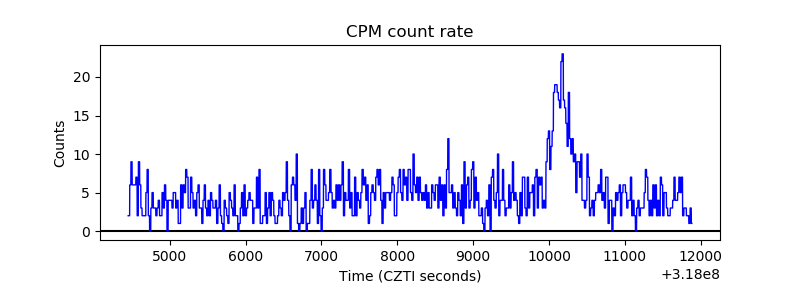 |
| CZT Counter | 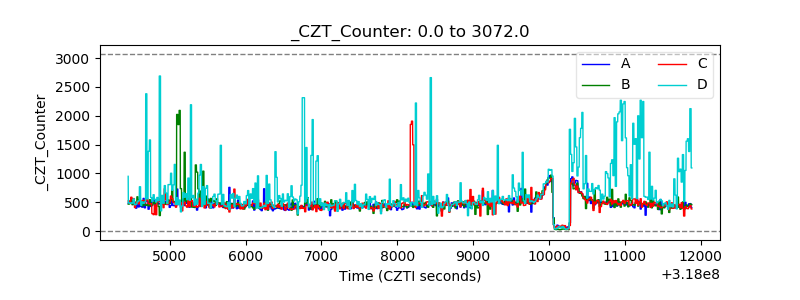 |
| +2.5 Volts monitor | 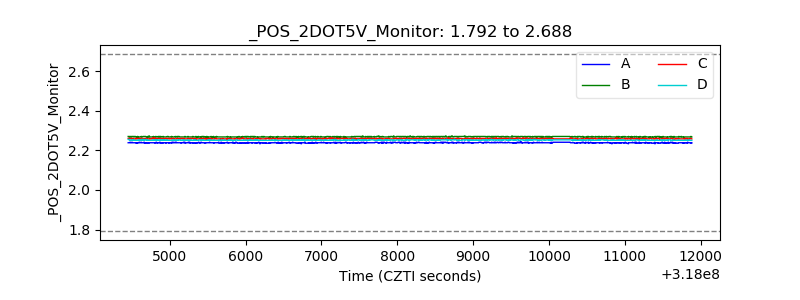 |
| +5 Volts monitor | 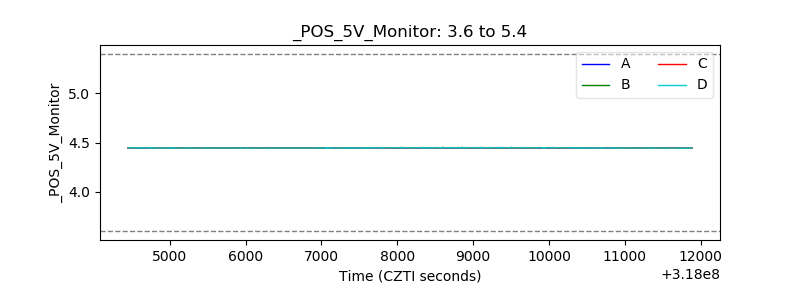 |
| _ROLL_ROT | 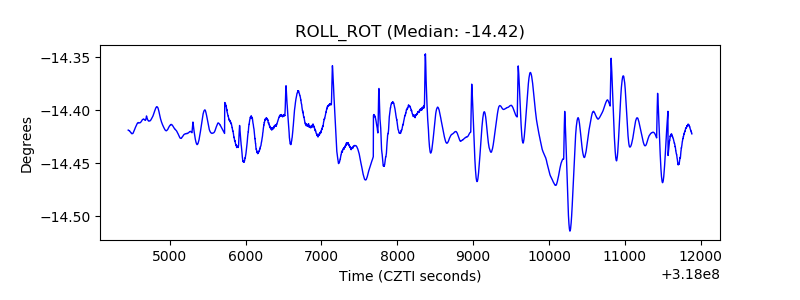 |
| _Roll_DEC | 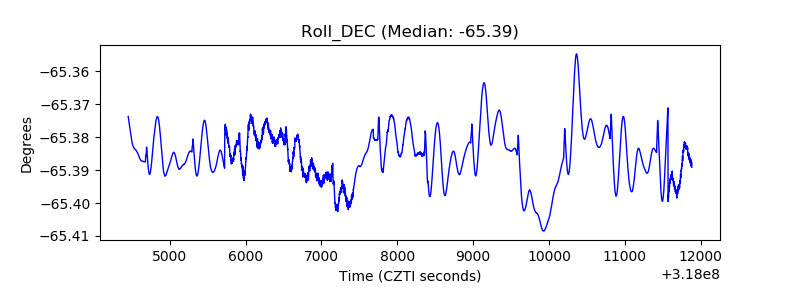 |
| _Roll_RA | 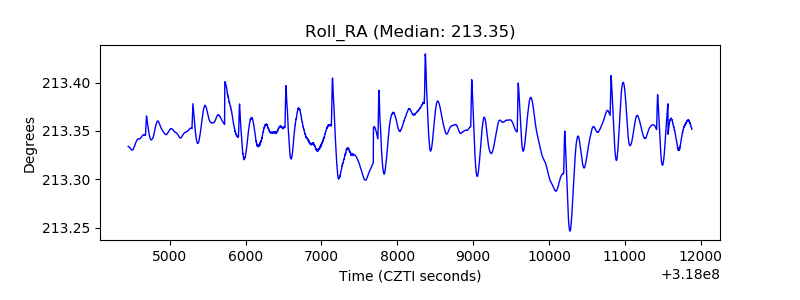 |
| Veto Counter | 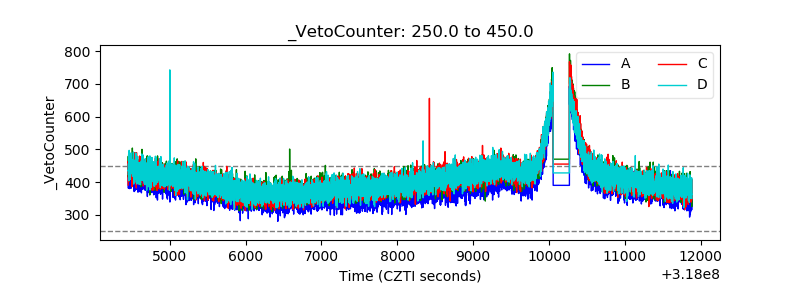 |