| Param | Original file | Final file |
|---|---|---|
| Filename | modeM0/AS1A07_100T02_9000003470_23454cztM0_level2.evt | modeM0/AS1A07_100T02_9000003470_23454cztM0_level2_quad_clean.evt |
| Size (bytes) | 814,656,960 | 94,849,920 |
| Size | 776.9 MB | 90.5 MB |
| Events in quadrant A | 3,765,526 | 656,728 |
| Events in quadrant B | 3,975,885 | 660,949 |
| Events in quadrant C | 3,838,950 | 634,546 |
| Events in quadrant D | 12,560,927 | 373,684 |
| Mode M0 | |||
|---|---|---|---|
| Quadrant | BADHDUFLAG | Total packets | Discarded packets |
| A | 0 | 16367 | 2 |
| B | 0 | 16803 | 2 |
| C | 0 | 16447 | 2 |
| D | 0 | 42724 | 2 |
| Mode M9 | |||
|---|---|---|---|
| Quadrant | BADHDUFLAG | Total packets | Discarded packets |
| A | 0 | 5 | 0 |
| B | 0 | 5 | 0 |
| C | 0 | 5 | 0 |
| D | 0 | 5 | 0 |
| Mode SS | |||
|---|---|---|---|
| Quadrant | BADHDUFLAG | Total packets | Discarded packets |
| A | 0 | 160 | 0 |
| B | 0 | 160 | 0 |
| C | 0 | 160 | 0 |
| D | 0 | 160 | 0 |
| Quadrant | Total seconds | Saturated seconds | Saturation percentage |
|---|---|---|---|
| A | 7843 | 188 | 2.397042% |
| B | 7844 | 242 | 3.085161% |
| C | 7844 | 192 | 2.447731% |
| D | 7844 | 3512 | 44.773075% |
Noise dominated data is calculated using 1-second bins in cleaned event files. If a bin has >2000 counts, and if more than 50% of those come from <1% of pixels, then it is considered to be noise-dominated and hence unusable.
| Quadrant | # 1 sec bins | Bins with >0 counts | Bins with >2000 counts | High rate bins dominated by noise | Noise dominated (total time) | Noise dominated (detector-on time) | Marked lightcurve |
|---|---|---|---|---|---|---|---|
| A | 8333 | 7844 | 1 | 1 | 0.01% | 0.01% | 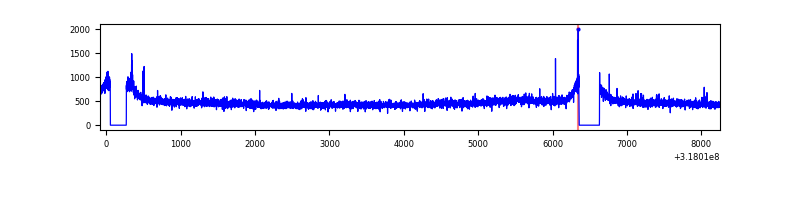 |
| B | 8334 | 7844 | 1 | 1 | 0.01% | 0.01% |  |
| C | 8334 | 7845 | 0 | 0 | 0.00% | 0.00% | 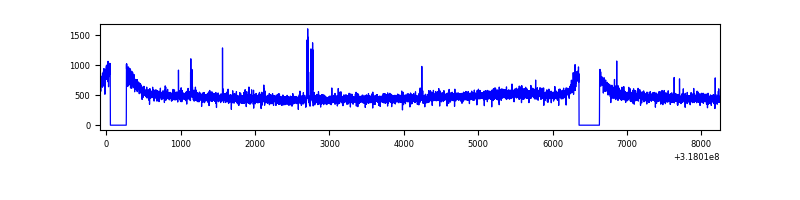 |
| D | 8334 | 7844 | 3216 | 3216 | 38.59% | 41.00% | 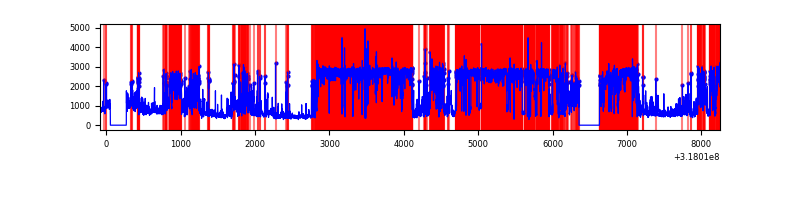 |
Top three noisy pixels from each quadrant. If the there are fewer than three noisy pixels in the level2.evt file, extra rows are filled as -1
| Pixel properties | Quadrant properties | ||||||
|---|---|---|---|---|---|---|---|
| Quadrant | DetID | PixID | Counts | Sigma | Mean | Median | Sigma |
| A | 15 | 174 | 16604 | 79.19 | 972 | 945 | 197.7 |
| A | 13 | 254 | 13140 | 61.68 | 972 | 945 | 197.7 |
| A | 0 | 226 | 8494 | 38.18 | 972 | 945 | 197.7 |
| B | 0 | 190 | 98973 | 537.65 | 963 | 937 | 182.3 |
| B | 0 | 229 | 35259 | 188.23 | 963 | 937 | 182.3 |
| B | 0 | 219 | 26181 | 138.44 | 963 | 937 | 182.3 |
| C | 14 | 238 | 145038 | 664.68 | 928 | 932 | 216.8 |
| C | 10 | 9 | 23452 | 103.87 | 928 | 932 | 216.8 |
| C | 7 | 247 | 22335 | 98.72 | 928 | 932 | 216.8 |
| D | 1 | 52 | 8385094 | 49304.08 | 693 | 672 | 170.1 |
| D | 7 | 238 | 861740 | 5063.46 | 693 | 672 | 170.1 |
| D | 12 | 233 | 231518 | 1357.48 | 693 | 672 | 170.1 |
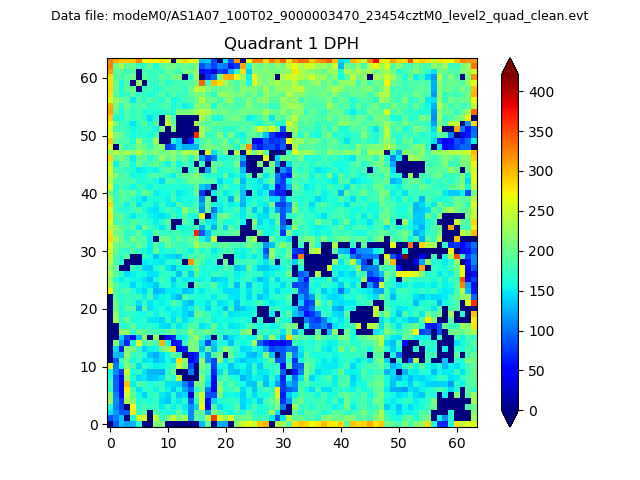
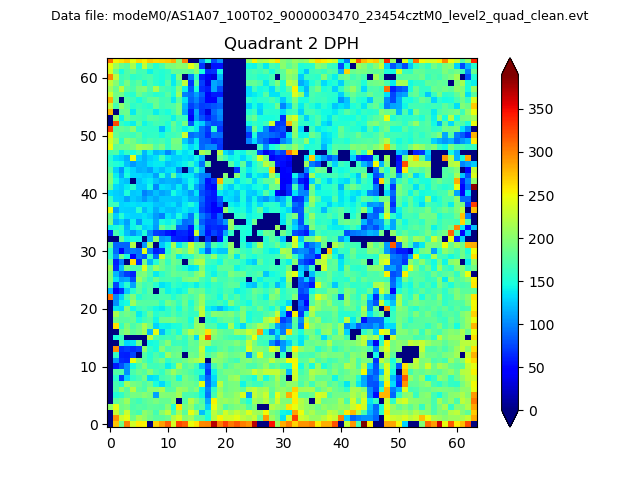
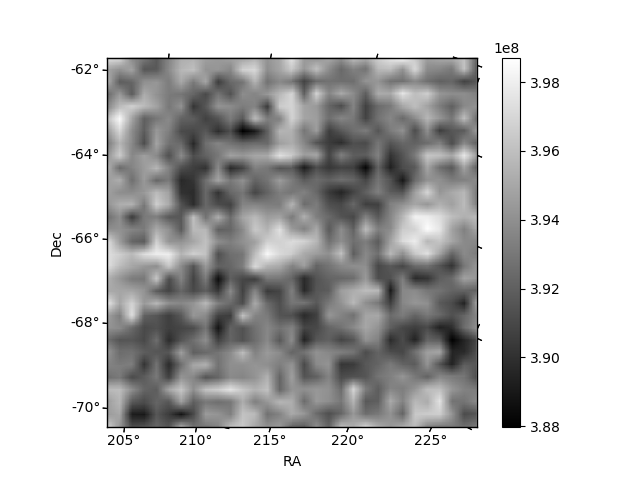
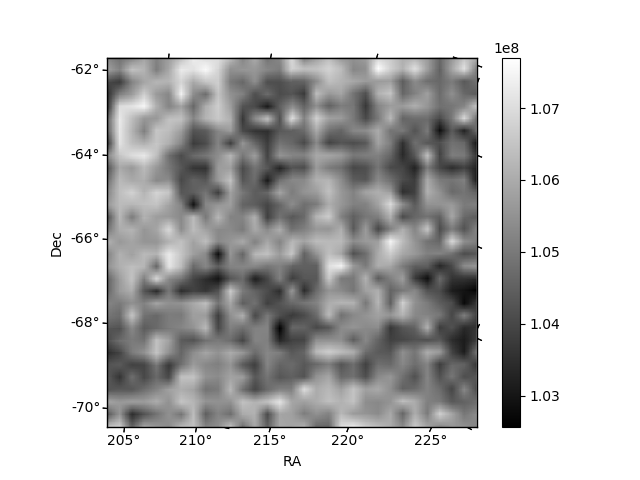
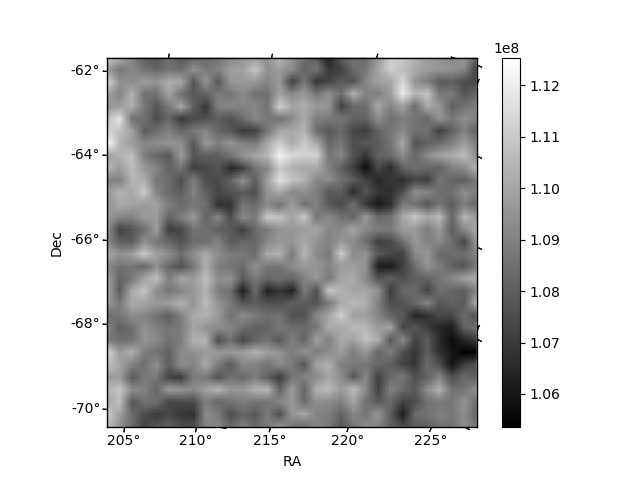
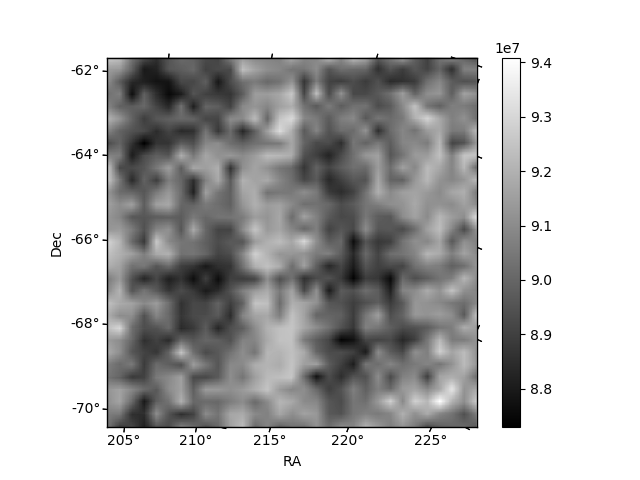
Histogram calculated using DETX and DETY for each event in the final _common_clean file
| Quadrant A | 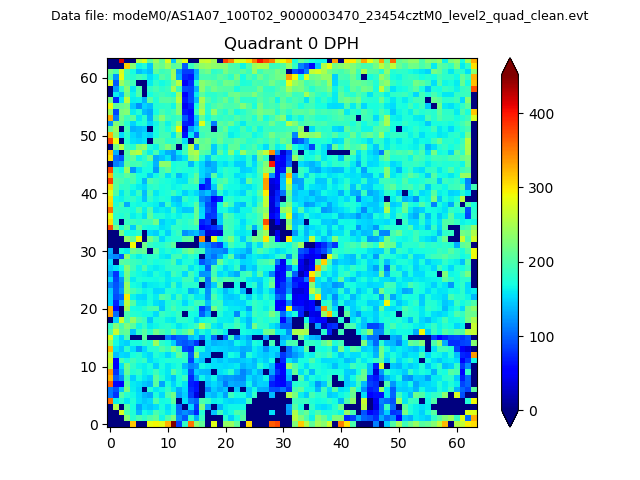 |
 |
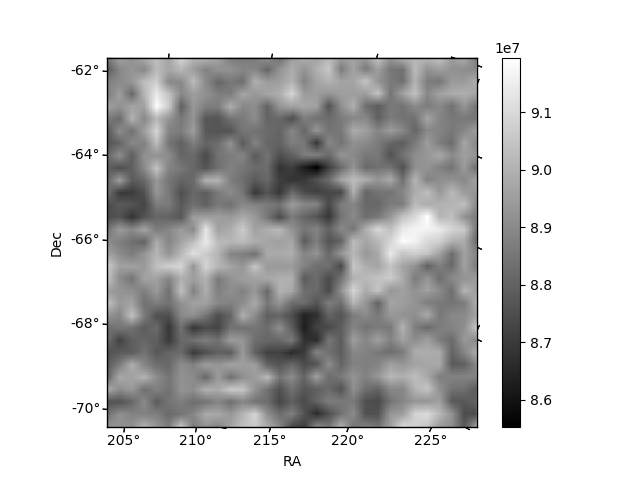
Quadrant B |
|---|---|---|---|
| Quadrant D | 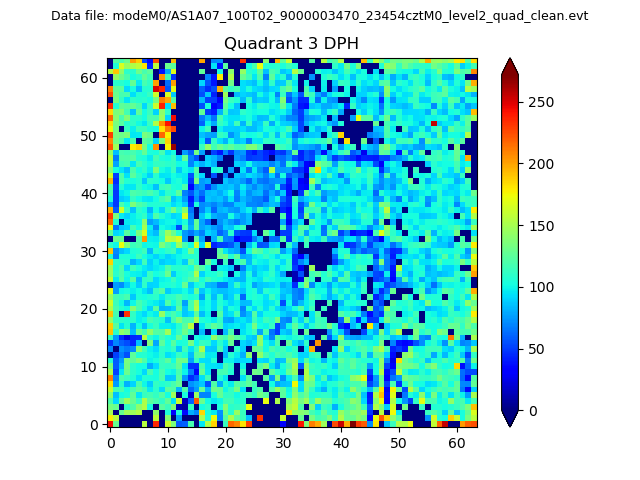 |
 |
Quadrant C |
| Plot type | Count rate plots | Images |
|---|---|---|
| Comparison with Poisson distribution Blue bars denote a histogram of data divided into 1 sec bins. Red curve is a Poisson curve with rate = median count rate of data. |
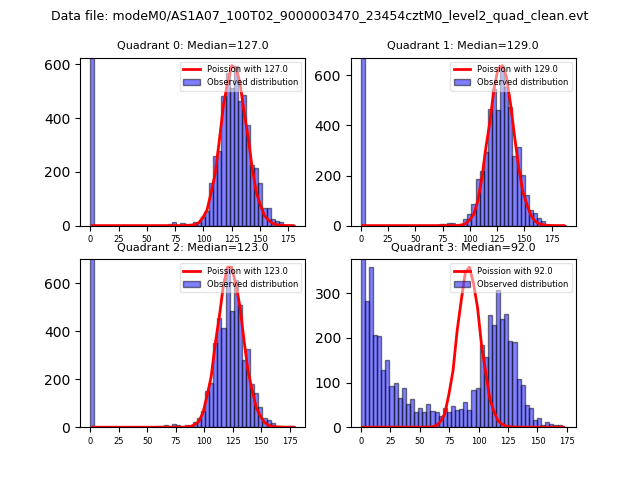 |
 |
| Quadrant-wise count rates Data is divided into 100 sec bins |
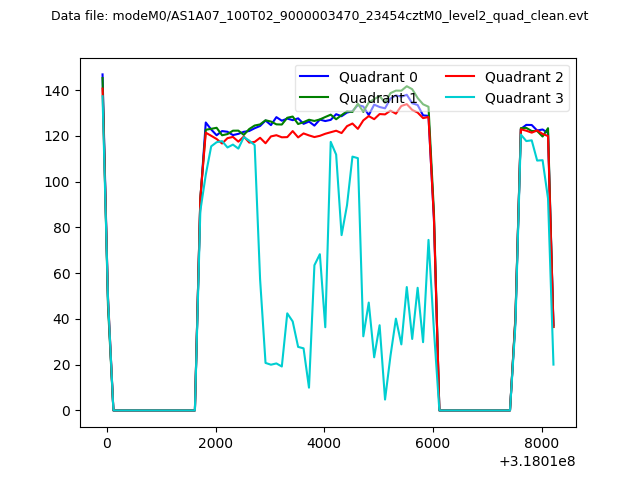 |
|
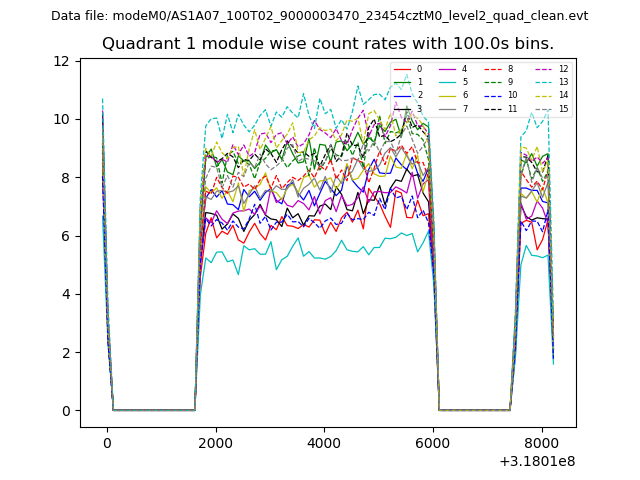
| Module-wise count rates for Quadrant A Data is divided into 100 sec bins |
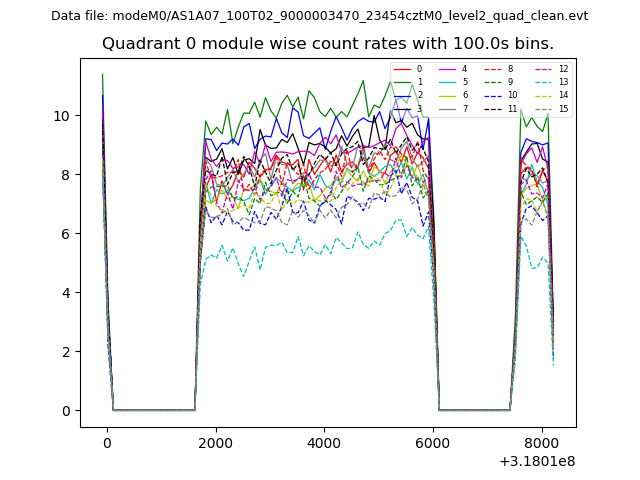 |
 |
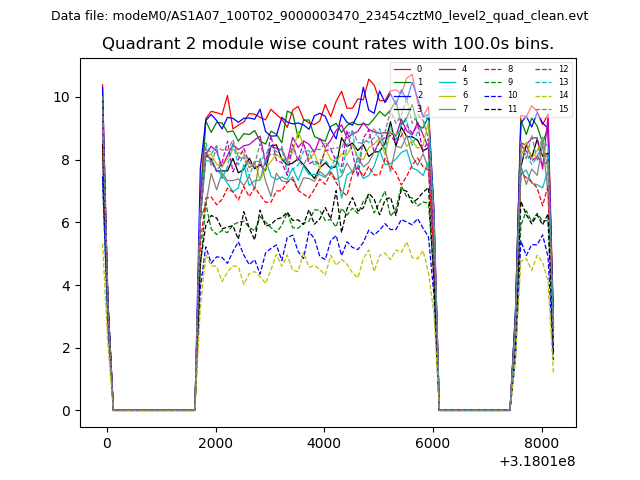
| Module-wise count rates for Quadrant B Data is divided into 100 sec bins |
 |
 |
| Module-wise count rates for Quadrant C Data is divided into 100 sec bins |
 |
 |
| Module-wise count rates for Quadrant D Data is divided into 100 sec bins |
 |
 |
| Parameter | Plot |
|---|---|
| CZT HV Monitor | 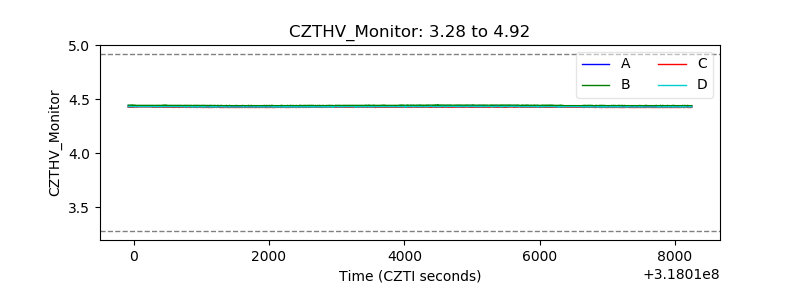 |
| D_VDD | 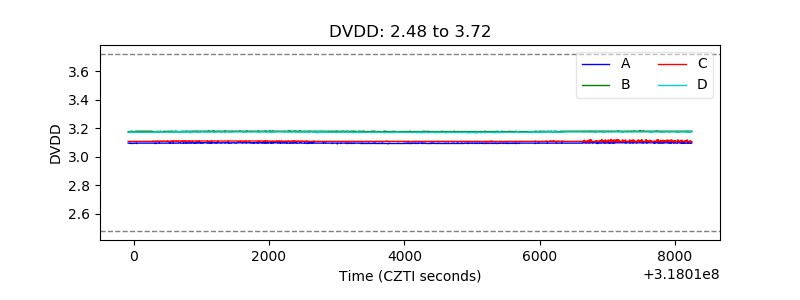 |
| Temperature 1 | 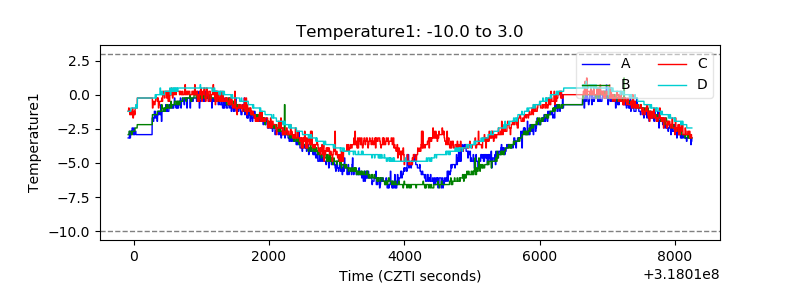 |
| Veto HV Monitor | 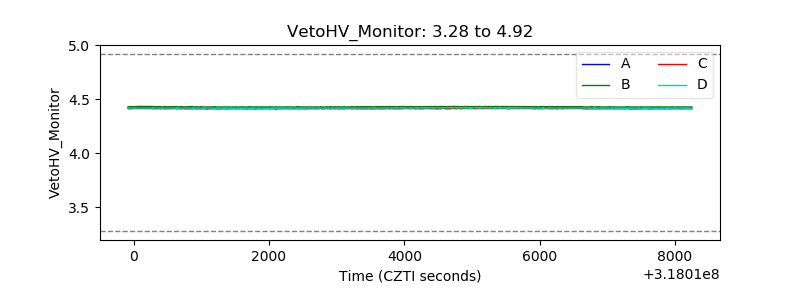 |
| Veto LLD |  |
| Alpha Counter | 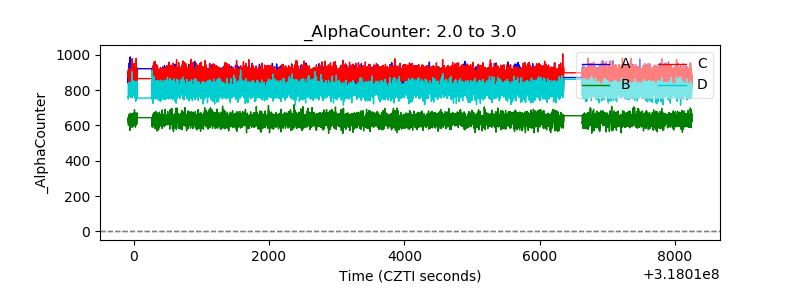 |
| _CPM_Rate | 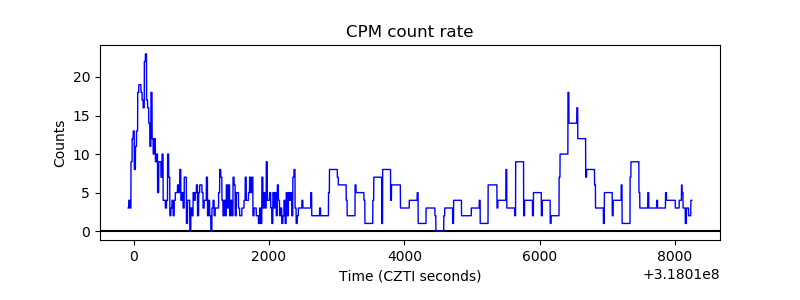 |
| CZT Counter | 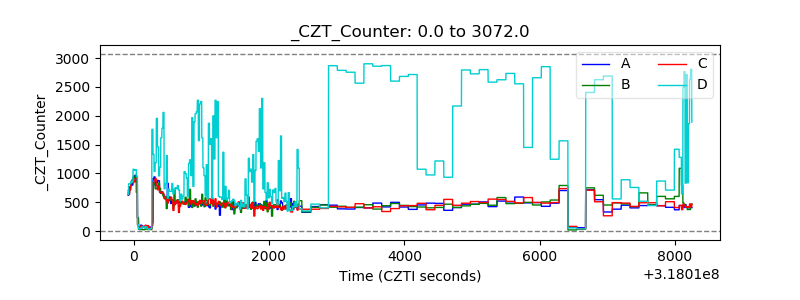 |
| +2.5 Volts monitor |  |
| +5 Volts monitor |  |
| _ROLL_ROT | 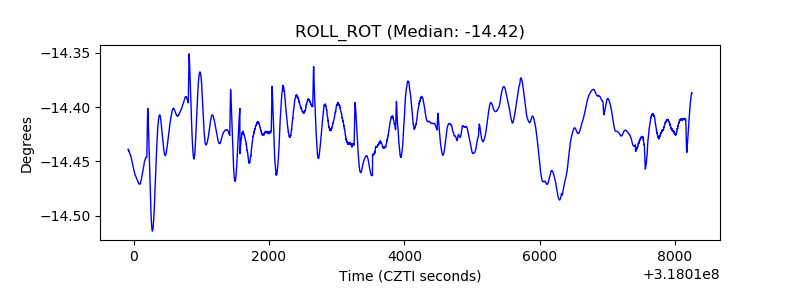 |
| _Roll_DEC | 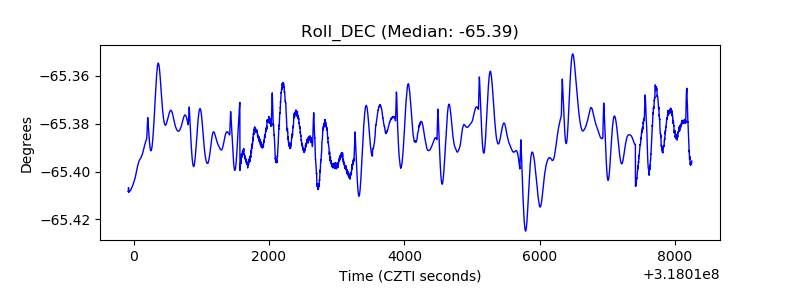 |
| _Roll_RA | 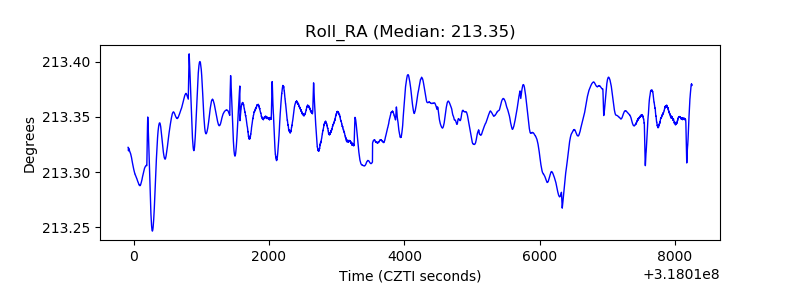 |
| Veto Counter | 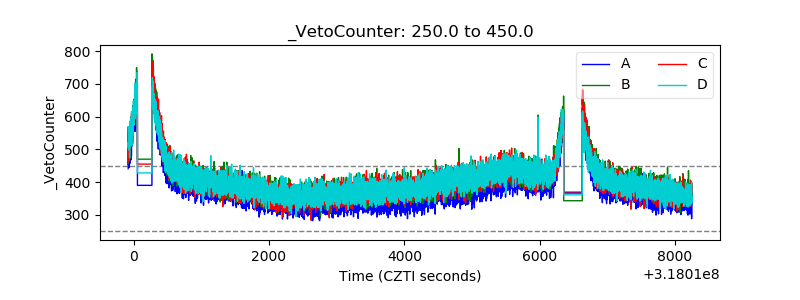 |