| Param | Original file | Final file |
|---|---|---|
| Filename | modeM0/AS1A07_100T02_9000003470_23455cztM0_level2.evt | modeM0/AS1A07_100T02_9000003470_23455cztM0_level2_quad_clean.evt |
| Size (bytes) | 630,455,040 | 103,887,360 |
| Size | 601.2 MB | 99.1 MB |
| Events in quadrant A | 3,294,011 | 688,428 |
| Events in quadrant B | 3,564,116 | 694,271 |
| Events in quadrant C | 3,426,416 | 666,921 |
| Events in quadrant D | 8,322,475 | 596,658 |
| Mode M0 | |||
|---|---|---|---|
| Quadrant | BADHDUFLAG | Total packets | Discarded packets |
| A | 0 | 14575 | 1 |
| B | 0 | 15183 | 1 |
| C | 0 | 14811 | 1 |
| D | 0 | 29619 | 1 |
| Mode M9 | |||
|---|---|---|---|
| Quadrant | BADHDUFLAG | Total packets | Discarded packets |
| A | 0 | 5 | 0 |
| B | 0 | 5 | 0 |
| C | 0 | 5 | 0 |
| D | 0 | 5 | 0 |
| Mode SS | |||
|---|---|---|---|
| Quadrant | BADHDUFLAG | Total packets | Discarded packets |
| A | 0 | 146 | 0 |
| B | 0 | 146 | 0 |
| C | 0 | 146 | 0 |
| D | 0 | 146 | 0 |
| Quadrant | Total seconds | Saturated seconds | Saturation percentage |
|---|---|---|---|
| A | 7179 | 61 | 0.849701% |
| B | 7180 | 72 | 1.002786% |
| C | 7180 | 86 | 1.197772% |
| D | 7180 | 1848 | 25.738162% |
Noise dominated data is calculated using 1-second bins in cleaned event files. If a bin has >2000 counts, and if more than 50% of those come from <1% of pixels, then it is considered to be noise-dominated and hence unusable.
| Quadrant | # 1 sec bins | Bins with >0 counts | Bins with >2000 counts | High rate bins dominated by noise | Noise dominated (total time) | Noise dominated (detector-on time) | Marked lightcurve |
|---|---|---|---|---|---|---|---|
| A | 7599 | 7180 | 0 | 0 | 0.00% | 0.00% | 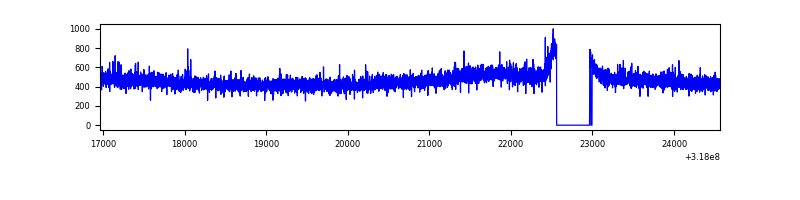 |
| B | 7600 | 7182 | 2 | 2 | 0.03% | 0.03% | 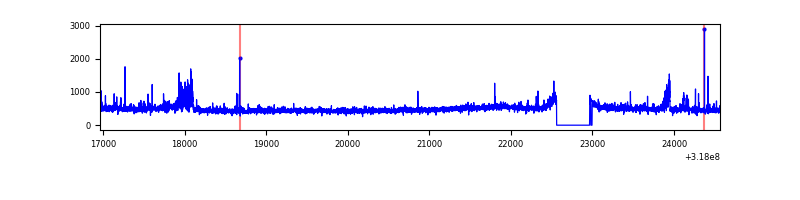 |
| C | 7600 | 7181 | 2 | 2 | 0.03% | 0.03% | 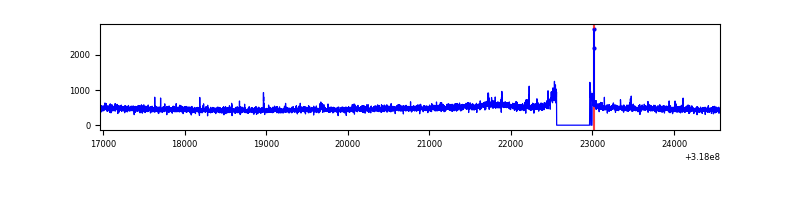 |
| D | 7600 | 7180 | 1694 | 1694 | 22.29% | 23.59% | 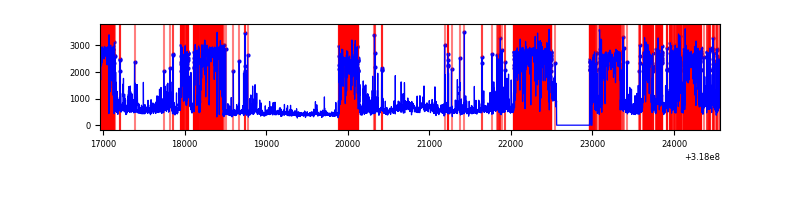 |
Top three noisy pixels from each quadrant. If the there are fewer than three noisy pixels in the level2.evt file, extra rows are filled as -1
| Pixel properties | Quadrant properties | ||||||
|---|---|---|---|---|---|---|---|
| Quadrant | DetID | PixID | Counts | Sigma | Mean | Median | Sigma |
| A | 13 | 254 | 12477 | 67.18 | 853 | 832 | 173.3 |
| A | 0 | 226 | 7385 | 37.8 | 853 | 832 | 173.3 |
| A | 3 | 137 | 7020 | 35.7 | 853 | 832 | 173.3 |
| B | 0 | 190 | 120647 | 749.45 | 849 | 828 | 159.9 |
| B | 0 | 219 | 42054 | 257.86 | 849 | 828 | 159.9 |
| B | 0 | 229 | 32697 | 199.34 | 849 | 828 | 159.9 |
| C | 14 | 238 | 128279 | 666.19 | 814 | 816 | 191.3 |
| C | 3 | 233 | 45178 | 231.86 | 814 | 816 | 191.3 |
| C | 7 | 247 | 31194 | 158.77 | 814 | 816 | 191.3 |
| D | 1 | 52 | 3232631 | 18473.09 | 708 | 685 | 175.0 |
| D | 7 | 38 | 1035585 | 5915.26 | 708 | 685 | 175.0 |
| D | 12 | 233 | 665811 | 3801.71 | 708 | 685 | 175.0 |
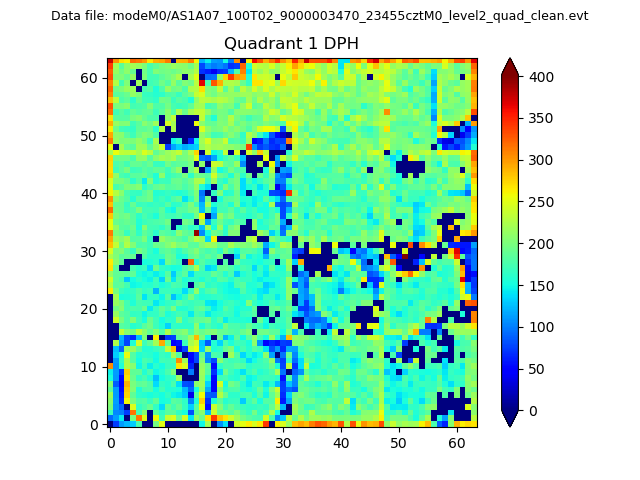
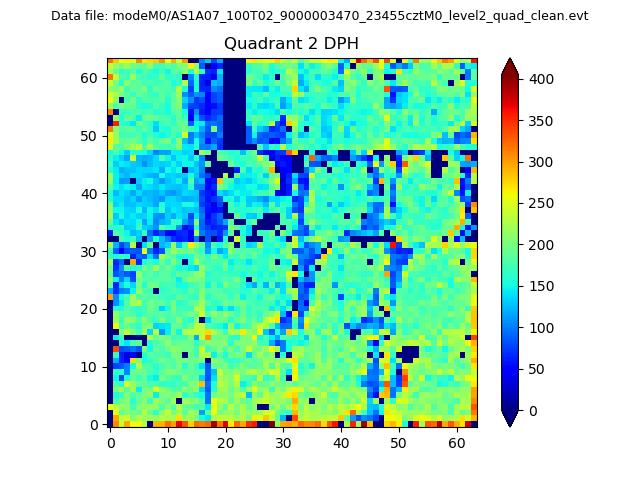
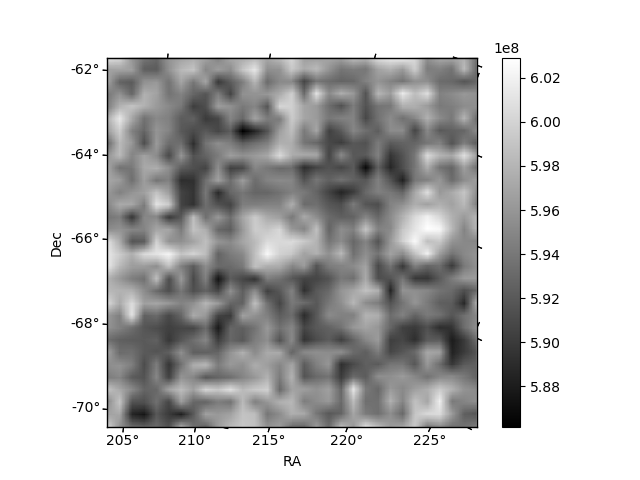
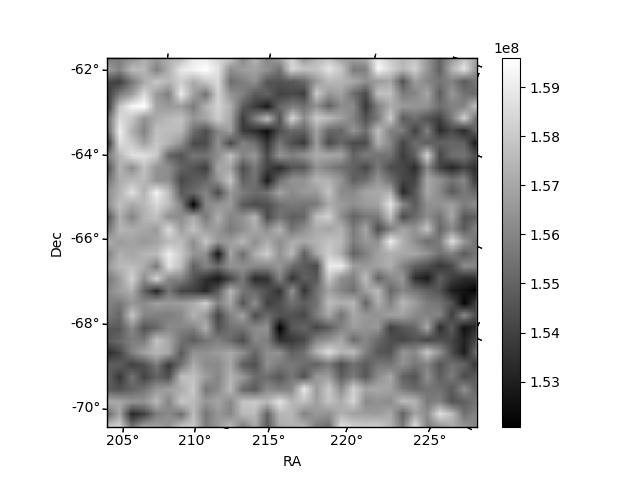
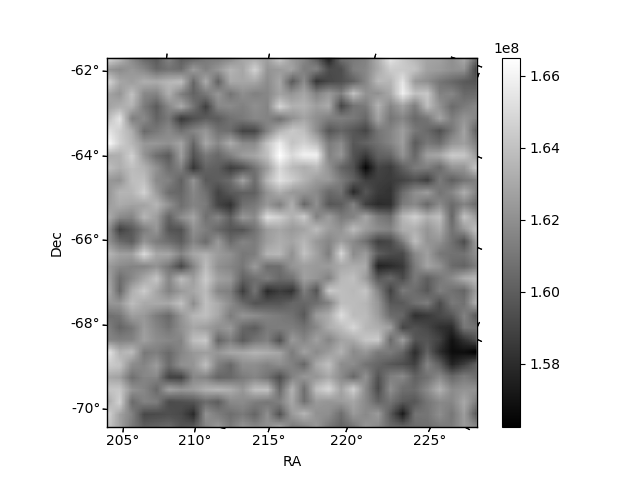
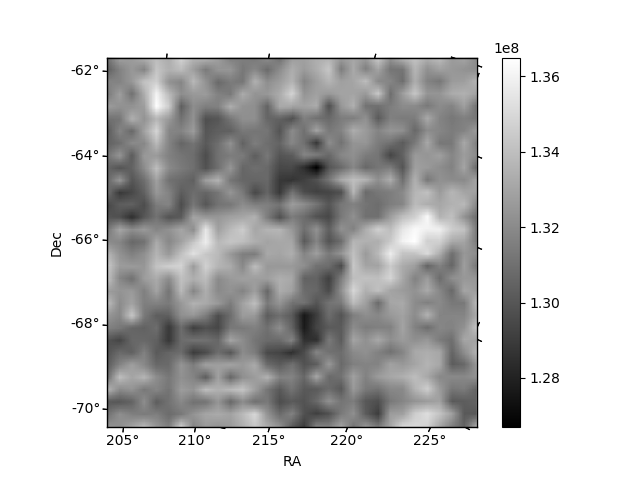
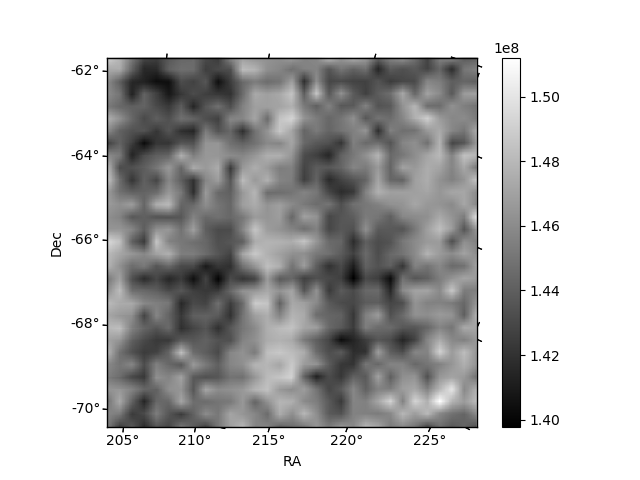
Histogram calculated using DETX and DETY for each event in the final _common_clean file
| Quadrant A |  |
 |
Quadrant B |
|---|---|---|---|
| Quadrant D | 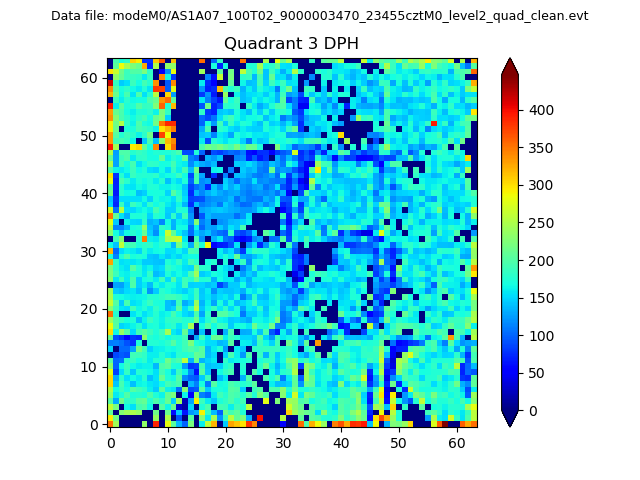 |
 |
Quadrant C |
| Plot type | Count rate plots | Images |
|---|---|---|
| Comparison with Poisson distribution Blue bars denote a histogram of data divided into 1 sec bins. Red curve is a Poisson curve with rate = median count rate of data. |
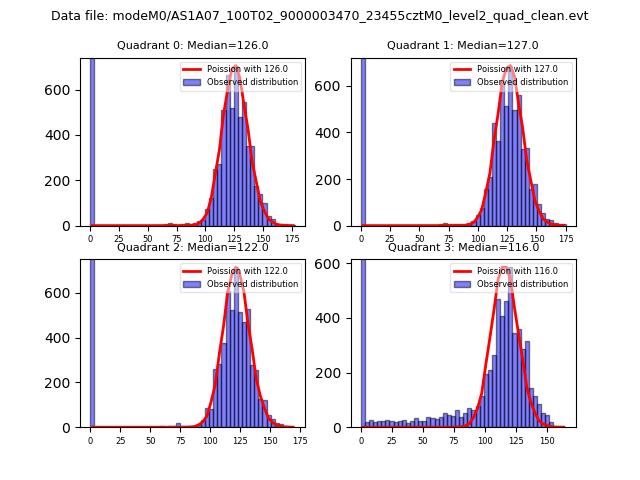 |
 |
| Quadrant-wise count rates Data is divided into 100 sec bins |
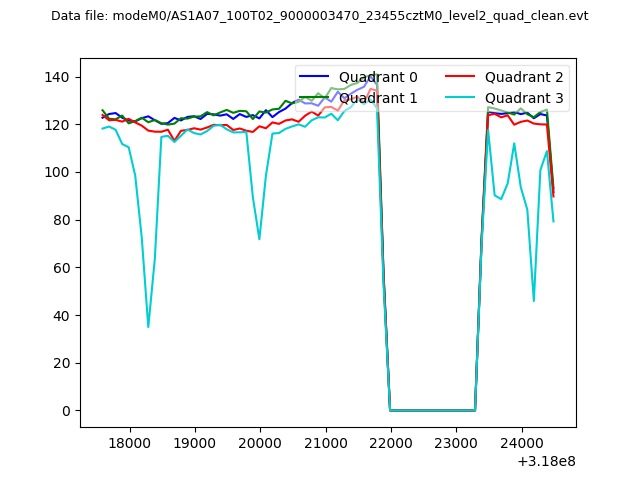 |
|
| Module-wise count rates for Quadrant A Data is divided into 100 sec bins |
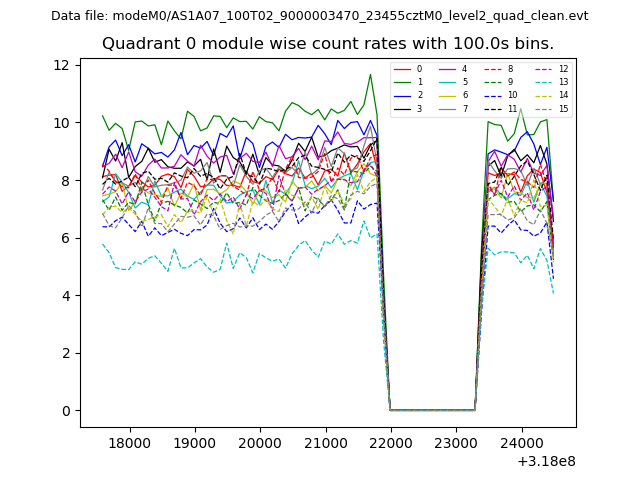 |
 |
| Module-wise count rates for Quadrant B Data is divided into 100 sec bins |
 |
 |
| Module-wise count rates for Quadrant C Data is divided into 100 sec bins |
 |
 |
| Module-wise count rates for Quadrant D Data is divided into 100 sec bins |
 |
 |
| Parameter | Plot |
|---|---|
| CZT HV Monitor | 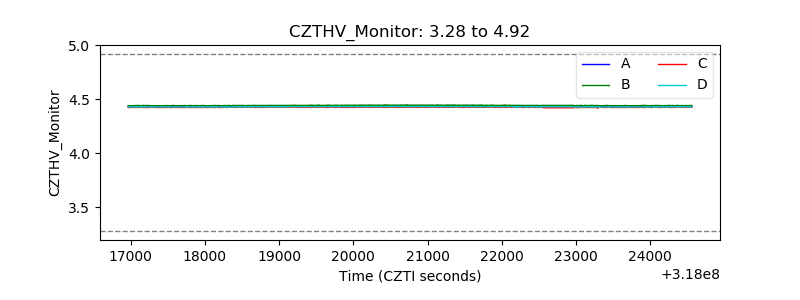 |
| D_VDD |  |
| Temperature 1 | 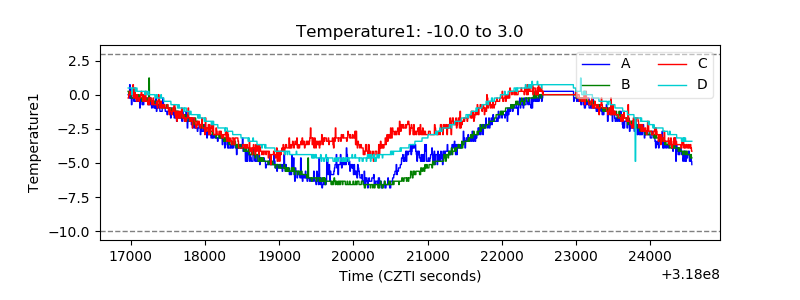 |
| Veto HV Monitor | 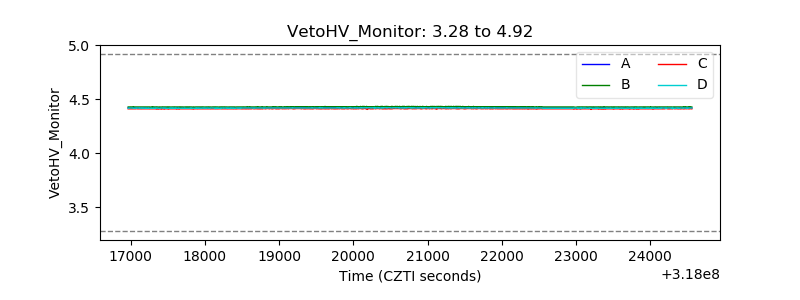 |
| Veto LLD |  |
| Alpha Counter | 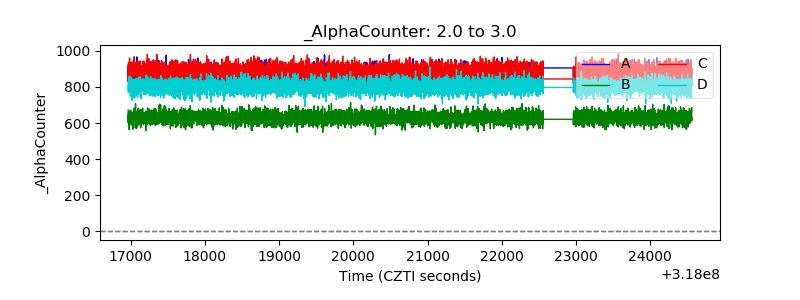 |
| _CPM_Rate | 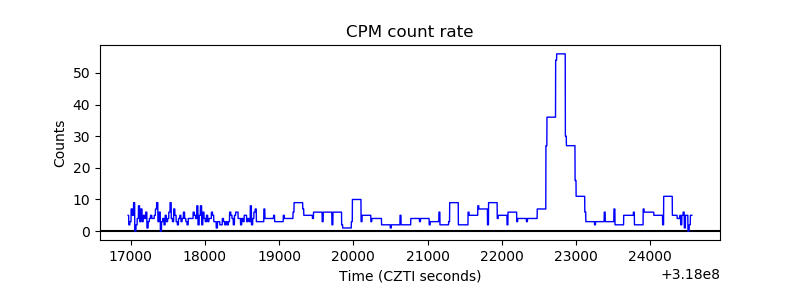 |
| CZT Counter | 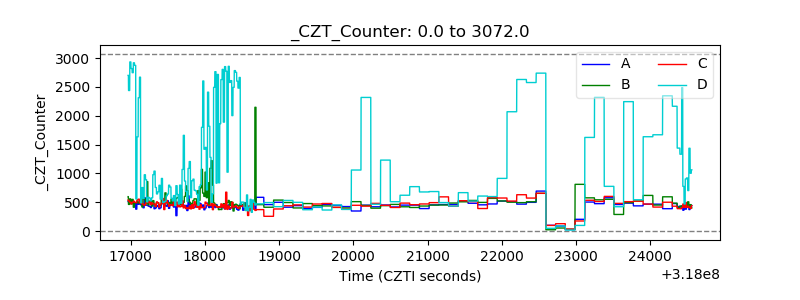 |
| +2.5 Volts monitor |  |
| +5 Volts monitor | 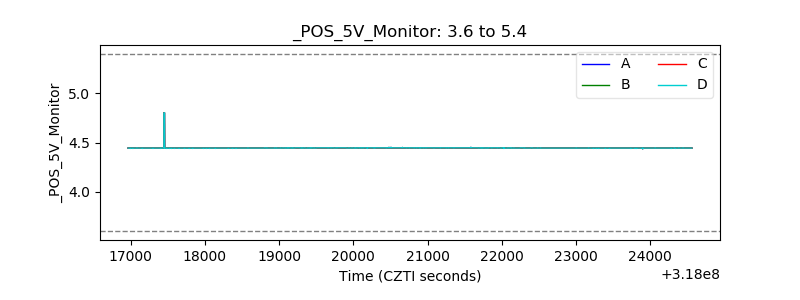 |
| _ROLL_ROT | 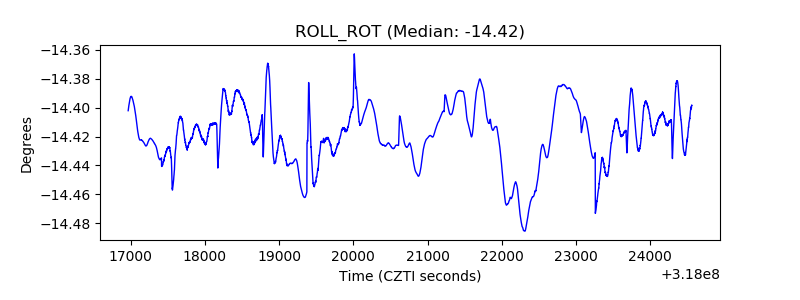 |
| _Roll_DEC | 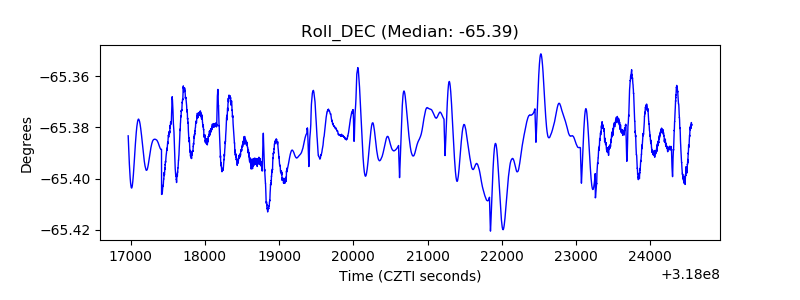 |
| _Roll_RA | 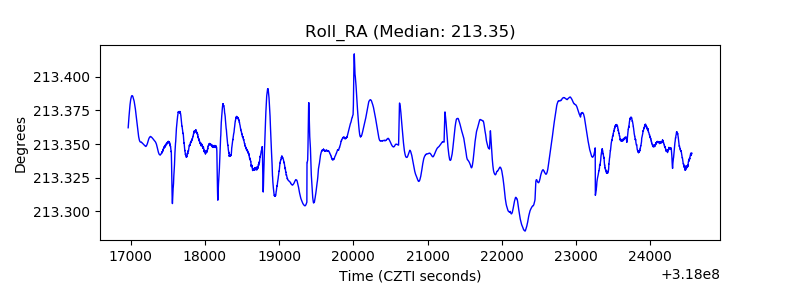 |
| Veto Counter | 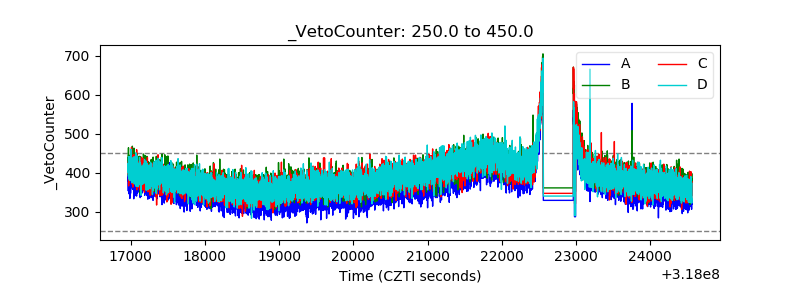 |