| Param | Original file | Final file |
|---|---|---|
| Filename | modeM0/AS1A07_100T02_9000003470_23457cztM0_level2.evt | modeM0/AS1A07_100T02_9000003470_23457cztM0_level2_quad_clean.evt |
| Size (bytes) | 1,211,037,120 | 186,713,280 |
| Size | 1.1 GB | 178.1 MB |
| Events in quadrant A | 5,807,979 | 1,271,389 |
| Events in quadrant B | 6,190,817 | 1,290,945 |
| Events in quadrant C | 5,924,132 | 1,231,765 |
| Events in quadrant D | 17,907,567 | 993,614 |
| Mode M0 | |||
|---|---|---|---|
| Quadrant | BADHDUFLAG | Total packets | Discarded packets |
| A | 0 | 25578 | 2 |
| B | 0 | 26368 | 2 |
| C | 0 | 25633 | 2 |
| D | 0 | 61753 | 2 |
| Mode M9 | |||
|---|---|---|---|
| Quadrant | BADHDUFLAG | Total packets | Discarded packets |
| A | 0 | 15 | 0 |
| B | 0 | 15 | 0 |
| C | 0 | 15 | 0 |
| D | 0 | 15 | 0 |
| Mode SS | |||
|---|---|---|---|
| Quadrant | BADHDUFLAG | Total packets | Discarded packets |
| A | 0 | 254 | 0 |
| B | 0 | 254 | 0 |
| C | 0 | 254 | 0 |
| D | 0 | 254 | 0 |
| Quadrant | Total seconds | Saturated seconds | Saturation percentage |
|---|---|---|---|
| A | 12533 | 33 | 0.263305% |
| B | 12533 | 73 | 0.582462% |
| C | 12534 | 93 | 0.741982% |
| D | 12534 | 4229 | 33.740227% |
Noise dominated data is calculated using 1-second bins in cleaned event files. If a bin has >2000 counts, and if more than 50% of those come from <1% of pixels, then it is considered to be noise-dominated and hence unusable.
| Quadrant | # 1 sec bins | Bins with >0 counts | Bins with >2000 counts | High rate bins dominated by noise | Noise dominated (total time) | Noise dominated (detector-on time) | Marked lightcurve |
|---|---|---|---|---|---|---|---|
| A | 13948 | 12535 | 1 | 1 | 0.01% | 0.01% | 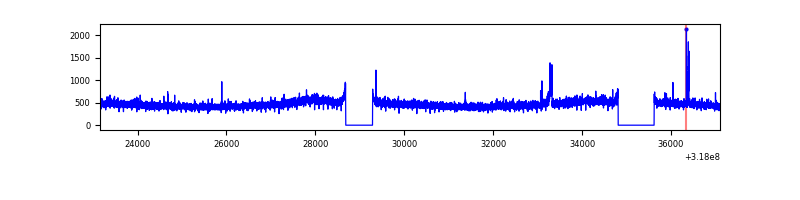 |
| B | 13948 | 12535 | 8 | 8 | 0.06% | 0.06% | 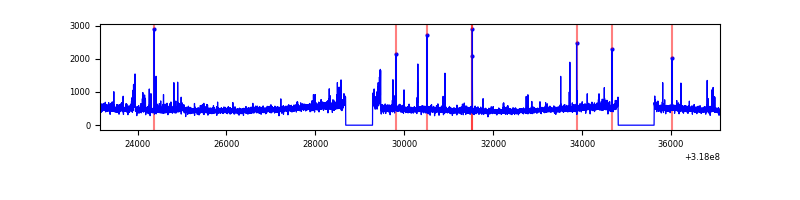 |
| C | 13949 | 12536 | 2 | 2 | 0.01% | 0.02% | 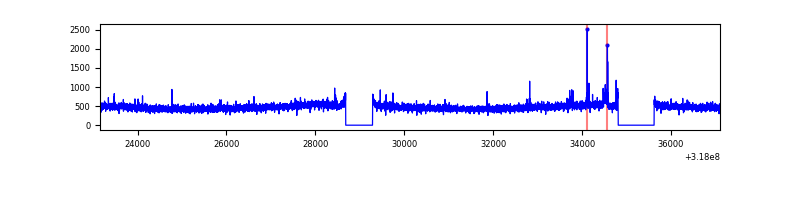 |
| D | 13949 | 12534 | 4092 | 4092 | 29.34% | 32.65% | 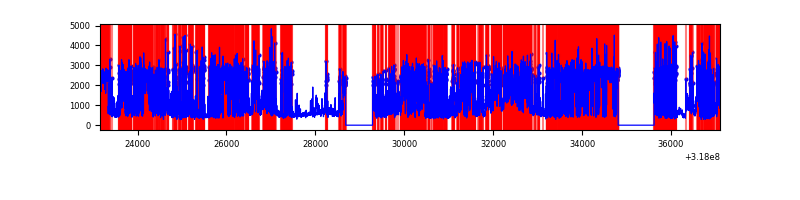 |
Top three noisy pixels from each quadrant. If the there are fewer than three noisy pixels in the level2.evt file, extra rows are filled as -1
| Pixel properties | Quadrant properties | ||||||
|---|---|---|---|---|---|---|---|
| Quadrant | DetID | PixID | Counts | Sigma | Mean | Median | Sigma |
| A | 15 | 174 | 70647 | 231.27 | 1484 | 1451 | 299.2 |
| A | 13 | 254 | 22306 | 69.7 | 1484 | 1451 | 299.2 |
| A | 14 | 235 | 15477 | 46.88 | 1484 | 1451 | 299.2 |
| B | 0 | 190 | 102274 | 361.34 | 1485 | 1446 | 279.0 |
| B | 15 | 35 | 75152 | 264.14 | 1485 | 1446 | 279.0 |
| B | 0 | 219 | 57751 | 201.78 | 1485 | 1446 | 279.0 |
| C | 14 | 238 | 223806 | 669.82 | 1425 | 1432 | 332.0 |
| C | 10 | 9 | 59649 | 175.36 | 1425 | 1432 | 332.0 |
| C | 7 | 247 | 31635 | 90.98 | 1425 | 1432 | 332.0 |
| D | 1 | 52 | 9854821 | 34354.25 | 1176 | 1140 | 286.8 |
| D | 7 | 238 | 1715300 | 5976.31 | 1176 | 1140 | 286.8 |
| D | 7 | 38 | 1029858 | 3586.56 | 1176 | 1140 | 286.8 |
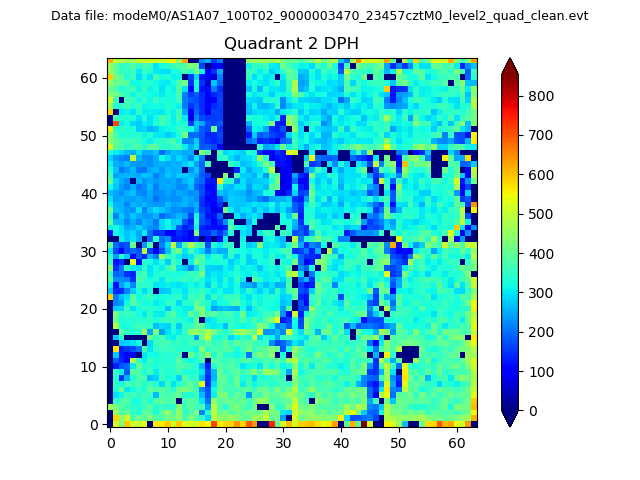
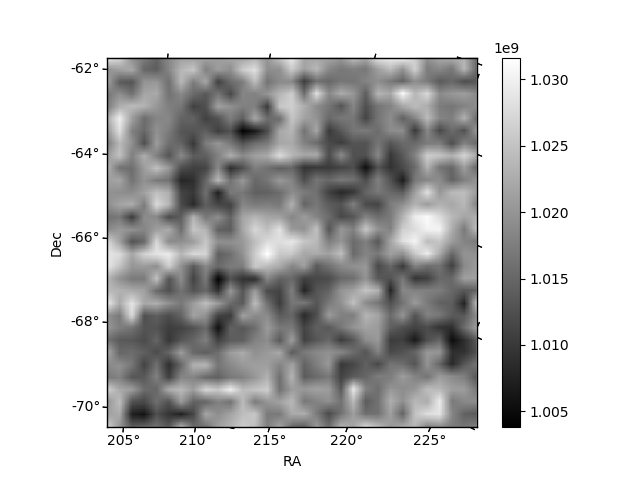
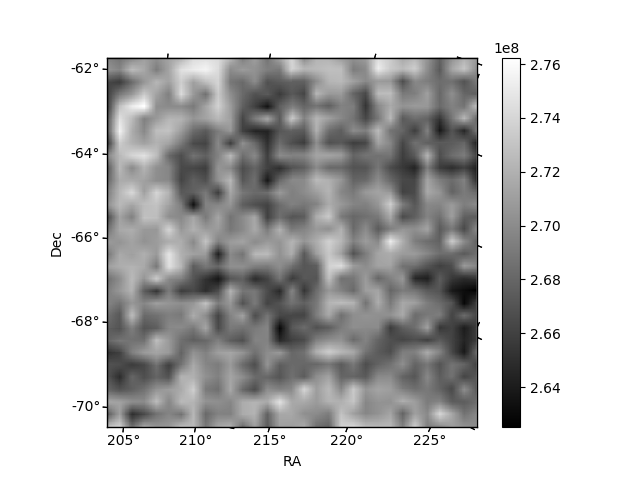
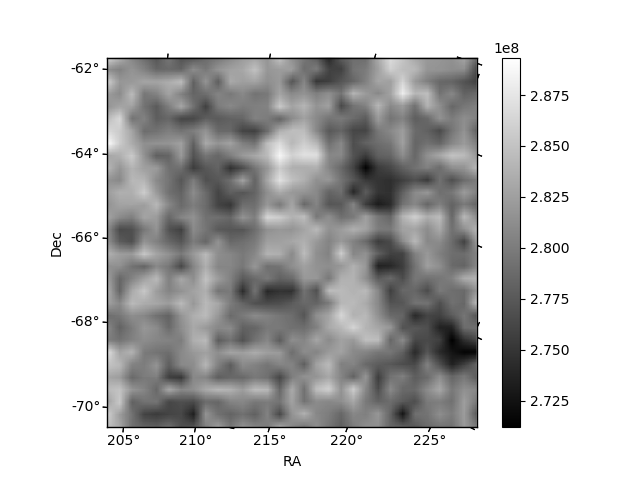
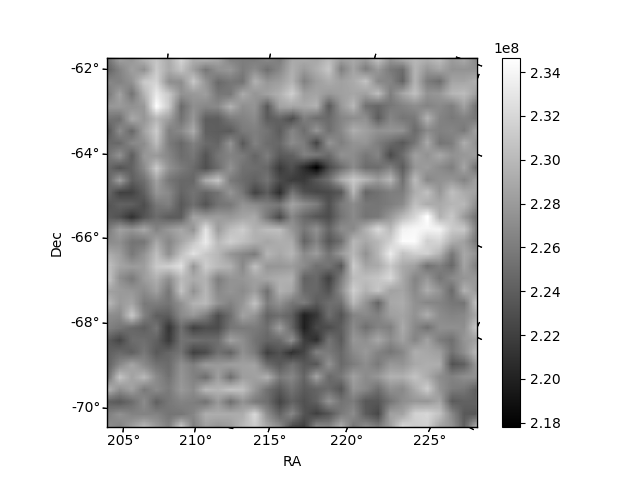
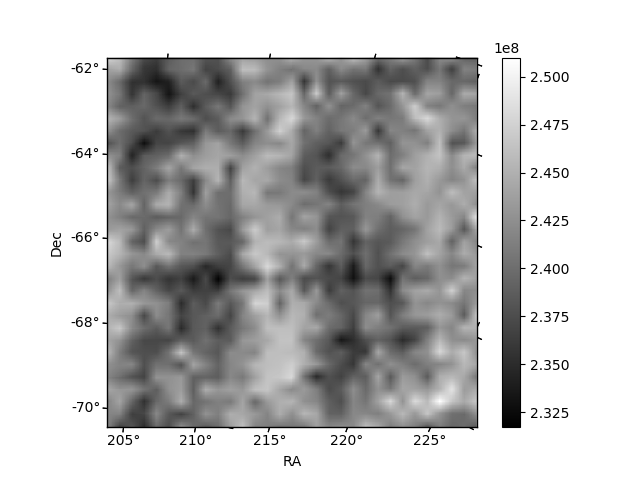
Histogram calculated using DETX and DETY for each event in the final _common_clean file
| Quadrant A | 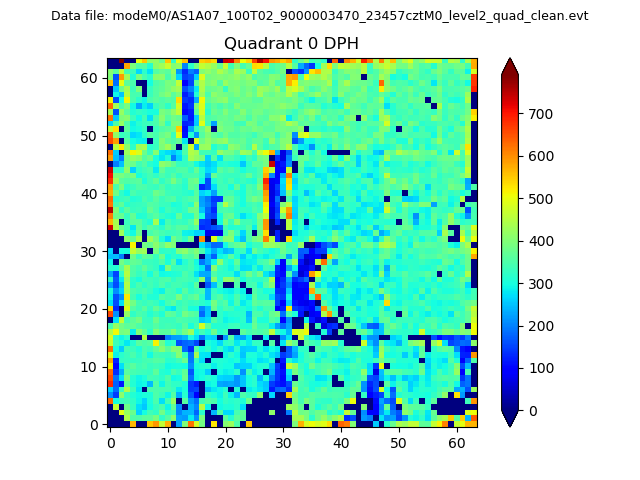 |
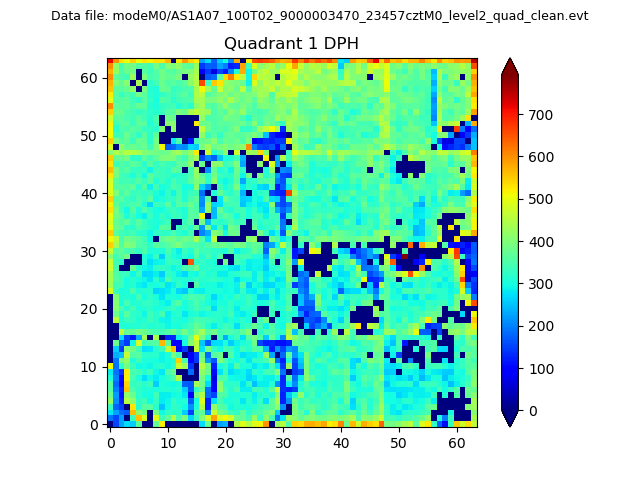 |
Quadrant B |
|---|---|---|---|
| Quadrant D | 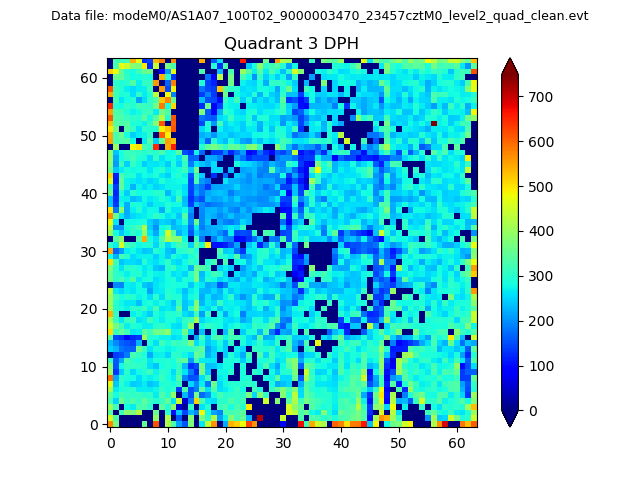 |
 |
Quadrant C |
| Plot type | Count rate plots | Images |
|---|---|---|
| Comparison with Poisson distribution Blue bars denote a histogram of data divided into 1 sec bins. Red curve is a Poisson curve with rate = median count rate of data. |
 |
 |
| Quadrant-wise count rates Data is divided into 100 sec bins |
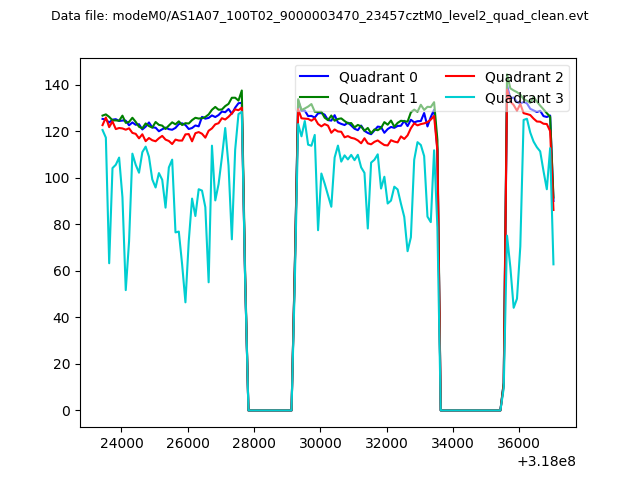 |
|
| Module-wise count rates for Quadrant A Data is divided into 100 sec bins |
 |
 |
| Module-wise count rates for Quadrant B Data is divided into 100 sec bins |
 |
 |
| Module-wise count rates for Quadrant C Data is divided into 100 sec bins |
 |
 |
| Module-wise count rates for Quadrant D Data is divided into 100 sec bins |
 |
 |
| Parameter | Plot |
|---|---|
| CZT HV Monitor | 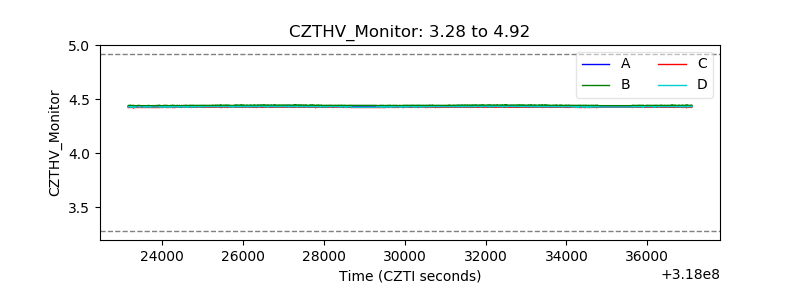 |
| D_VDD | 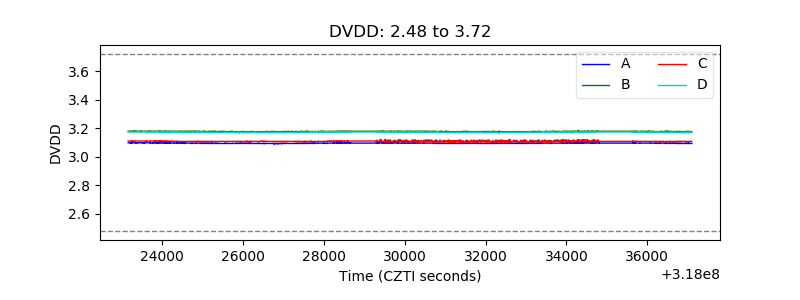 |
| Temperature 1 |  |
| Veto HV Monitor | 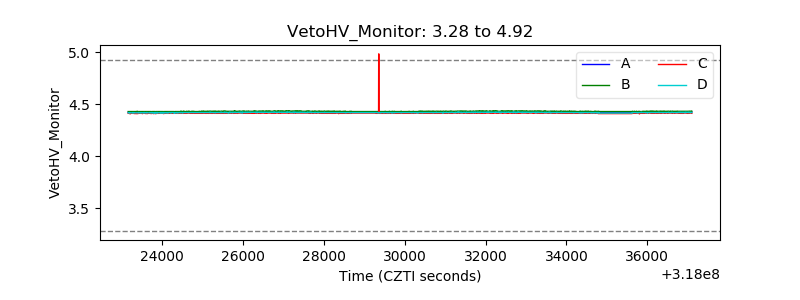 |
| Veto LLD | 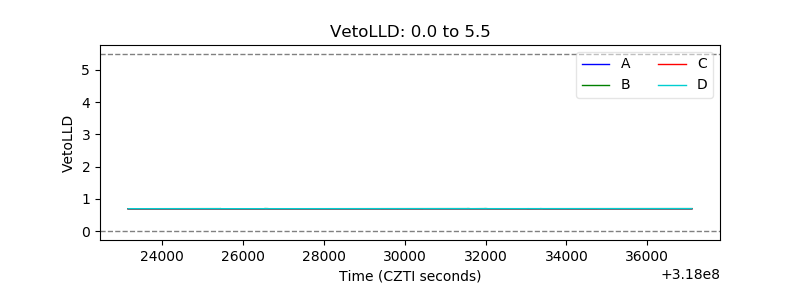 |
| Alpha Counter | 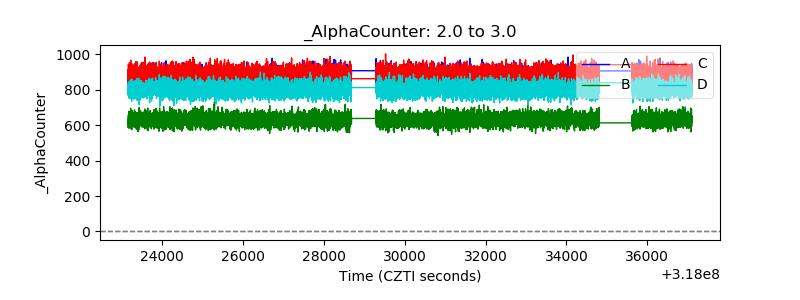 |
| _CPM_Rate | 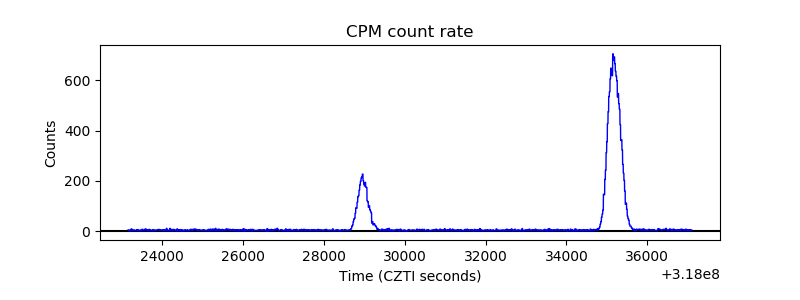 |
| CZT Counter | 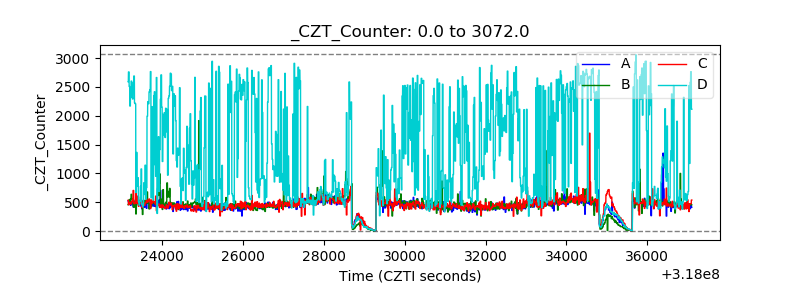 |
| +2.5 Volts monitor |  |
| +5 Volts monitor |  |
| _ROLL_ROT |  |
| _Roll_DEC |  |
| _Roll_RA | 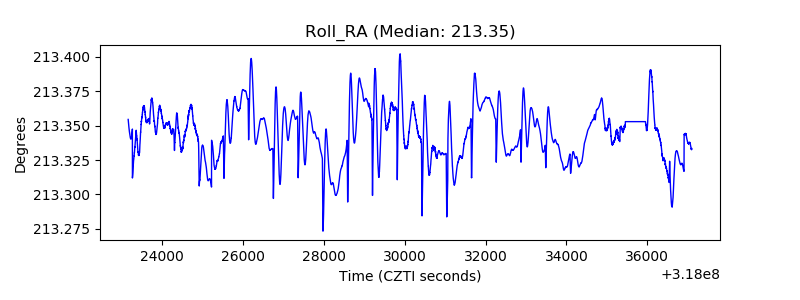 |
| Veto Counter |  |