| Param | Original file | Final file |
|---|---|---|
| Filename | modeM0/AS1A07_100T02_9000003470_23458cztM0_level2.evt | modeM0/AS1A07_100T02_9000003470_23458cztM0_level2_quad_clean.evt |
| Size (bytes) | 645,373,440 | 98,573,760 |
| Size | 615.5 MB | 94.0 MB |
| Events in quadrant A | 3,199,114 | 673,687 |
| Events in quadrant B | 3,268,763 | 692,843 |
| Events in quadrant C | 3,328,821 | 657,824 |
| Events in quadrant D | 9,294,000 | 492,376 |
| Mode M0 | |||
|---|---|---|---|
| Quadrant | BADHDUFLAG | Total packets | Discarded packets |
| A | 0 | 13863 | 2 |
| B | 0 | 14018 | 2 |
| C | 0 | 13990 | 3 |
| D | 0 | 32056 | 2 |
| Mode M9 | |||
|---|---|---|---|
| Quadrant | BADHDUFLAG | Total packets | Discarded packets |
| A | 0 | 15 | 0 |
| B | 0 | 16 | 0 |
| C | 0 | 16 | 0 |
| D | 0 | 16 | 0 |
| Mode SS | |||
|---|---|---|---|
| Quadrant | BADHDUFLAG | Total packets | Discarded packets |
| A | 0 | 136 | 0 |
| B | 0 | 136 | 0 |
| C | 0 | 136 | 0 |
| D | 0 | 136 | 0 |
| Quadrant | Total seconds | Saturated seconds | Saturation percentage |
|---|---|---|---|
| A | 6709 | 17 | 0.253391% |
| B | 6709 | 23 | 0.342823% |
| C | 6708 | 63 | 0.939177% |
| D | 6708 | 2289 | 34.123435% |
Noise dominated data is calculated using 1-second bins in cleaned event files. If a bin has >2000 counts, and if more than 50% of those come from <1% of pixels, then it is considered to be noise-dominated and hence unusable.
| Quadrant | # 1 sec bins | Bins with >0 counts | Bins with >2000 counts | High rate bins dominated by noise | Noise dominated (total time) | Noise dominated (detector-on time) | Marked lightcurve |
|---|---|---|---|---|---|---|---|
| A | 7669 | 6710 | 3 | 3 | 0.04% | 0.04% | 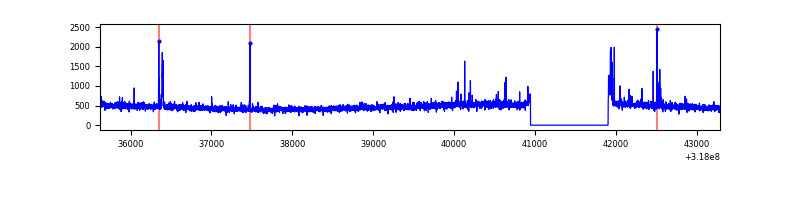 |
| B | 7669 | 6710 | 1 | 1 | 0.01% | 0.01% | 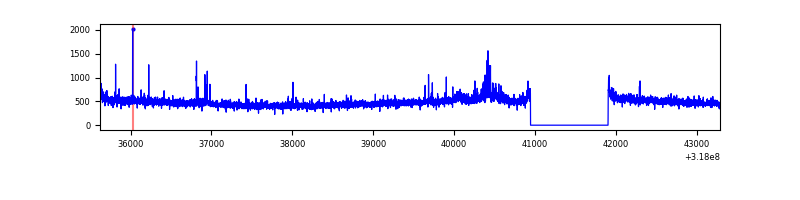 |
| C | 7668 | 6709 | 4 | 4 | 0.05% | 0.06% | 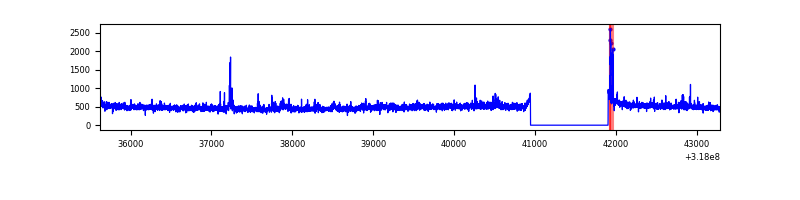 |
| D | 7668 | 6709 | 2212 | 2212 | 28.85% | 32.97% | 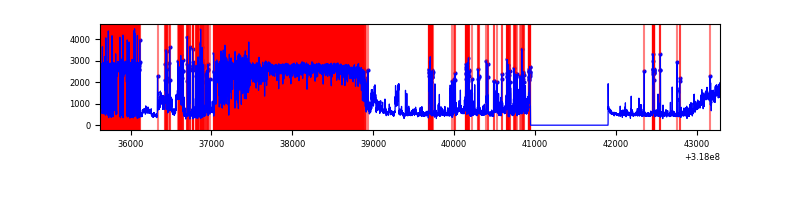 |
Top three noisy pixels from each quadrant. If the there are fewer than three noisy pixels in the level2.evt file, extra rows are filled as -1
| Pixel properties | Quadrant properties | ||||||
|---|---|---|---|---|---|---|---|
| Quadrant | DetID | PixID | Counts | Sigma | Mean | Median | Sigma |
| A | 12 | 96 | 42917 | 260.57 | 804 | 788 | 161.7 |
| A | 15 | 174 | 28048 | 168.61 | 804 | 788 | 161.7 |
| A | 10 | 253 | 12774 | 74.14 | 804 | 788 | 161.7 |
| B | 0 | 189 | 25994 | 162.78 | 810 | 790 | 154.8 |
| B | 15 | 35 | 24334 | 152.06 | 810 | 790 | 154.8 |
| B | 12 | 111 | 17889 | 110.43 | 810 | 790 | 154.8 |
| C | 14 | 238 | 121350 | 661.55 | 779 | 784 | 182.2 |
| C | 10 | 9 | 51515 | 278.36 | 779 | 784 | 182.2 |
| C | 7 | 247 | 33867 | 181.53 | 779 | 784 | 182.2 |
| D | 7 | 238 | 3668256 | 22653.12 | 665 | 646 | 161.9 |
| D | 1 | 52 | 2863893 | 17684.95 | 665 | 646 | 161.9 |
| D | 12 | 233 | 121681 | 747.58 | 665 | 646 | 161.9 |
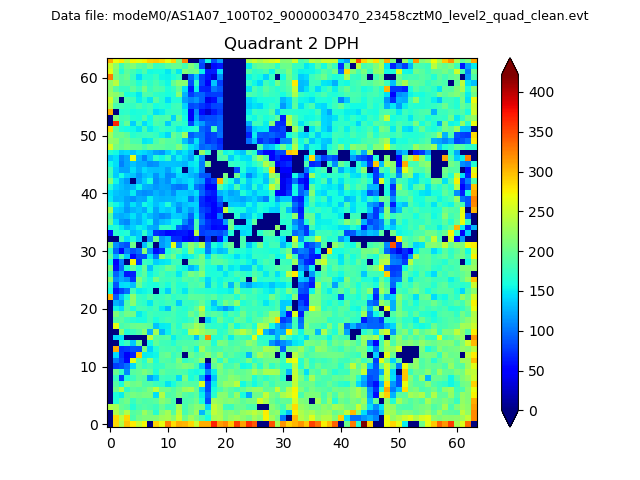
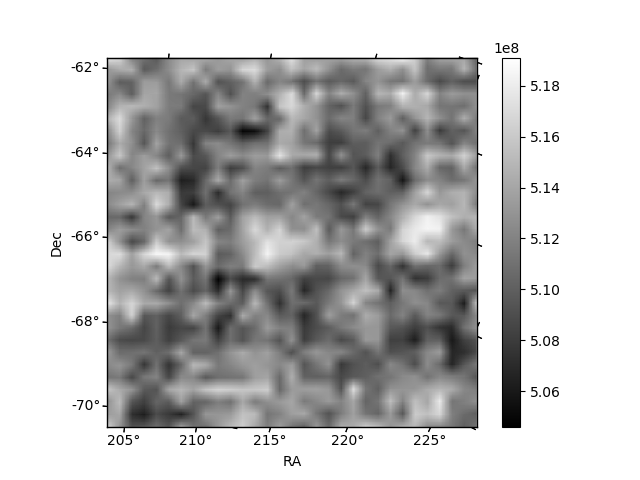
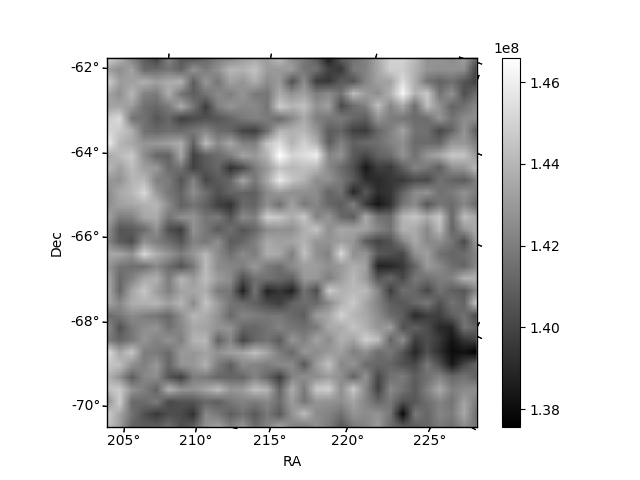
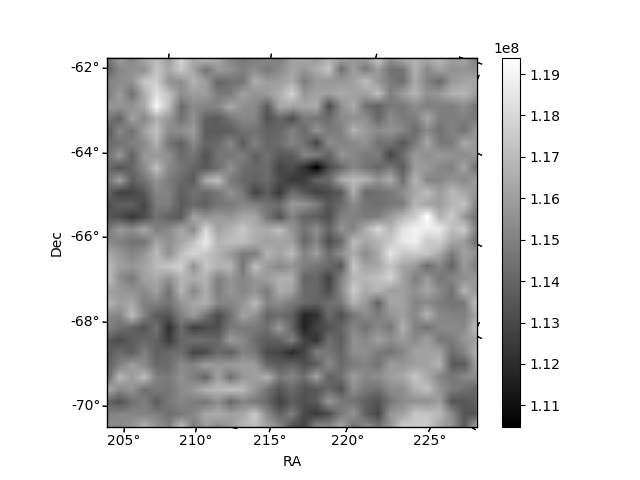
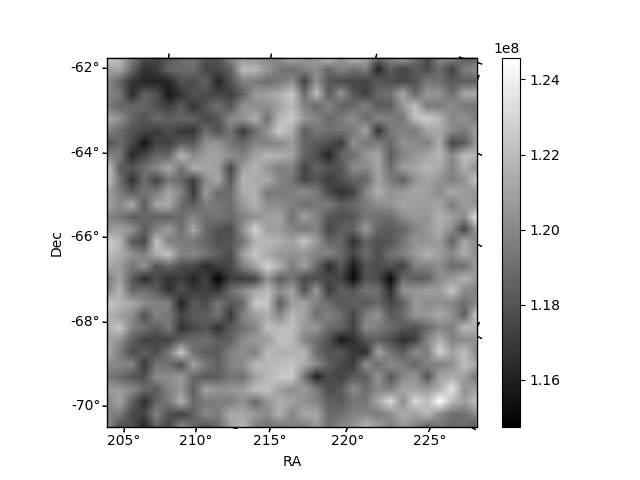
Histogram calculated using DETX and DETY for each event in the final _common_clean file
| Quadrant A | 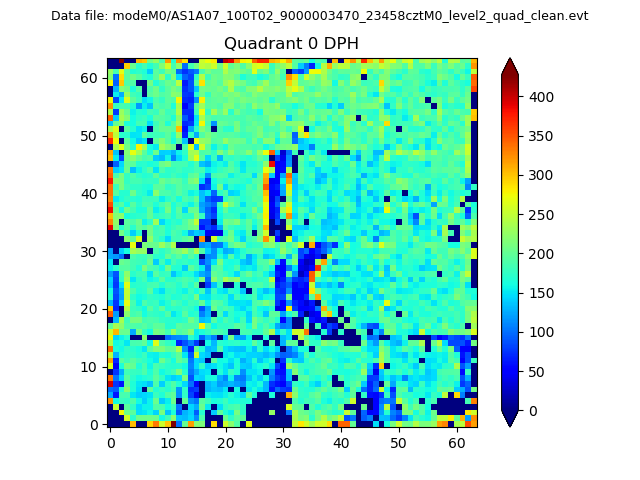 |
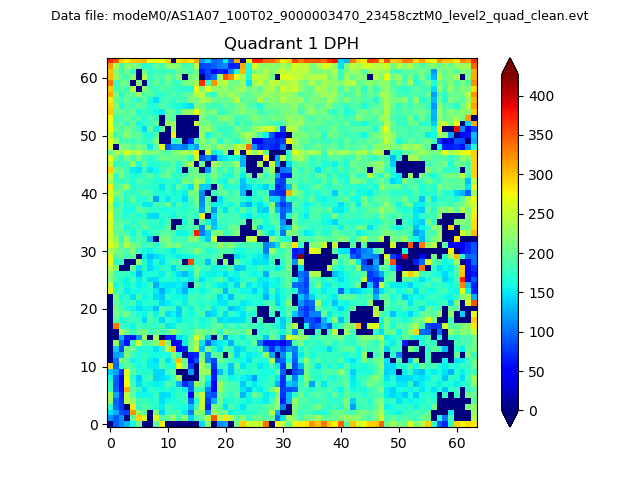 |
Quadrant B |
|---|---|---|---|
| Quadrant D | 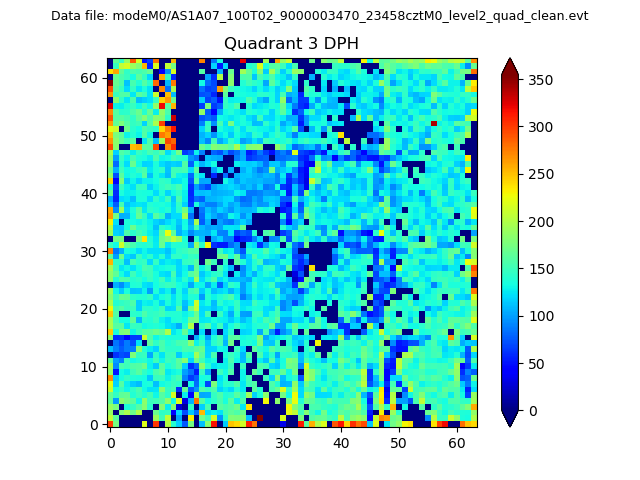 |
 |
Quadrant C |
| Plot type | Count rate plots | Images |
|---|---|---|
| Comparison with Poisson distribution Blue bars denote a histogram of data divided into 1 sec bins. Red curve is a Poisson curve with rate = median count rate of data. |
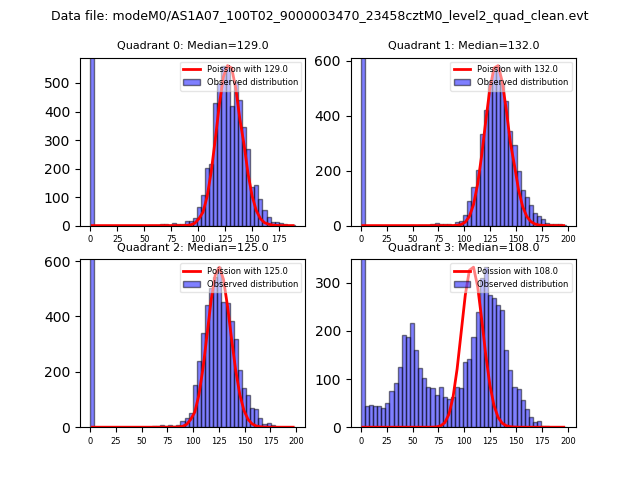 |
 |
| Quadrant-wise count rates Data is divided into 100 sec bins |
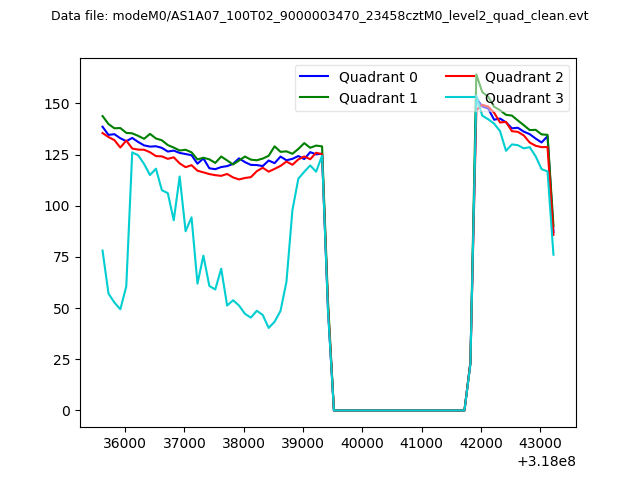 |
|
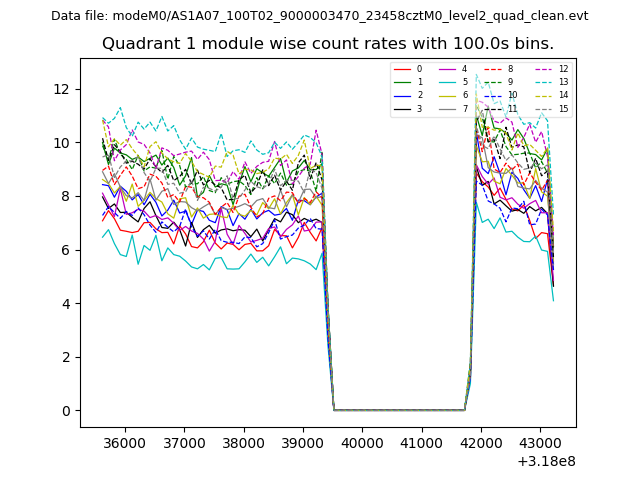
| Module-wise count rates for Quadrant A Data is divided into 100 sec bins |
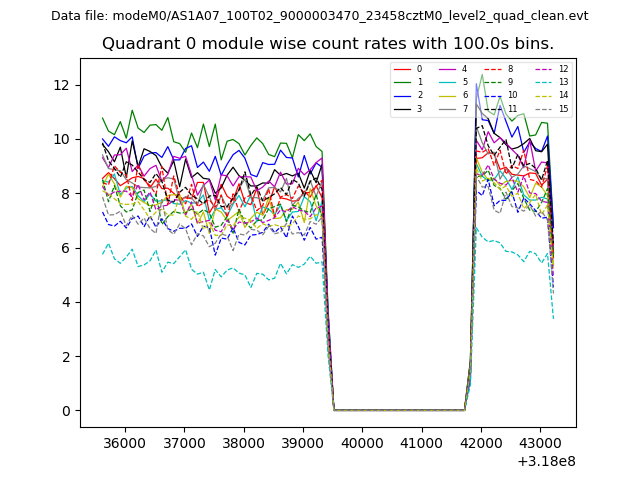 |
 |
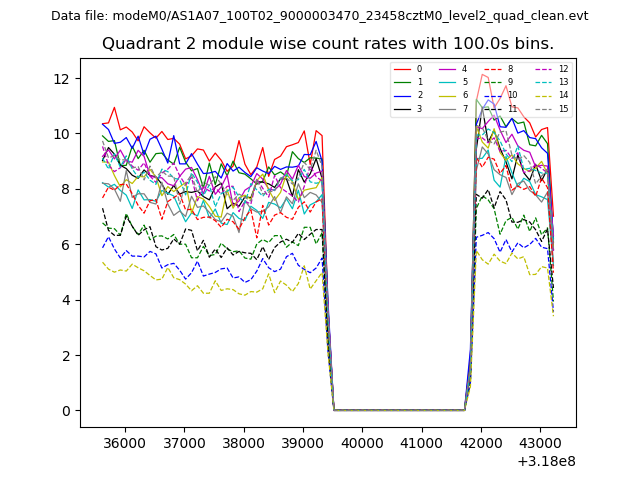
| Module-wise count rates for Quadrant B Data is divided into 100 sec bins |
 |
 |
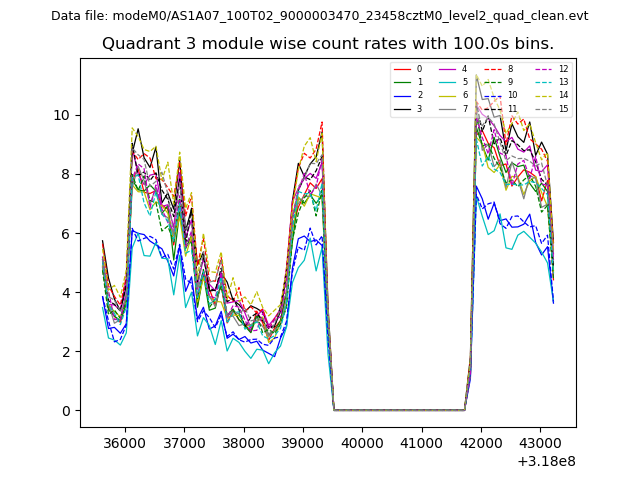
| Module-wise count rates for Quadrant C Data is divided into 100 sec bins |
 |
 |
| Module-wise count rates for Quadrant D Data is divided into 100 sec bins |
 |
 |
| Parameter | Plot |
|---|---|
| CZT HV Monitor | 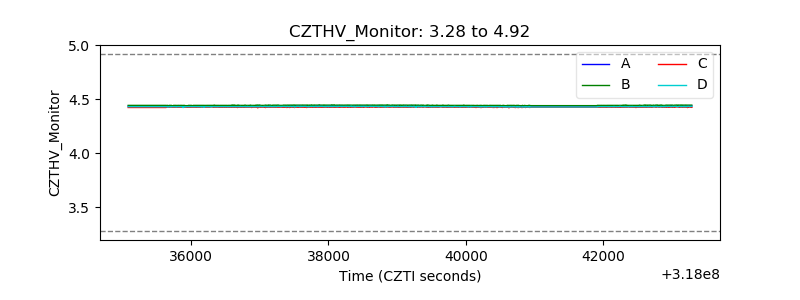 |
| D_VDD | 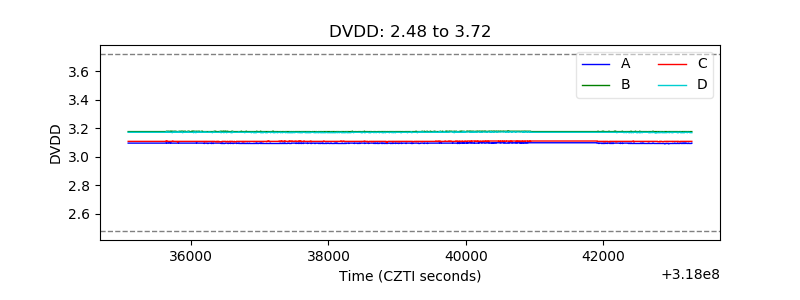 |
| Temperature 1 | 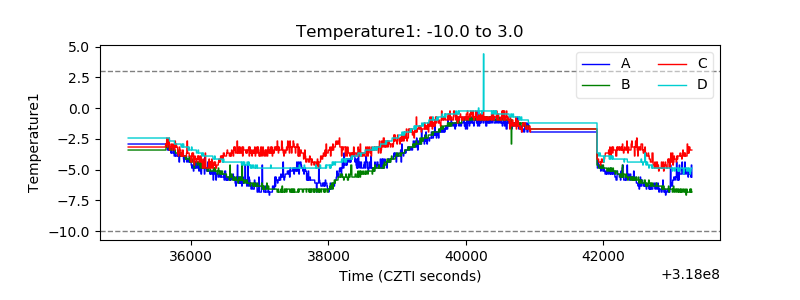 |
| Veto HV Monitor | 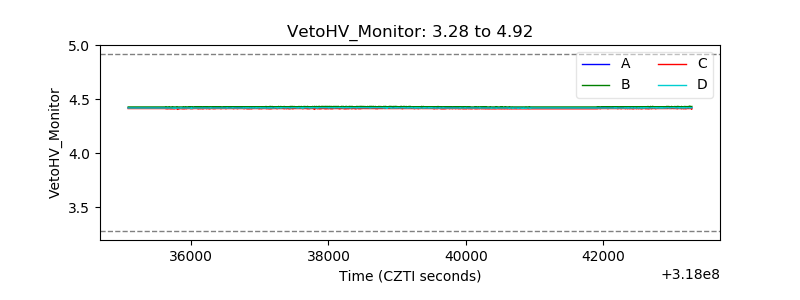 |
| Veto LLD | 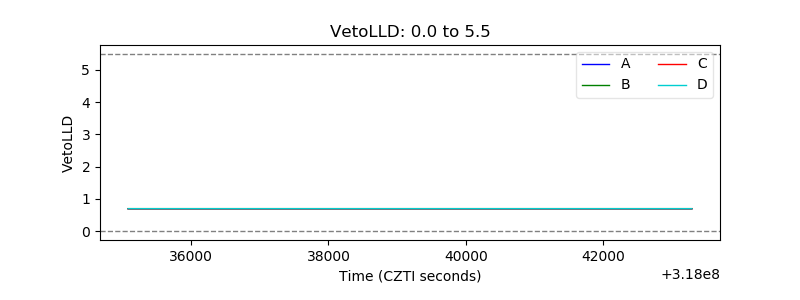 |
| Alpha Counter | 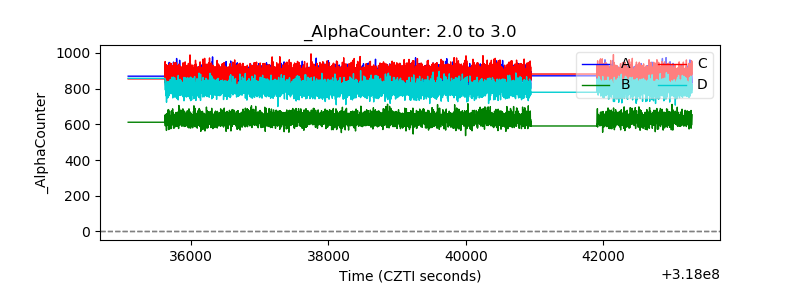 |
| _CPM_Rate | 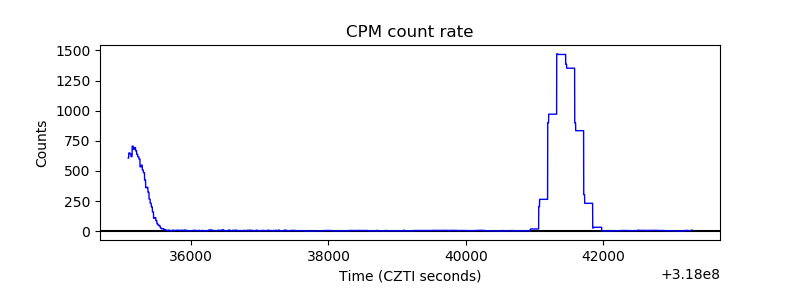 |
| CZT Counter | 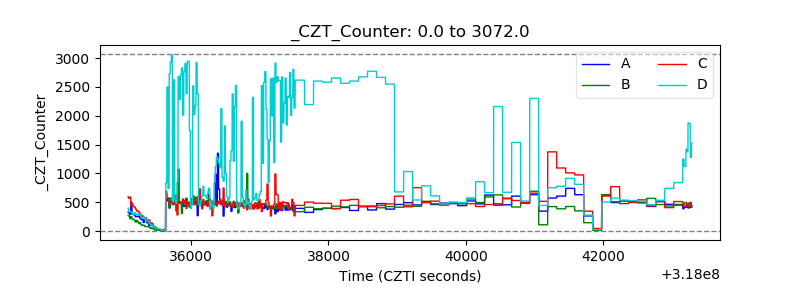 |
| +2.5 Volts monitor |  |
| +5 Volts monitor |  |
| _ROLL_ROT | 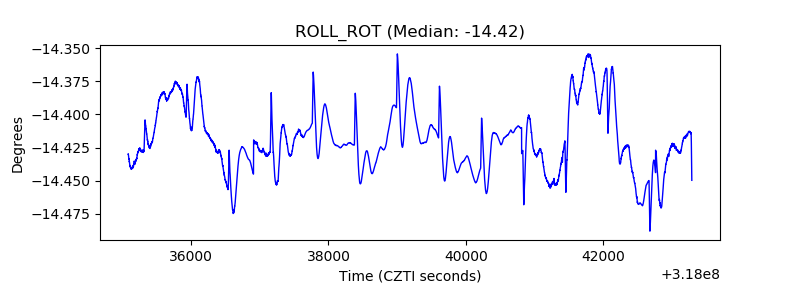 |
| _Roll_DEC | 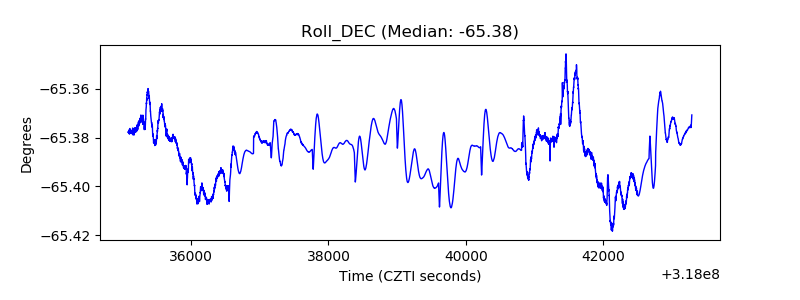 |
| _Roll_RA | 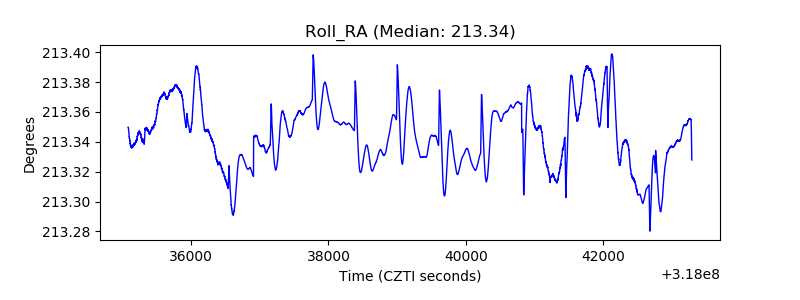 |
| Veto Counter | 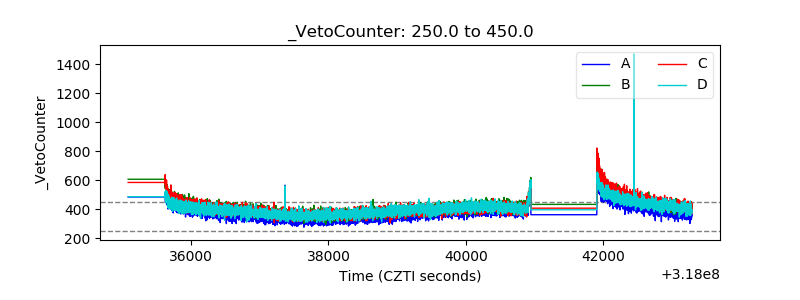 |