| Param | Original file | Final file |
|---|---|---|
| Filename | modeM0/AS1A07_100T02_9000003470_23459cztM0_level2.evt | modeM0/AS1A07_100T02_9000003470_23459cztM0_level2_quad_clean.evt |
| Size (bytes) | 572,420,160 | 103,040,640 |
| Size | 545.9 MB | 98.3 MB |
| Events in quadrant A | 3,235,521 | 682,321 |
| Events in quadrant B | 3,164,696 | 704,932 |
| Events in quadrant C | 3,339,538 | 674,757 |
| Events in quadrant D | 7,157,325 | 606,591 |
| Mode M0 | |||
|---|---|---|---|
| Quadrant | BADHDUFLAG | Total packets | Discarded packets |
| A | 0 | 13732 | 2 |
| B | 0 | 13480 | 2 |
| C | 0 | 13929 | 2 |
| D | 0 | 25618 | 2 |
| Mode M9 | |||
|---|---|---|---|
| Quadrant | BADHDUFLAG | Total packets | Discarded packets |
| A | 0 | 19 | 0 |
| B | 0 | 20 | 0 |
| C | 0 | 20 | 0 |
| D | 0 | 20 | 0 |
| Mode SS | |||
|---|---|---|---|
| Quadrant | BADHDUFLAG | Total packets | Discarded packets |
| A | 0 | 132 | 0 |
| B | 0 | 132 | 0 |
| C | 0 | 132 | 0 |
| D | 0 | 132 | 0 |
| Quadrant | Total seconds | Saturated seconds | Saturation percentage |
|---|---|---|---|
| A | 6474 | 29 | 0.447946% |
| B | 6474 | 24 | 0.370714% |
| C | 6474 | 92 | 1.421069% |
| D | 6474 | 902 | 13.932654% |
Noise dominated data is calculated using 1-second bins in cleaned event files. If a bin has >2000 counts, and if more than 50% of those come from <1% of pixels, then it is considered to be noise-dominated and hence unusable.
| Quadrant | # 1 sec bins | Bins with >0 counts | Bins with >2000 counts | High rate bins dominated by noise | Noise dominated (total time) | Noise dominated (detector-on time) | Marked lightcurve |
|---|---|---|---|---|---|---|---|
| A | 7589 | 6474 | 15 | 15 | 0.20% | 0.23% | 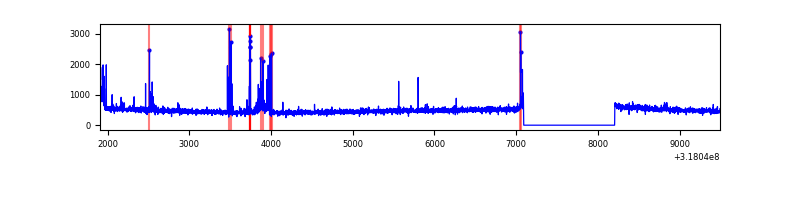 |
| B | 7589 | 6474 | 2 | 2 | 0.03% | 0.03% | 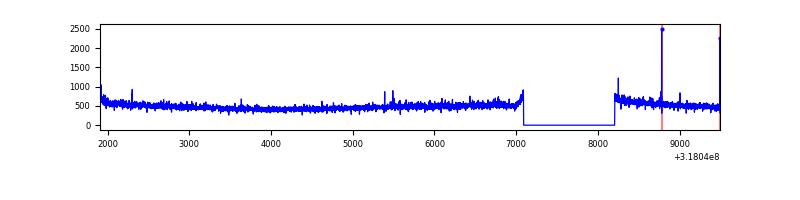 |
| C | 7589 | 6474 | 5 | 5 | 0.07% | 0.08% | 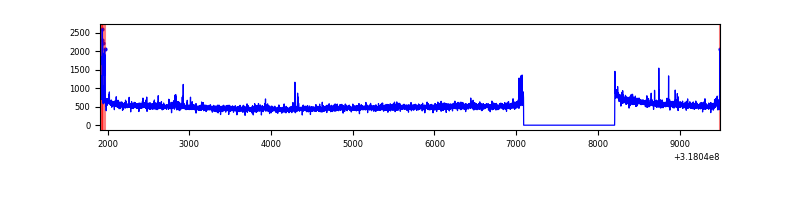 |
| D | 7588 | 6474 | 993 | 993 | 13.09% | 15.34% | 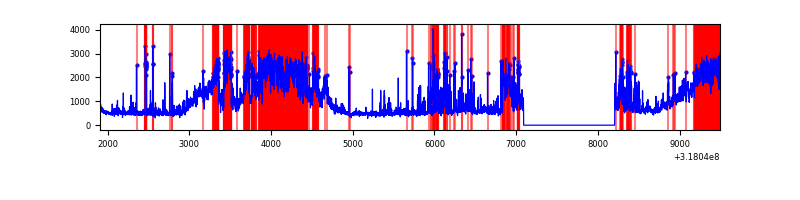 |
Top three noisy pixels from each quadrant. If the there are fewer than three noisy pixels in the level2.evt file, extra rows are filled as -1
| Pixel properties | Quadrant properties | ||||||
|---|---|---|---|---|---|---|---|
| Quadrant | DetID | PixID | Counts | Sigma | Mean | Median | Sigma |
| A | 6 | 16 | 70360 | 433.84 | 794 | 777 | 160.4 |
| A | 4 | 2 | 42750 | 261.69 | 794 | 777 | 160.4 |
| A | 12 | 96 | 42688 | 261.31 | 794 | 777 | 160.4 |
| B | 12 | 111 | 17777 | 112.74 | 802 | 781 | 150.8 |
| B | 11 | 111 | 15307 | 96.35 | 802 | 781 | 150.8 |
| B | 14 | 111 | 13236 | 82.62 | 802 | 781 | 150.8 |
| C | 14 | 238 | 123424 | 676.36 | 779 | 785 | 181.3 |
| C | 1 | 16 | 67632 | 368.67 | 779 | 785 | 181.3 |
| C | 7 | 247 | 38332 | 207.07 | 779 | 785 | 181.3 |
| D | 7 | 238 | 3328069 | 18346.47 | 758 | 736 | 181.4 |
| D | 1 | 52 | 681754 | 3755.04 | 758 | 736 | 181.4 |
| D | 12 | 233 | 155307 | 852.28 | 758 | 736 | 181.4 |
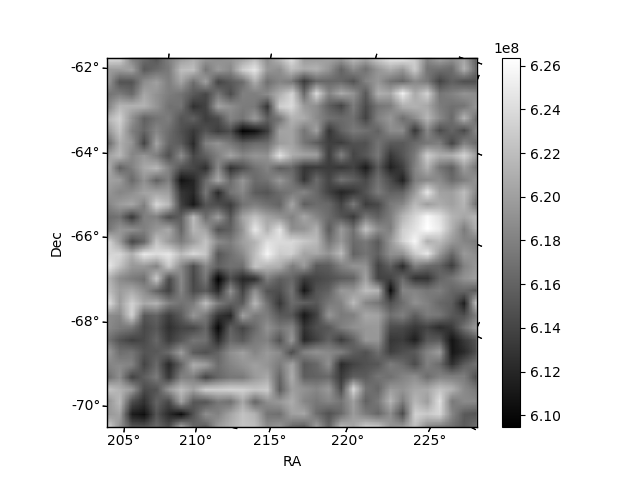
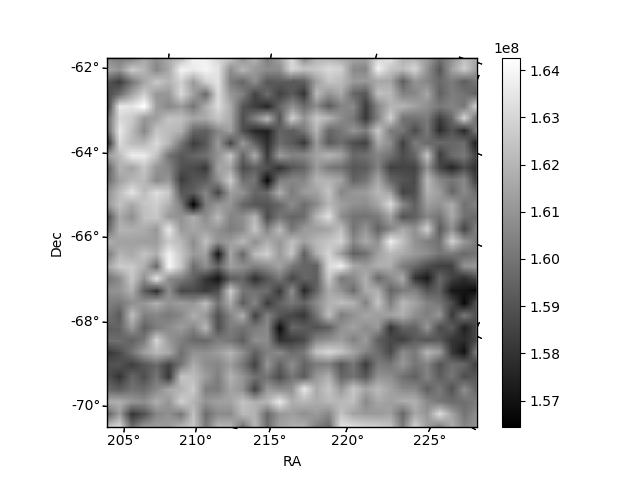
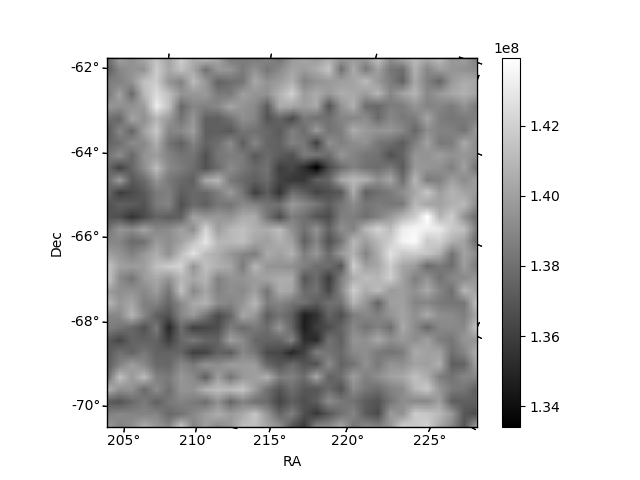
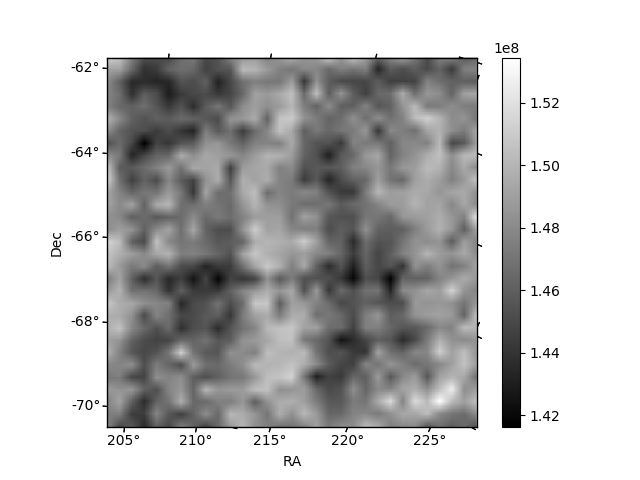
Histogram calculated using DETX and DETY for each event in the final _common_clean file
| Quadrant A |  |
 |
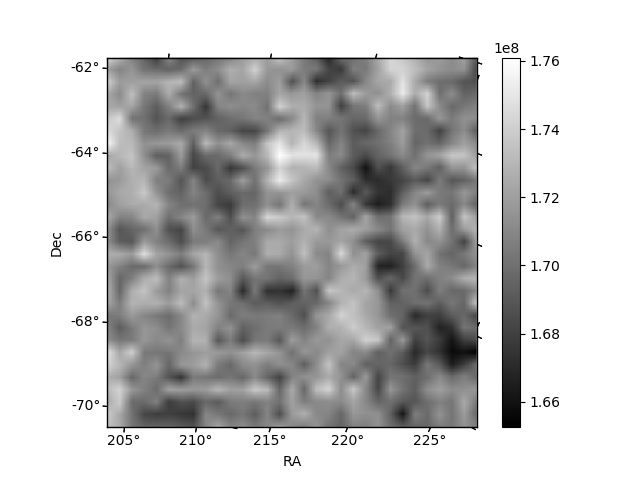
Quadrant B |
|---|---|---|---|
| Quadrant D |  |
 |
Quadrant C |
| Plot type | Count rate plots | Images |
|---|---|---|
| Comparison with Poisson distribution Blue bars denote a histogram of data divided into 1 sec bins. Red curve is a Poisson curve with rate = median count rate of data. |
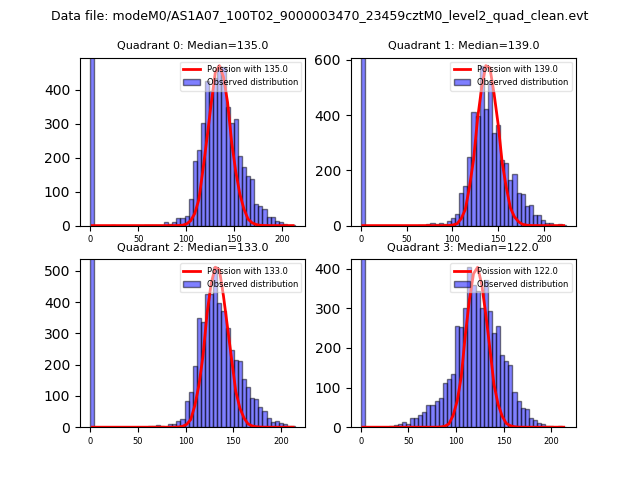 |
 |
| Quadrant-wise count rates Data is divided into 100 sec bins |
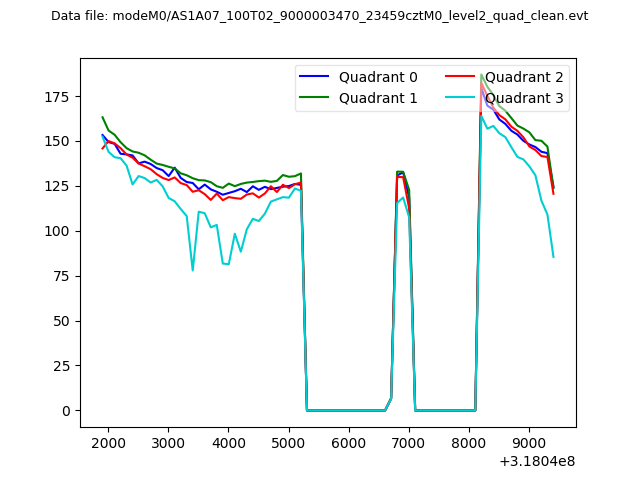 |
|
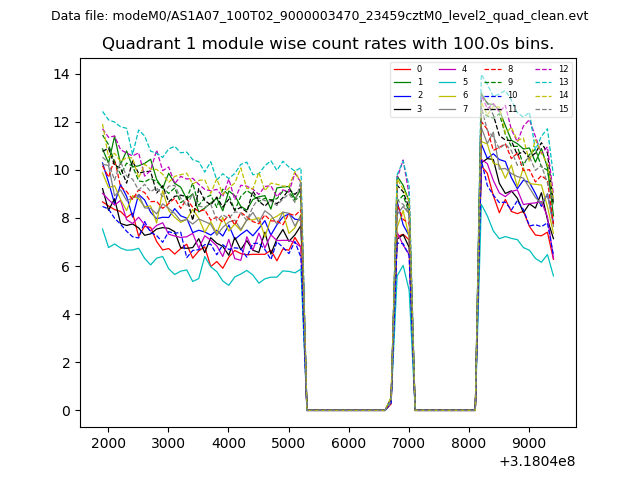
| Module-wise count rates for Quadrant A Data is divided into 100 sec bins |
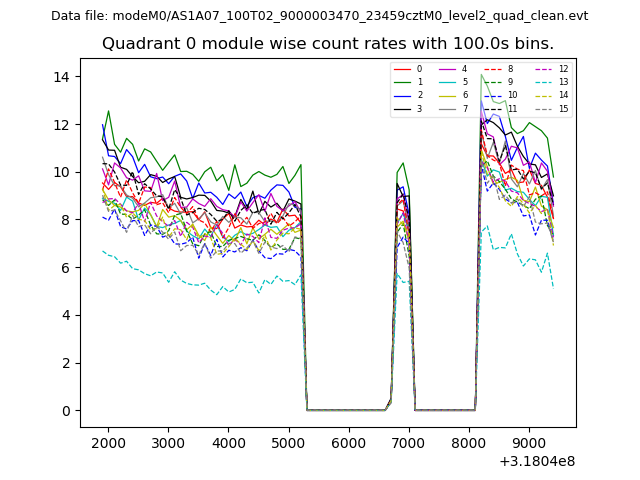 |
 |
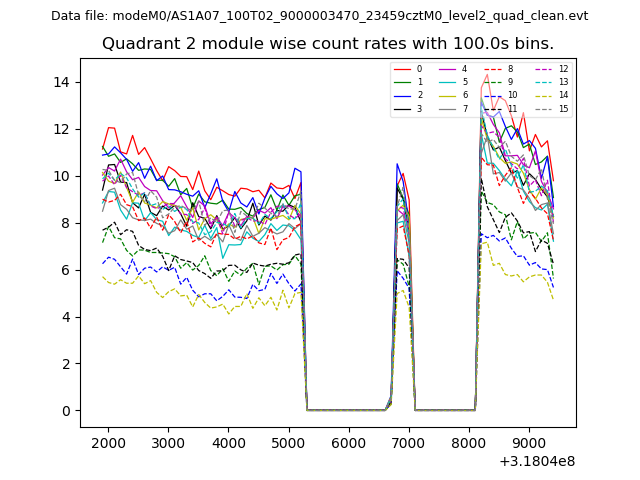
| Module-wise count rates for Quadrant B Data is divided into 100 sec bins |
 |
 |
| Module-wise count rates for Quadrant C Data is divided into 100 sec bins |
 |
 |
| Module-wise count rates for Quadrant D Data is divided into 100 sec bins |
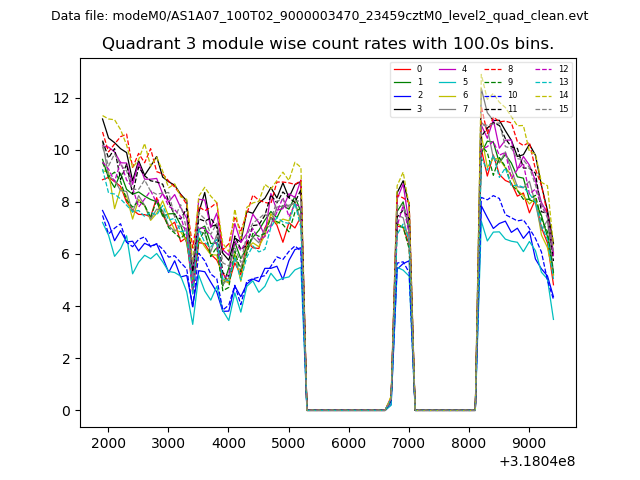 |
 |
| Parameter | Plot |
|---|---|
| CZT HV Monitor | 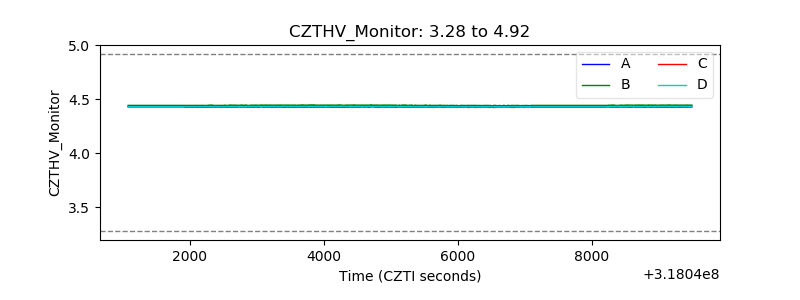 |
| D_VDD | 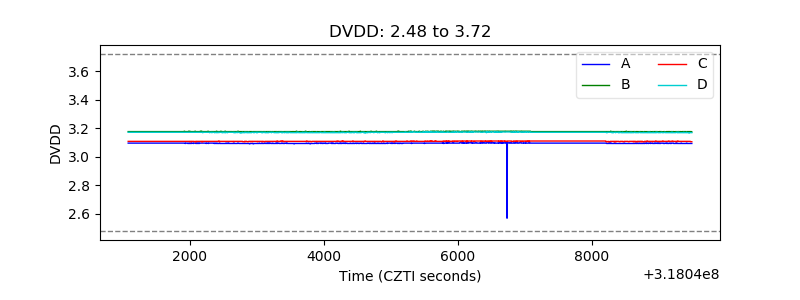 |
| Temperature 1 | 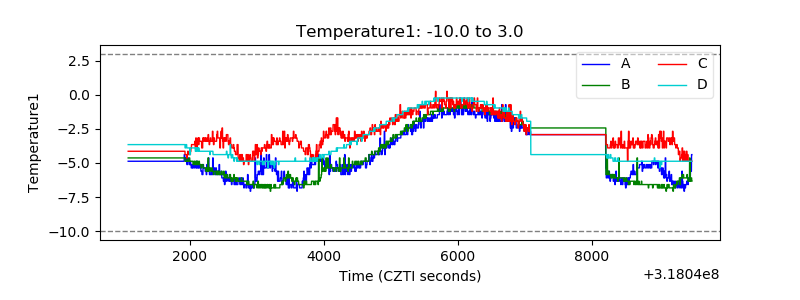 |
| Veto HV Monitor | 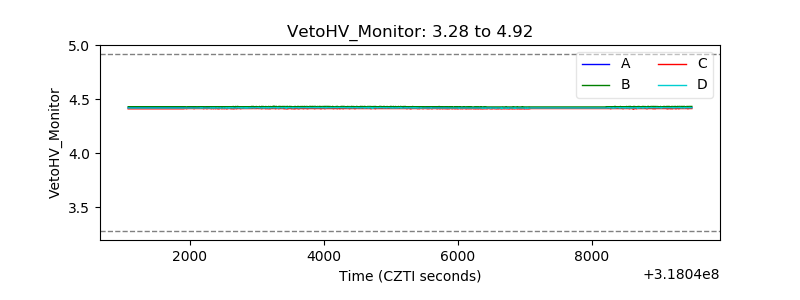 |
| Veto LLD |  |
| Alpha Counter | 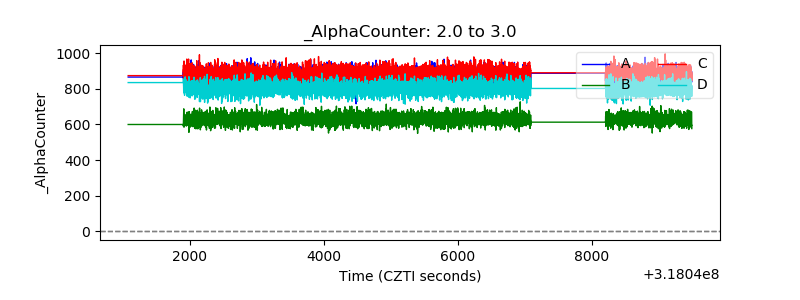 |
| _CPM_Rate |  |
| CZT Counter | 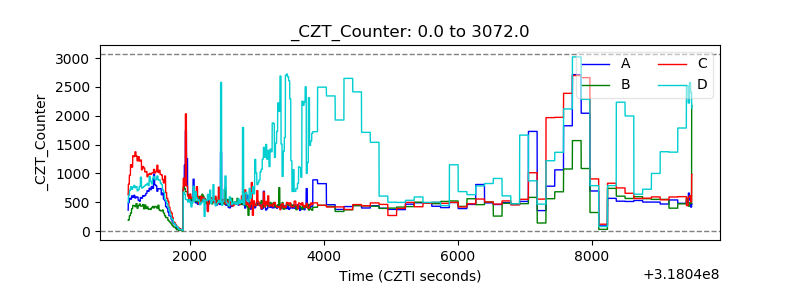 |
| +2.5 Volts monitor |  |
| +5 Volts monitor |  |
| _ROLL_ROT | 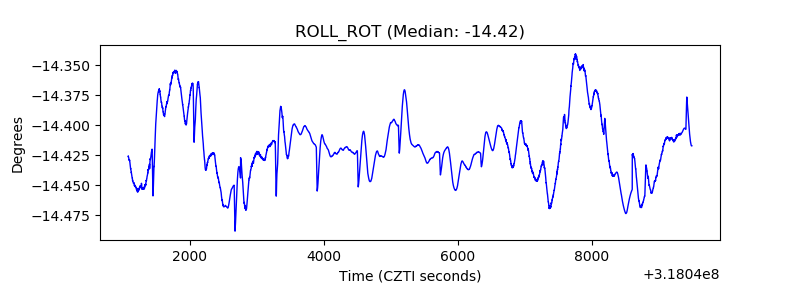 |
| _Roll_DEC | 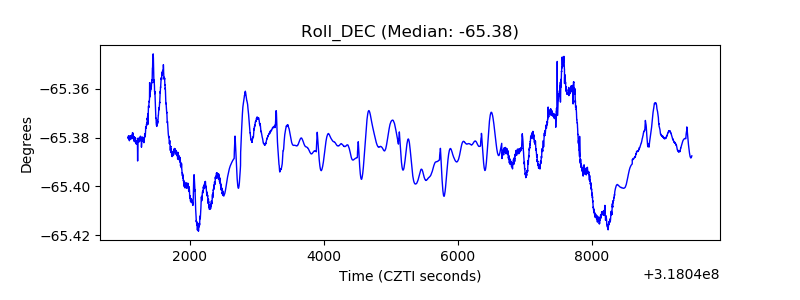 |
| _Roll_RA | 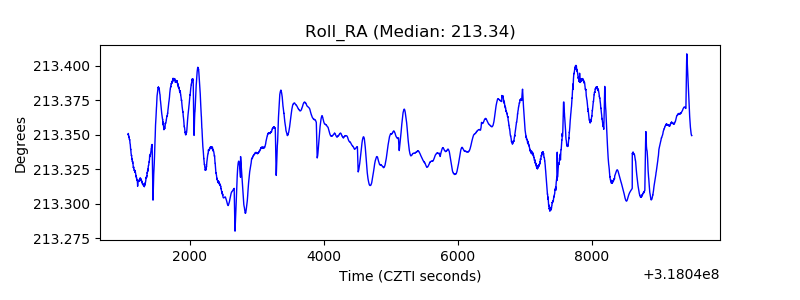 |
| Veto Counter | 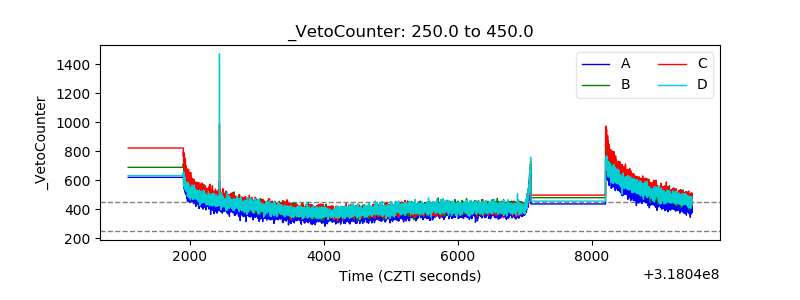 |