| Param | Original file | Final file |
|---|---|---|
| Filename | modeM0/AS1A07_100T02_9000003470_23461cztM0_level2.evt | modeM0/AS1A07_100T02_9000003470_23461cztM0_level2_quad_clean.evt |
| Size (bytes) | 626,898,240 | 108,478,080 |
| Size | 597.9 MB | 103.5 MB |
| Events in quadrant A | 3,211,098 | 739,692 |
| Events in quadrant B | 3,328,343 | 768,575 |
| Events in quadrant C | 3,528,521 | 737,749 |
| Events in quadrant D | 8,481,607 | 589,415 |
| Mode M0 | |||
|---|---|---|---|
| Quadrant | BADHDUFLAG | Total packets | Discarded packets |
| A | 0 | 13539 | 2 |
| B | 0 | 13936 | 2 |
| C | 0 | 14453 | 2 |
| D | 0 | 29536 | 2 |
| Mode M9 | |||
|---|---|---|---|
| Quadrant | BADHDUFLAG | Total packets | Discarded packets |
| A | 0 | 19 | 0 |
| B | 0 | 20 | 0 |
| C | 0 | 20 | 0 |
| D | 0 | 20 | 0 |
| Mode SS | |||
|---|---|---|---|
| Quadrant | BADHDUFLAG | Total packets | Discarded packets |
| A | 0 | 130 | 0 |
| B | 0 | 130 | 0 |
| C | 0 | 130 | 0 |
| D | 0 | 130 | 0 |
| Quadrant | Total seconds | Saturated seconds | Saturation percentage |
|---|---|---|---|
| A | 6442 | 23 | 0.357032% |
| B | 6441 | 45 | 0.698649% |
| C | 6441 | 92 | 1.428350% |
| D | 6441 | 1871 | 29.048284% |
Noise dominated data is calculated using 1-second bins in cleaned event files. If a bin has >2000 counts, and if more than 50% of those come from <1% of pixels, then it is considered to be noise-dominated and hence unusable.
| Quadrant | # 1 sec bins | Bins with >0 counts | Bins with >2000 counts | High rate bins dominated by noise | Noise dominated (total time) | Noise dominated (detector-on time) | Marked lightcurve |
|---|---|---|---|---|---|---|---|
| A | 7672 | 6443 | 6 | 6 | 0.08% | 0.09% | 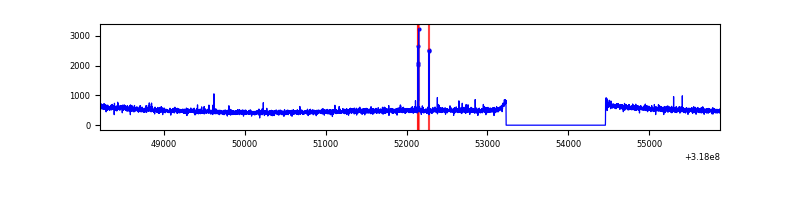 |
| B | 7671 | 6442 | 8 | 8 | 0.10% | 0.12% | 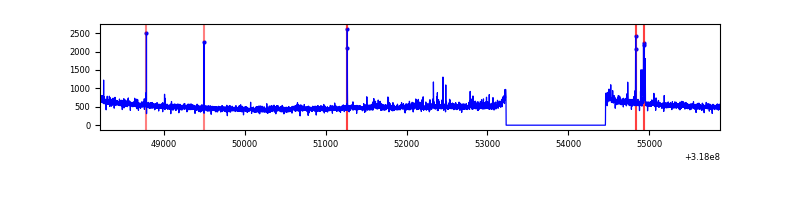 |
| C | 7671 | 6441 | 21 | 21 | 0.27% | 0.33% | 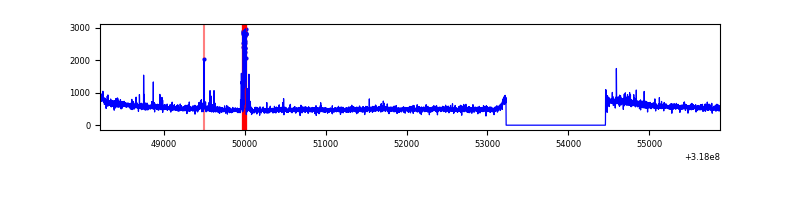 |
| D | 7671 | 6442 | 1875 | 1875 | 24.44% | 29.11% | 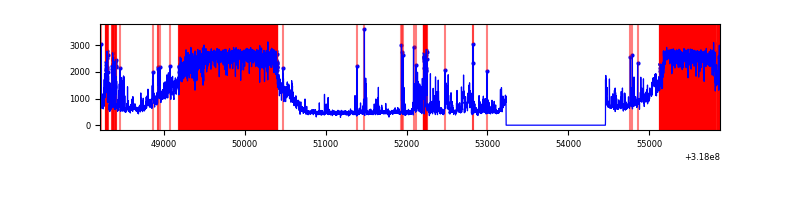 |
Top three noisy pixels from each quadrant. If the there are fewer than three noisy pixels in the level2.evt file, extra rows are filled as -1
| Pixel properties | Quadrant properties | ||||||
|---|---|---|---|---|---|---|---|
| Quadrant | DetID | PixID | Counts | Sigma | Mean | Median | Sigma |
| A | 12 | 96 | 28282 | 166.82 | 824 | 807 | 164.7 |
| A | 13 | 254 | 10830 | 60.86 | 824 | 807 | 164.7 |
| A | 10 | 253 | 8076 | 44.14 | 824 | 807 | 164.7 |
| B | 0 | 183 | 44275 | 282.42 | 829 | 811 | 153.9 |
| B | 0 | 228 | 26269 | 165.42 | 829 | 811 | 153.9 |
| B | 12 | 111 | 17605 | 109.12 | 829 | 811 | 153.9 |
| C | 14 | 238 | 129947 | 683.9 | 817 | 822 | 188.8 |
| C | 1 | 0 | 89692 | 470.69 | 817 | 822 | 188.8 |
| C | 7 | 247 | 50784 | 264.62 | 817 | 822 | 188.8 |
| D | 7 | 238 | 4831083 | 27377.2 | 738 | 718 | 176.4 |
| D | 1 | 52 | 756056 | 4281.05 | 738 | 718 | 176.4 |
| D | 12 | 233 | 44166 | 246.25 | 738 | 718 | 176.4 |
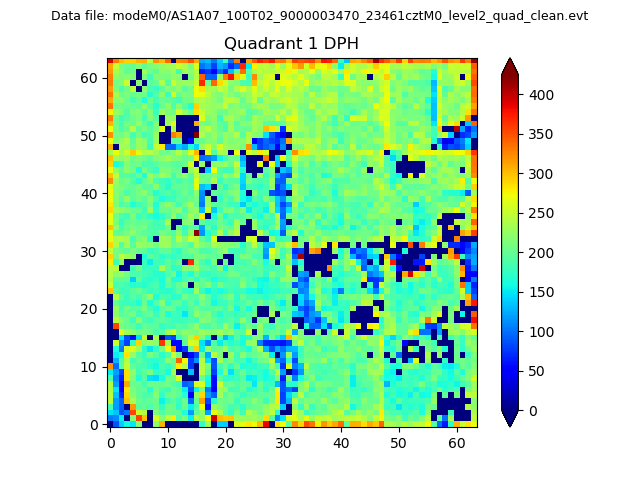
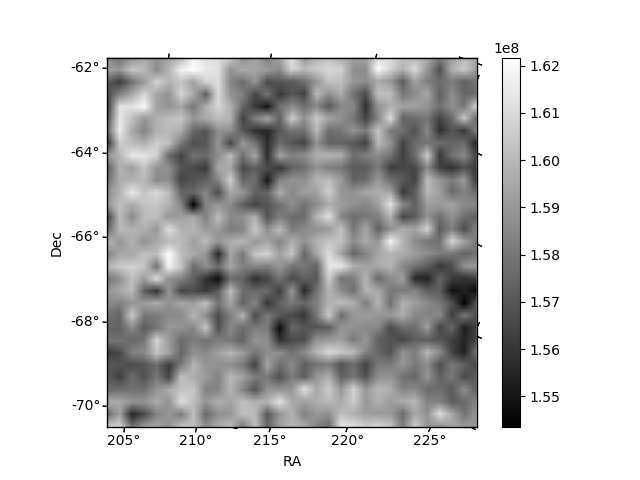
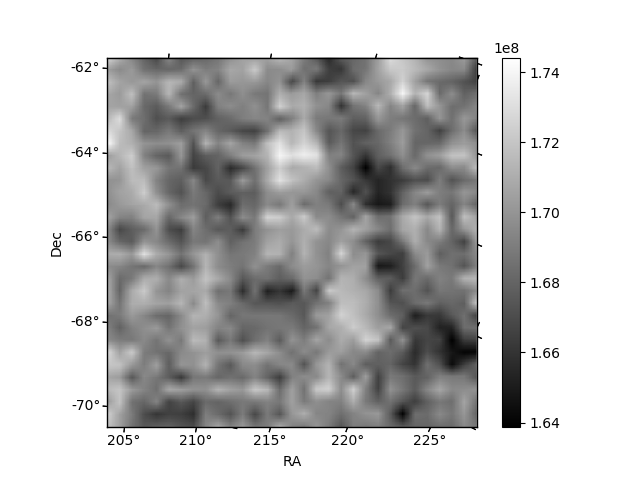
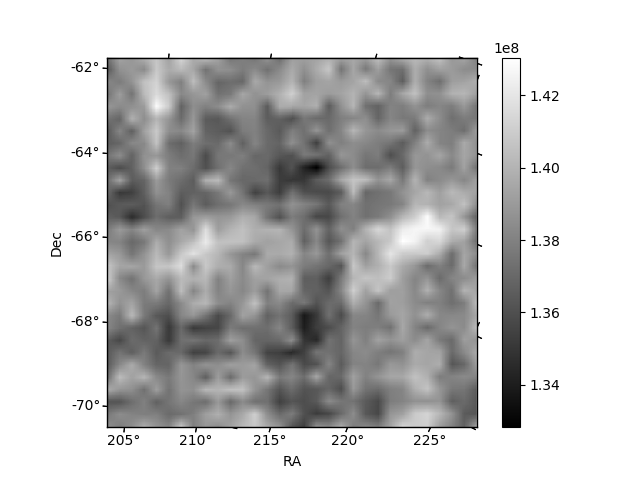
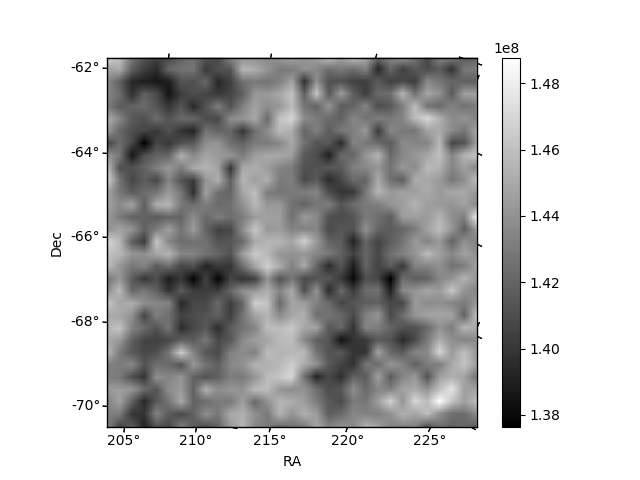
Histogram calculated using DETX and DETY for each event in the final _common_clean file
| Quadrant A |  |
 |
Quadrant B |
|---|---|---|---|
| Quadrant D | 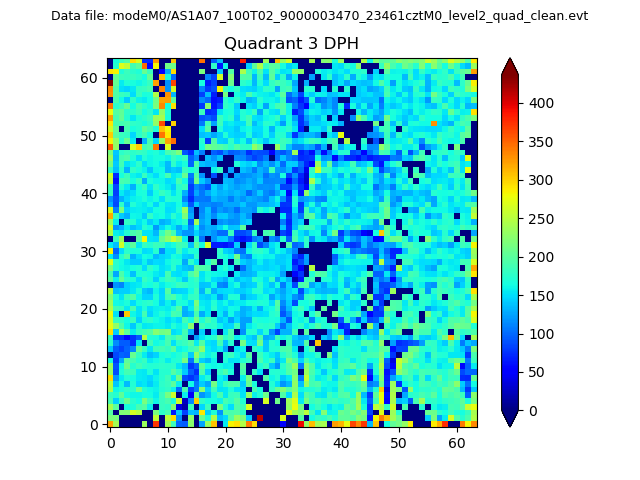 |
 |
Quadrant C |
| Plot type | Count rate plots | Images |
|---|---|---|
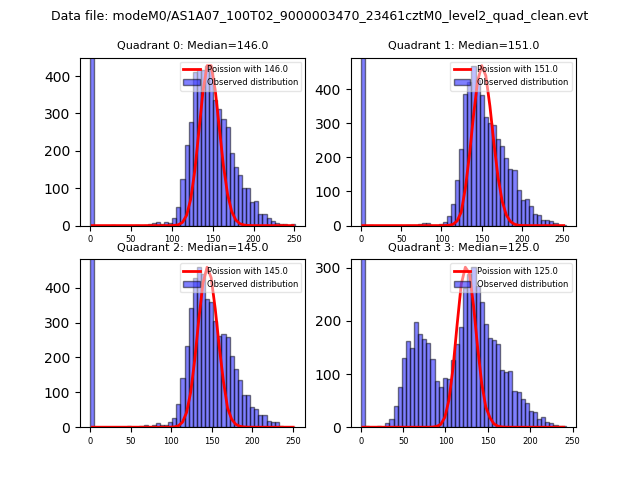
| Comparison with Poisson distribution Blue bars denote a histogram of data divided into 1 sec bins. Red curve is a Poisson curve with rate = median count rate of data. |
 |
 |
| Quadrant-wise count rates Data is divided into 100 sec bins |
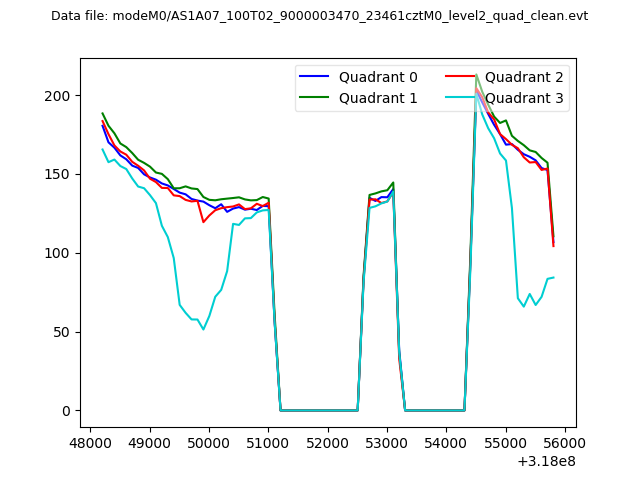 |
|
| Module-wise count rates for Quadrant A Data is divided into 100 sec bins |
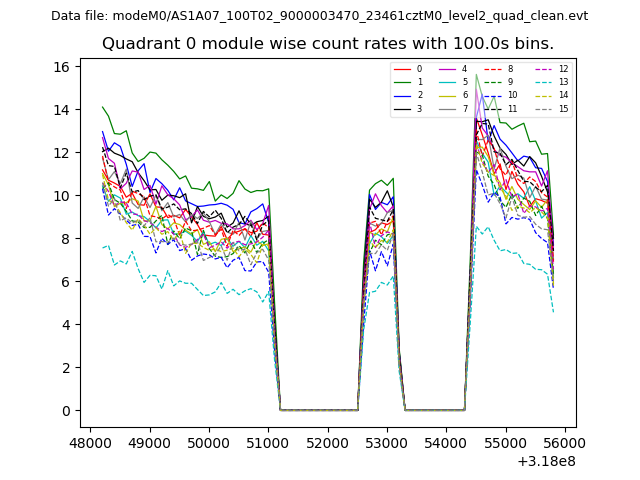 |
 |
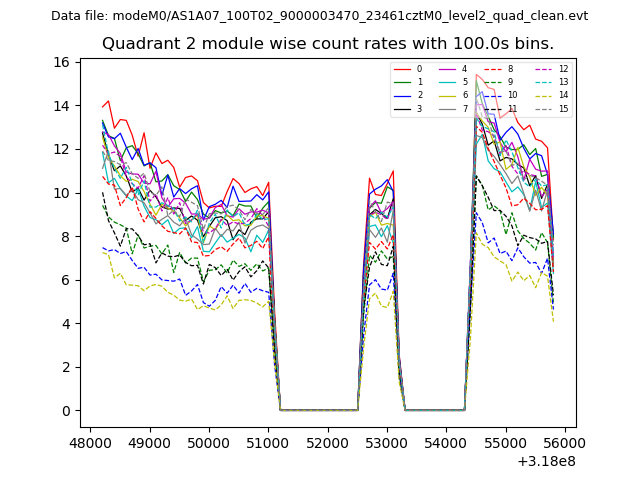
| Module-wise count rates for Quadrant B Data is divided into 100 sec bins |
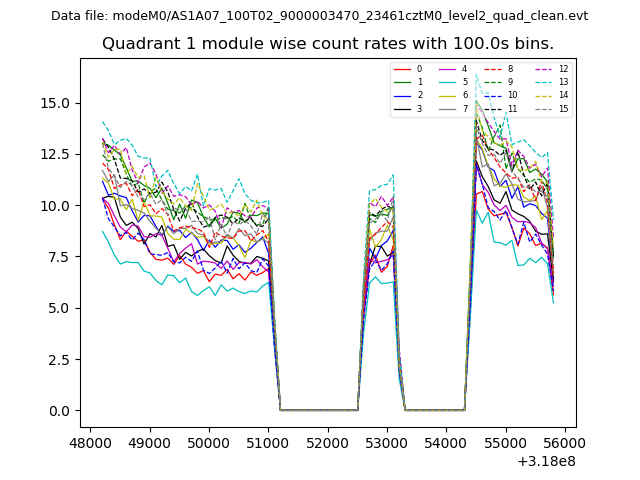 |
 |
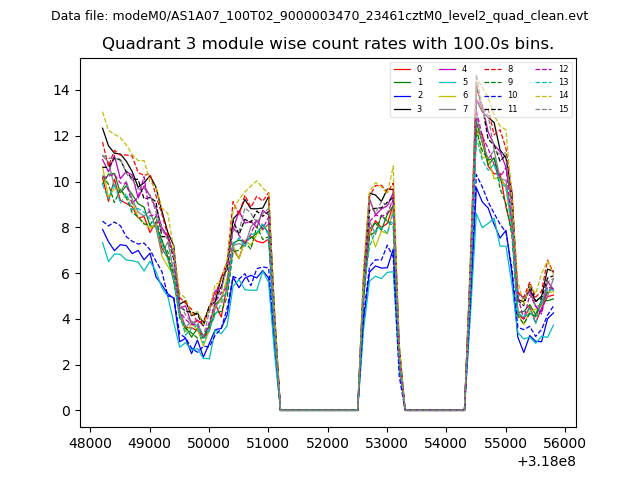
| Module-wise count rates for Quadrant C Data is divided into 100 sec bins |
 |
 |
| Module-wise count rates for Quadrant D Data is divided into 100 sec bins |
 |
 |
| Parameter | Plot |
|---|---|
| CZT HV Monitor | 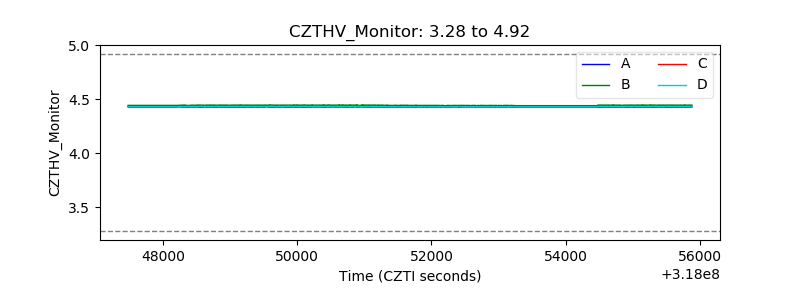 |
| D_VDD | 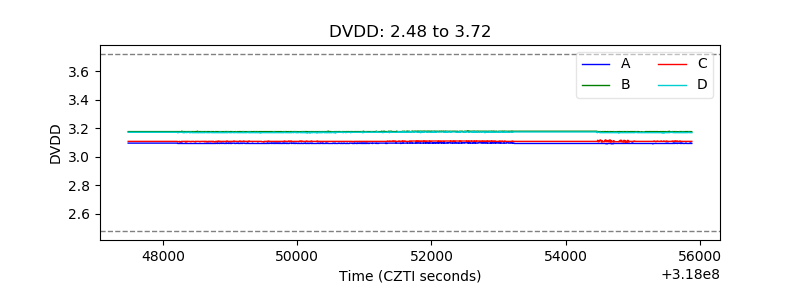 |
| Temperature 1 | 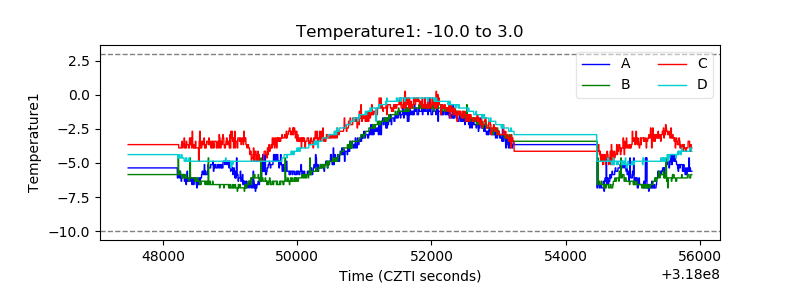 |
| Veto HV Monitor | 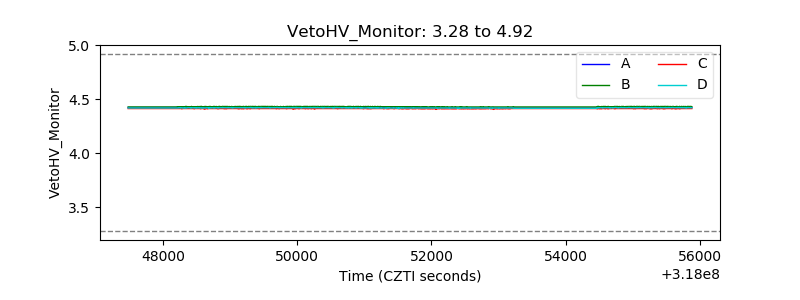 |
| Veto LLD | 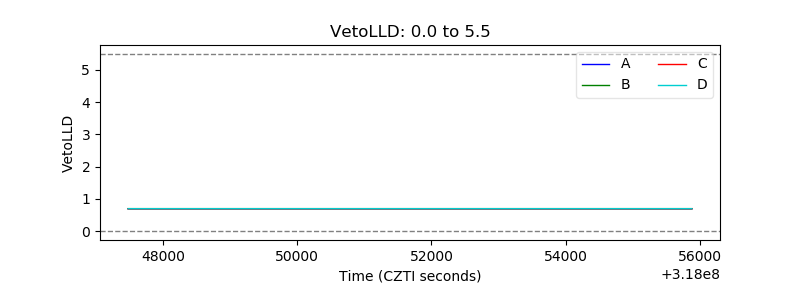 |
| Alpha Counter | 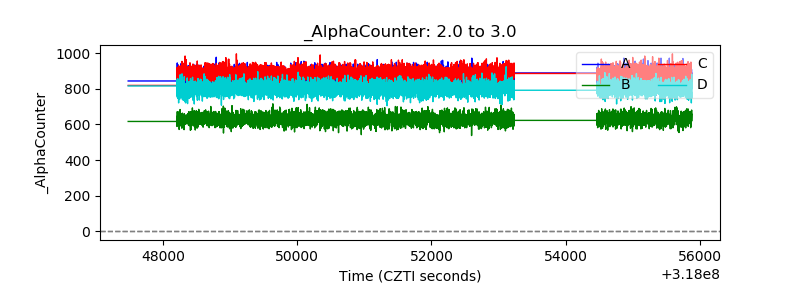 |
| _CPM_Rate | 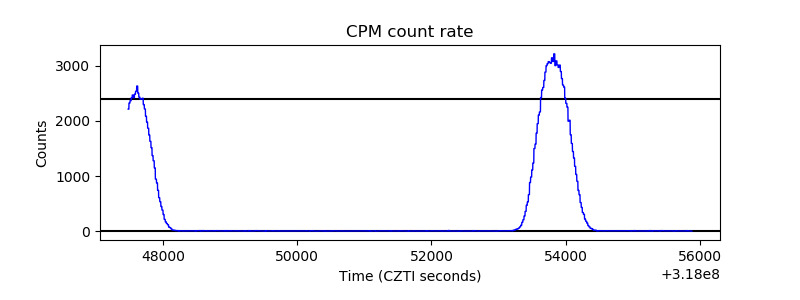 |
| CZT Counter | 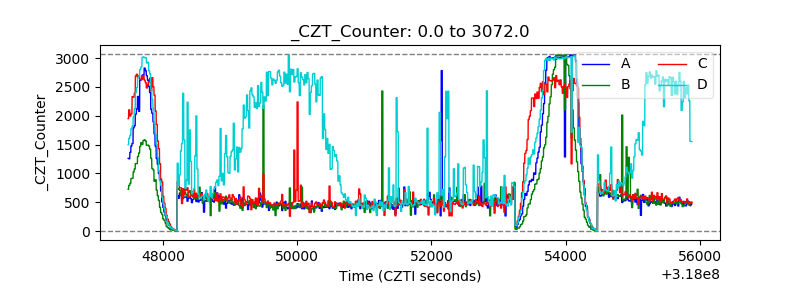 |
| +2.5 Volts monitor |  |
| +5 Volts monitor |  |
| _ROLL_ROT | 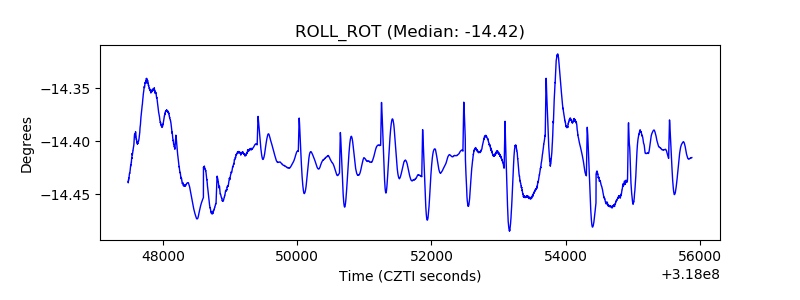 |
| _Roll_DEC | 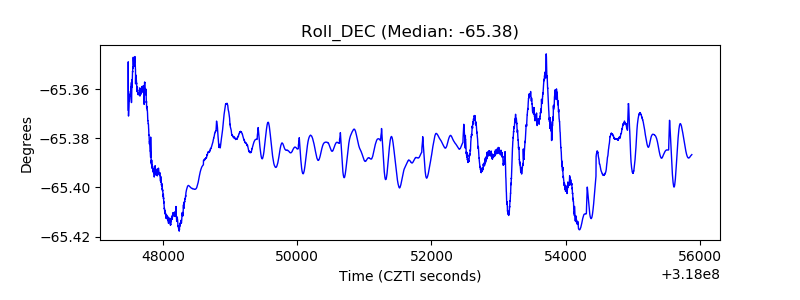 |
| _Roll_RA | 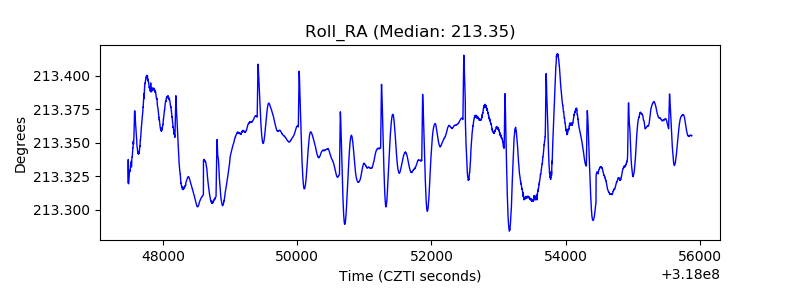 |
| Veto Counter | 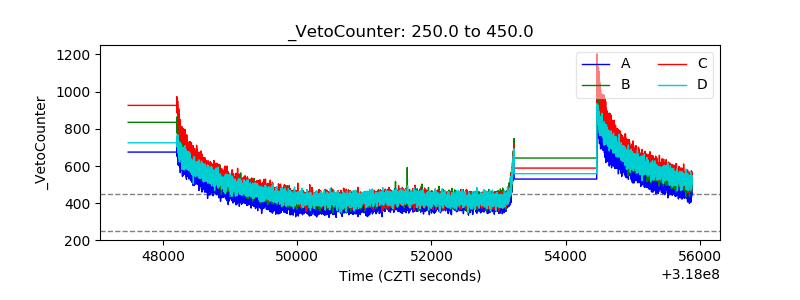 |