| Param | Original file | Final file |
|---|---|---|
| Filename | modeM0/AS1A07_100T02_9000003470_23462cztM0_level2.evt | modeM0/AS1A07_100T02_9000003470_23462cztM0_level2_quad_clean.evt |
| Size (bytes) | 619,531,200 | 101,188,800 |
| Size | 590.8 MB | 96.5 MB |
| Events in quadrant A | 3,034,645 | 705,717 |
| Events in quadrant B | 3,207,803 | 727,776 |
| Events in quadrant C | 3,183,594 | 703,190 |
| Events in quadrant D | 8,936,213 | 513,869 |
| Mode M0 | |||
|---|---|---|---|
| Quadrant | BADHDUFLAG | Total packets | Discarded packets |
| A | 0 | 12510 | 1 |
| B | 0 | 13073 | 1 |
| C | 0 | 13062 | 1 |
| D | 0 | 30623 | 1 |
| Mode M9 | |||
|---|---|---|---|
| Quadrant | BADHDUFLAG | Total packets | Discarded packets |
| A | 0 | 13 | 0 |
| B | 0 | 13 | 0 |
| C | 0 | 13 | 0 |
| D | 0 | 13 | 0 |
| Mode SS | |||
|---|---|---|---|
| Quadrant | BADHDUFLAG | Total packets | Discarded packets |
| A | 0 | 122 | 0 |
| B | 0 | 122 | 0 |
| C | 0 | 122 | 0 |
| D | 0 | 122 | 0 |
| Quadrant | Total seconds | Saturated seconds | Saturation percentage |
|---|---|---|---|
| A | 5906 | 13 | 0.220115% |
| B | 5906 | 49 | 0.829665% |
| C | 5906 | 73 | 1.236031% |
| D | 5906 | 2110 | 35.726380% |
Noise dominated data is calculated using 1-second bins in cleaned event files. If a bin has >2000 counts, and if more than 50% of those come from <1% of pixels, then it is considered to be noise-dominated and hence unusable.
| Quadrant | # 1 sec bins | Bins with >0 counts | Bins with >2000 counts | High rate bins dominated by noise | Noise dominated (total time) | Noise dominated (detector-on time) | Marked lightcurve |
|---|---|---|---|---|---|---|---|
| A | 7221 | 5907 | 0 | 0 | 0.00% | 0.00% | 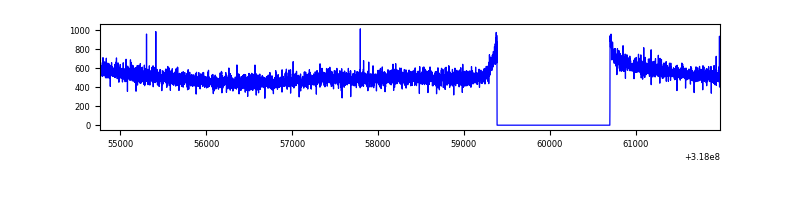 |
| B | 7221 | 5907 | 14 | 14 | 0.19% | 0.24% |  |
| C | 7221 | 5906 | 0 | 0 | 0.00% | 0.00% | 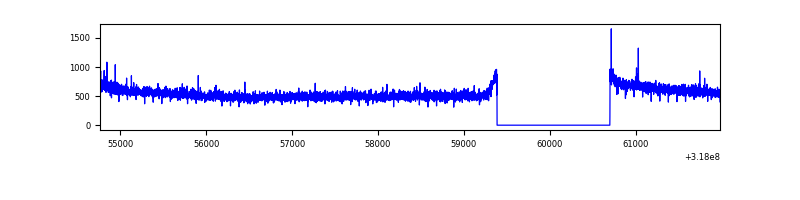 |
| D | 7221 | 5907 | 2056 | 2056 | 28.47% | 34.81% |  |
Top three noisy pixels from each quadrant. If the there are fewer than three noisy pixels in the level2.evt file, extra rows are filled as -1
| Pixel properties | Quadrant properties | ||||||
|---|---|---|---|---|---|---|---|
| Quadrant | DetID | PixID | Counts | Sigma | Mean | Median | Sigma |
| A | 3 | 1 | 10209 | 60.54 | 784 | 772 | 155.9 |
| A | 13 | 254 | 9843 | 58.2 | 784 | 772 | 155.9 |
| A | 0 | 226 | 6756 | 38.39 | 784 | 772 | 155.9 |
| B | 0 | 183 | 36855 | 249.59 | 784 | 767 | 144.6 |
| B | 12 | 17 | 34436 | 232.86 | 784 | 767 | 144.6 |
| B | 0 | 229 | 31617 | 213.36 | 784 | 767 | 144.6 |
| C | 14 | 238 | 124492 | 689.16 | 779 | 785 | 179.5 |
| C | 7 | 247 | 8481 | 42.87 | 779 | 785 | 179.5 |
| C | 3 | 233 | 5501 | 26.27 | 779 | 785 | 179.5 |
| D | 7 | 238 | 5456233 | 34228.63 | 660 | 643 | 159.4 |
| D | 1 | 52 | 852683 | 5345.74 | 660 | 643 | 159.4 |
| D | 13 | 104 | 46860 | 289.97 | 660 | 643 | 159.4 |
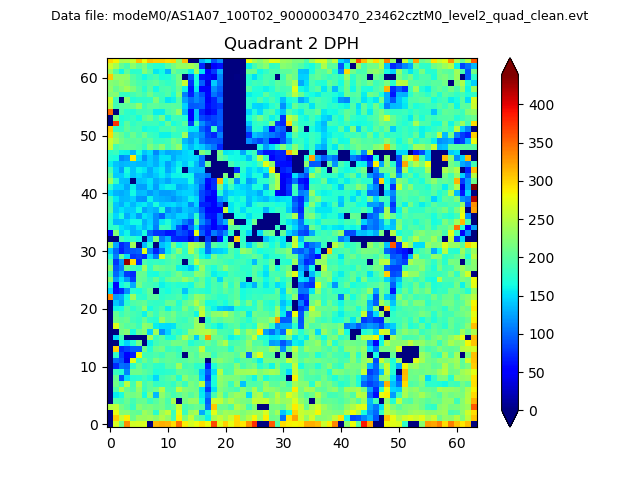
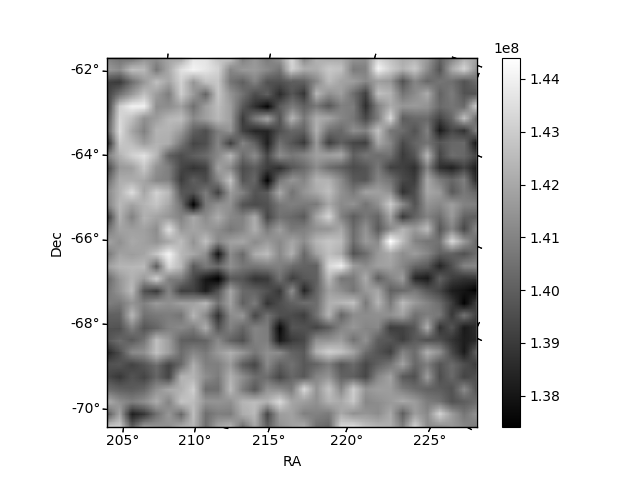
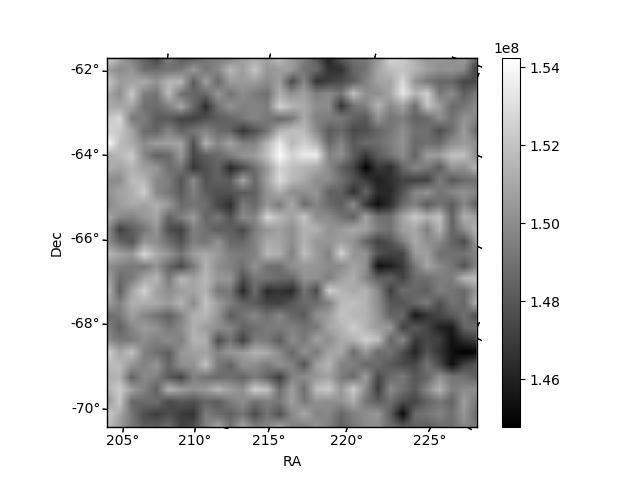
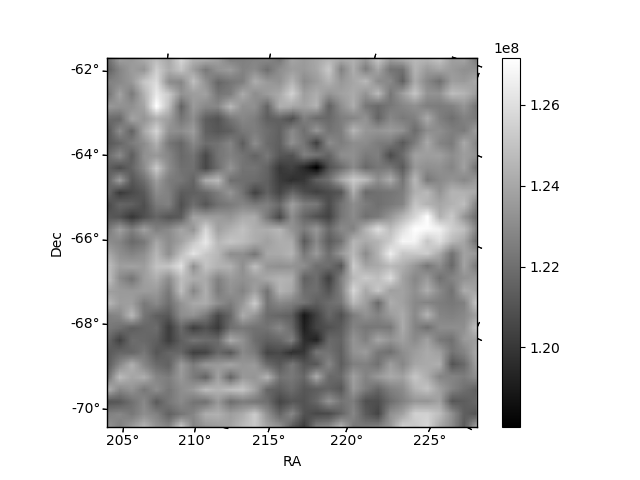
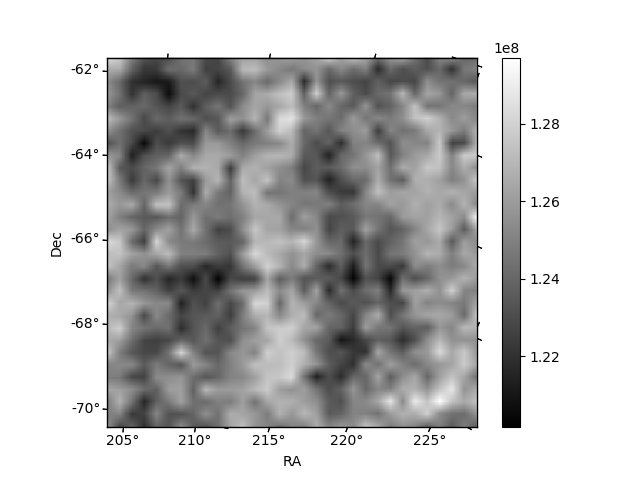
Histogram calculated using DETX and DETY for each event in the final _common_clean file
| Quadrant A | 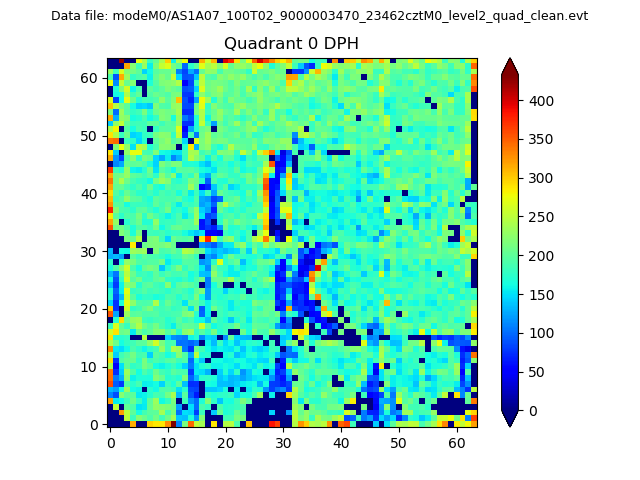 |
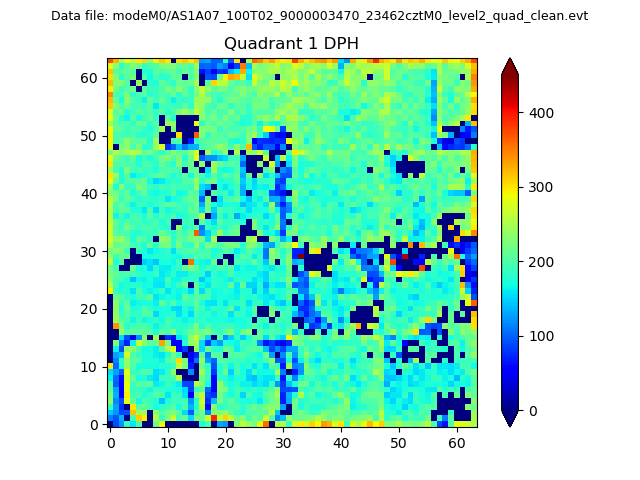 |
Quadrant B |
|---|---|---|---|
| Quadrant D | 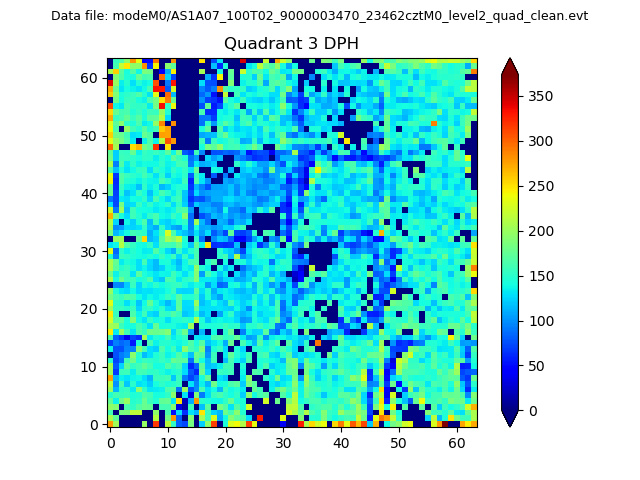 |
 |
Quadrant C |
| Plot type | Count rate plots | Images |
|---|---|---|
| Comparison with Poisson distribution Blue bars denote a histogram of data divided into 1 sec bins. Red curve is a Poisson curve with rate = median count rate of data. |
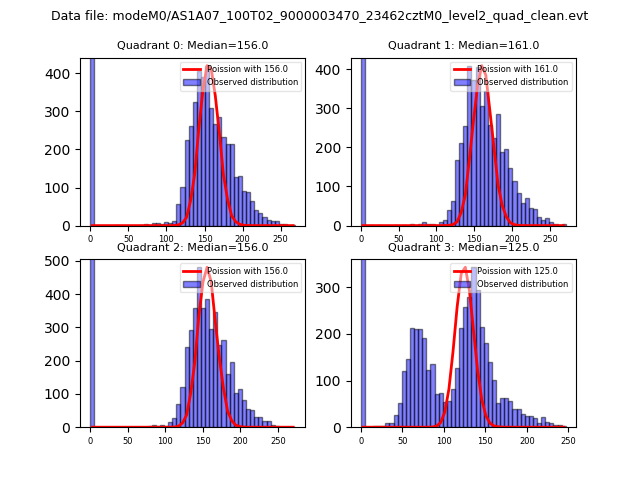 |
 |
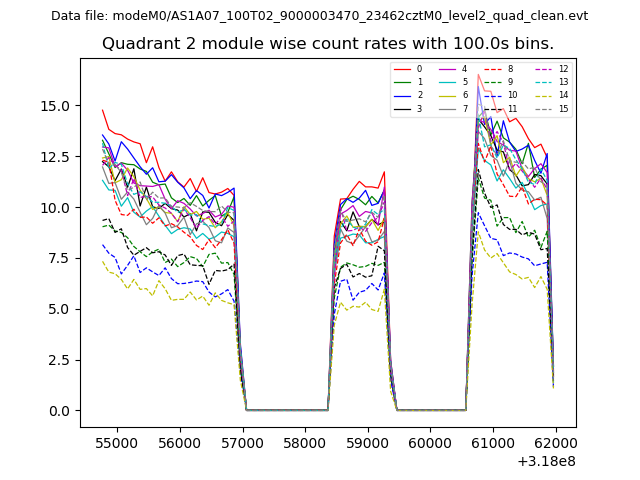
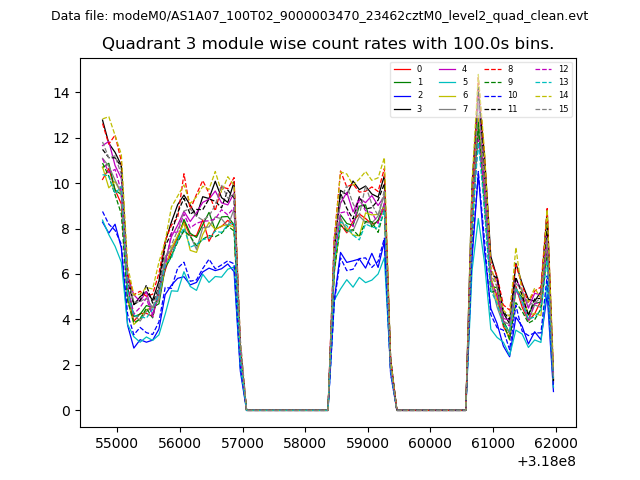
| Quadrant-wise count rates Data is divided into 100 sec bins |
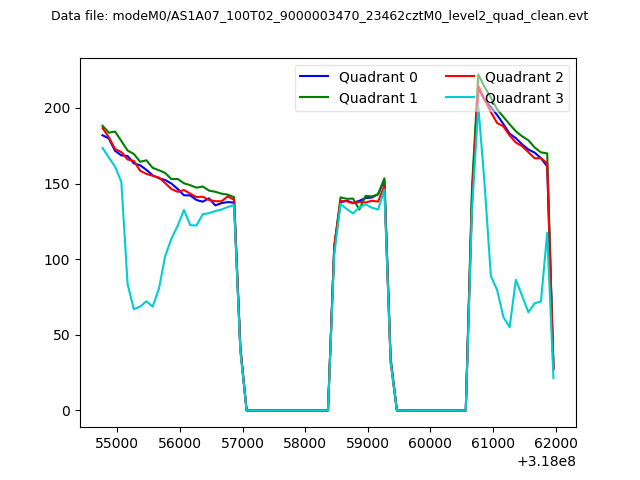 |
|
| Module-wise count rates for Quadrant A Data is divided into 100 sec bins |
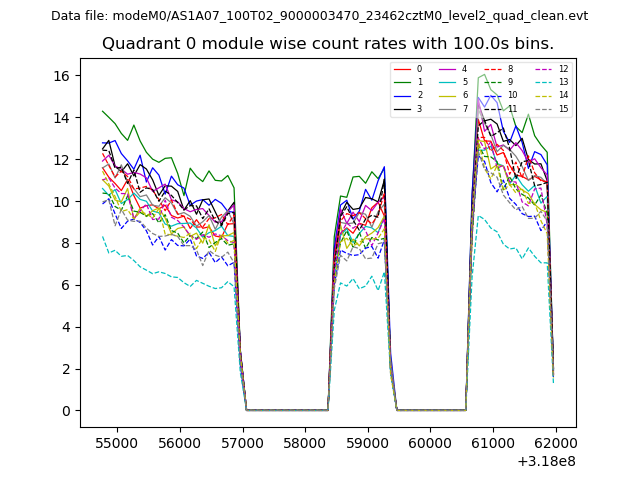 |
 |
| Module-wise count rates for Quadrant B Data is divided into 100 sec bins |
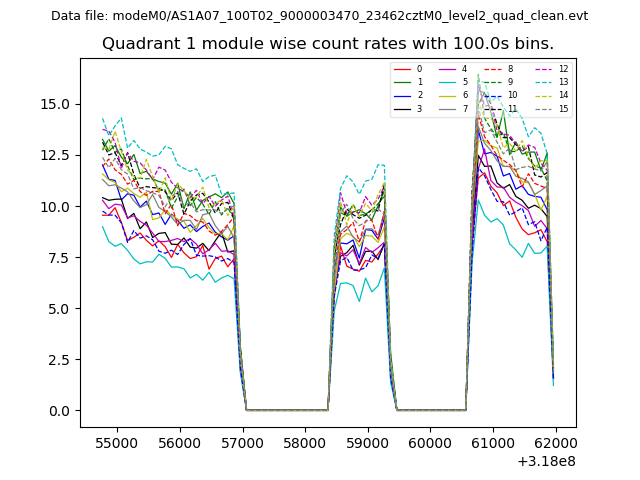 |
 |
| Module-wise count rates for Quadrant C Data is divided into 100 sec bins |
 |
 |
| Module-wise count rates for Quadrant D Data is divided into 100 sec bins |
 |
 |
| Parameter | Plot |
|---|---|
| CZT HV Monitor | 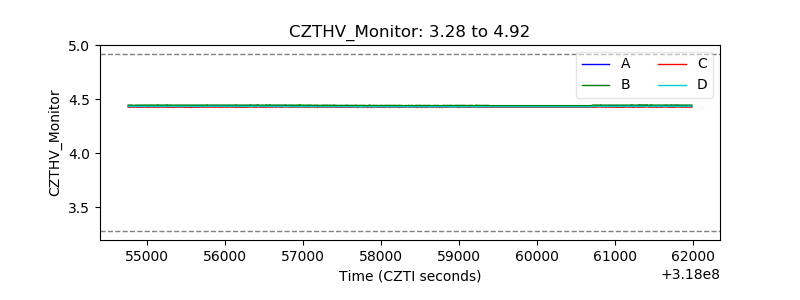 |
| D_VDD |  |
| Temperature 1 | 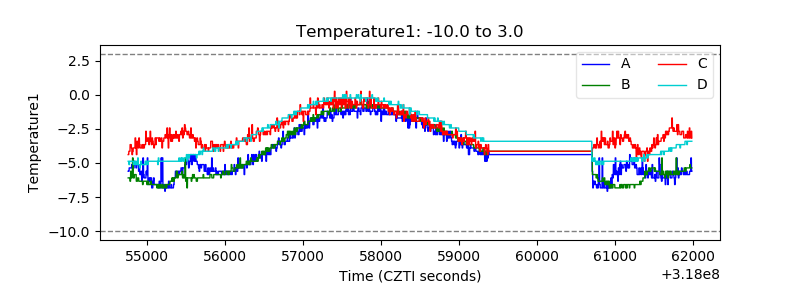 |
| Veto HV Monitor | 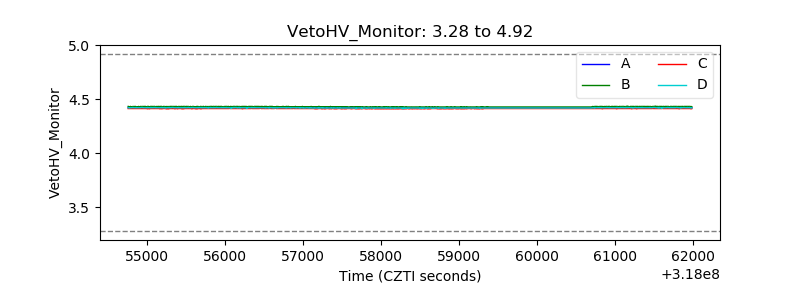 |
| Veto LLD | 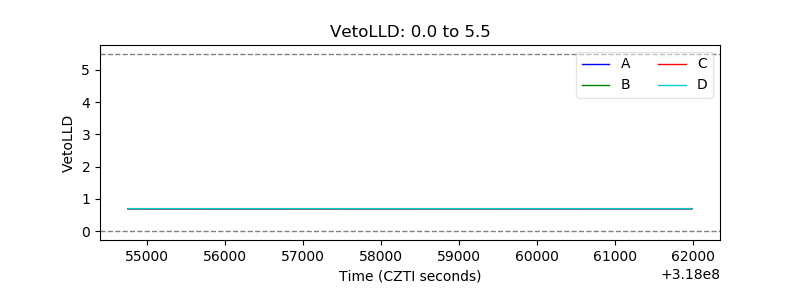 |
| Alpha Counter | 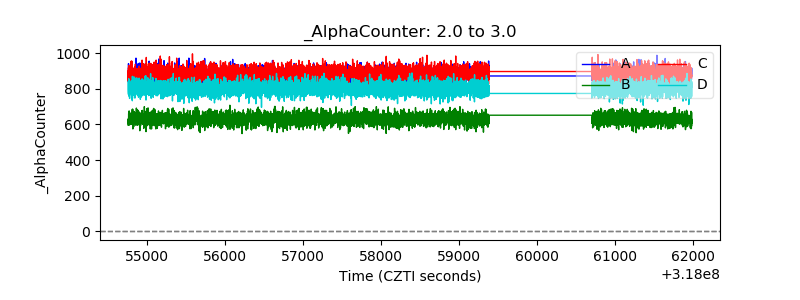 |
| _CPM_Rate | 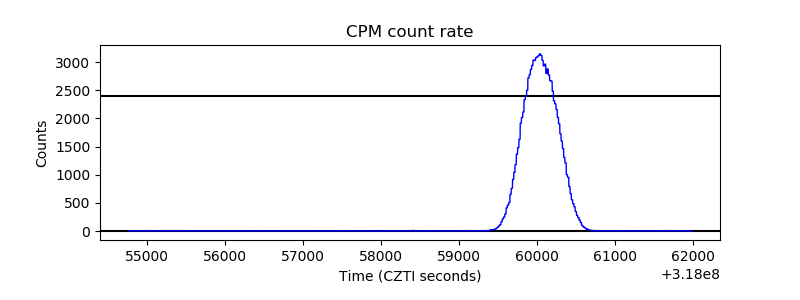 |
| CZT Counter | 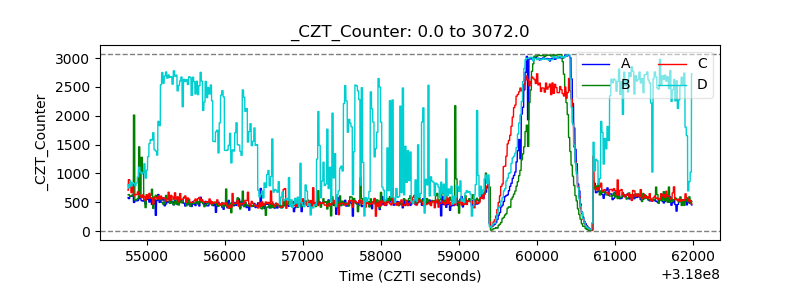 |
| +2.5 Volts monitor | 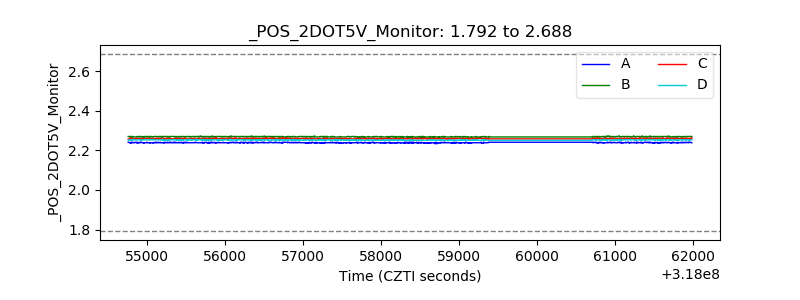 |
| +5 Volts monitor | 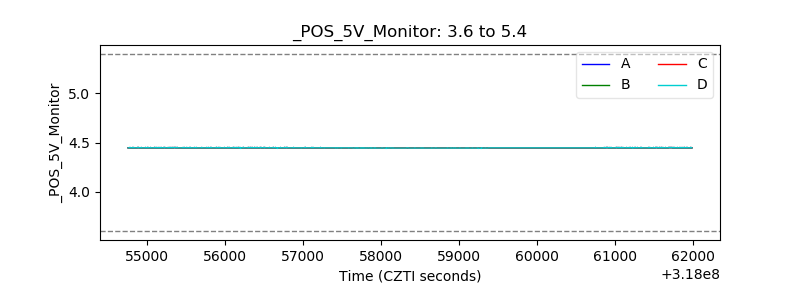 |
| _ROLL_ROT | 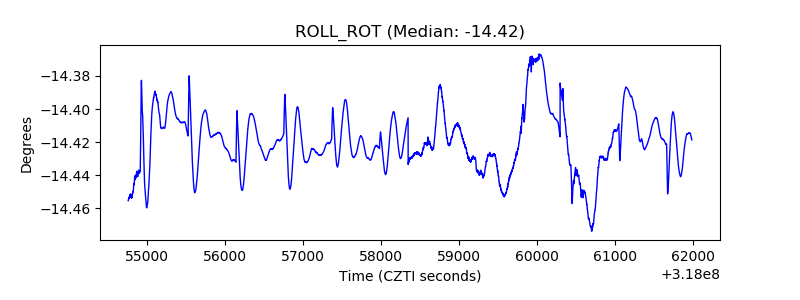 |
| _Roll_DEC | 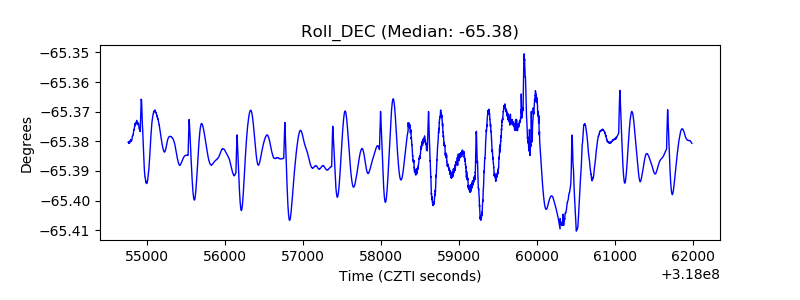 |
| _Roll_RA | 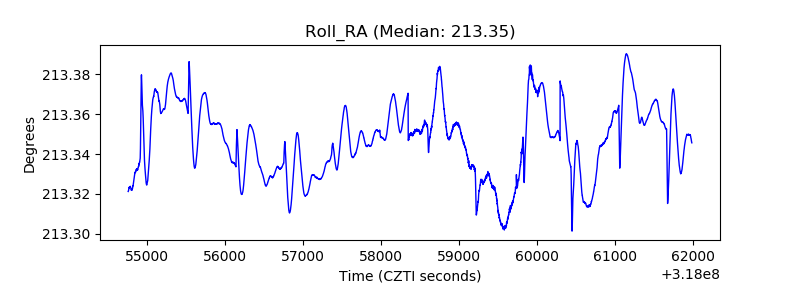 |
| Veto Counter | 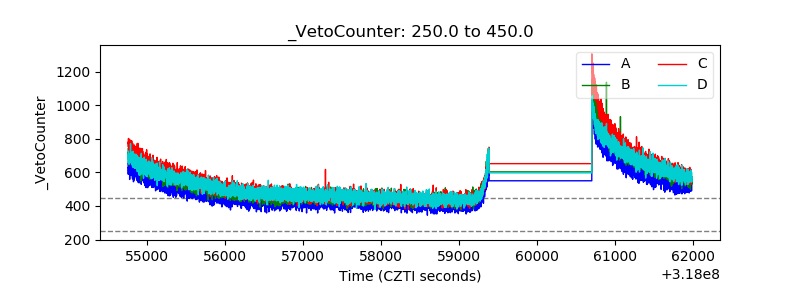 |