| Param | Original file | Final file |
|---|---|---|
| Filename | modeM0/AS1A07_100T02_9000003470_23463cztM0_level2.evt | modeM0/AS1A07_100T02_9000003470_23463cztM0_level2_quad_clean.evt |
| Size (bytes) | 555,192,000 | 96,937,920 |
| Size | 529.5 MB | 92.4 MB |
| Events in quadrant A | 2,982,241 | 678,979 |
| Events in quadrant B | 3,062,837 | 693,542 |
| Events in quadrant C | 3,047,337 | 665,818 |
| Events in quadrant D | 7,340,722 | 503,850 |
| Mode M0 | |||
|---|---|---|---|
| Quadrant | BADHDUFLAG | Total packets | Discarded packets |
| A | 0 | 12044 | 1 |
| B | 0 | 12370 | 1 |
| C | 0 | 12373 | 1 |
| D | 0 | 25522 | 1 |
| Mode M9 | |||
|---|---|---|---|
| Quadrant | BADHDUFLAG | Total packets | Discarded packets |
| A | 0 | 13 | 0 |
| B | 0 | 13 | 0 |
| C | 0 | 13 | 0 |
| D | 0 | 13 | 0 |
| Mode SS | |||
|---|---|---|---|
| Quadrant | BADHDUFLAG | Total packets | Discarded packets |
| A | 0 | 116 | 0 |
| B | 0 | 116 | 0 |
| C | 0 | 116 | 0 |
| D | 0 | 116 | 0 |
| Quadrant | Total seconds | Saturated seconds | Saturation percentage |
|---|---|---|---|
| A | 5611 | 45 | 0.801996% |
| B | 5610 | 60 | 1.069519% |
| C | 5611 | 97 | 1.728747% |
| D | 5611 | 1736 | 30.939227% |
Noise dominated data is calculated using 1-second bins in cleaned event files. If a bin has >2000 counts, and if more than 50% of those come from <1% of pixels, then it is considered to be noise-dominated and hence unusable.
| Quadrant | # 1 sec bins | Bins with >0 counts | Bins with >2000 counts | High rate bins dominated by noise | Noise dominated (total time) | Noise dominated (detector-on time) | Marked lightcurve |
|---|---|---|---|---|---|---|---|
| A | 6956 | 5611 | 0 | 0 | 0.00% | 0.00% | 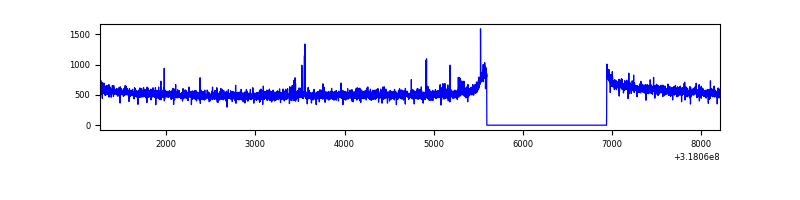 |
| B | 6955 | 5610 | 3 | 3 | 0.04% | 0.05% | 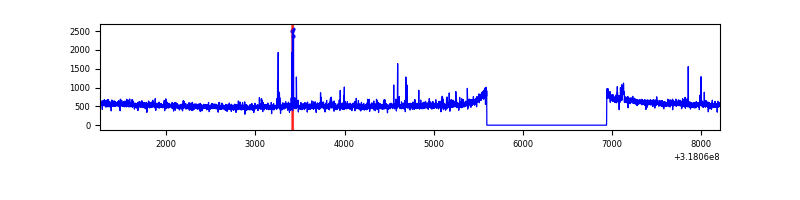 |
| C | 6956 | 5611 | 0 | 0 | 0.00% | 0.00% | 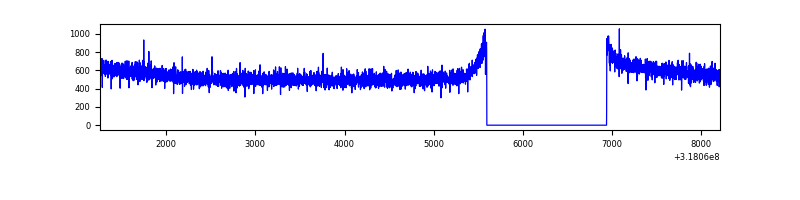 |
| D | 6956 | 5611 | 1686 | 1686 | 24.24% | 30.05% | 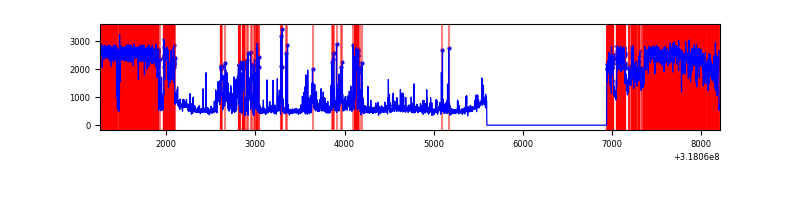 |
Top three noisy pixels from each quadrant. If the there are fewer than three noisy pixels in the level2.evt file, extra rows are filled as -1
| Pixel properties | Quadrant properties | ||||||
|---|---|---|---|---|---|---|---|
| Quadrant | DetID | PixID | Counts | Sigma | Mean | Median | Sigma |
| A | 6 | 16 | 22015 | 140.94 | 766 | 751 | 150.9 |
| A | 13 | 254 | 9412 | 57.41 | 766 | 751 | 150.9 |
| A | 3 | 1 | 9184 | 55.9 | 766 | 751 | 150.9 |
| B | 0 | 228 | 44761 | 314.07 | 759 | 740 | 140.2 |
| B | 12 | 111 | 15325 | 104.06 | 759 | 740 | 140.2 |
| B | 0 | 229 | 14049 | 94.95 | 759 | 740 | 140.2 |
| C | 14 | 238 | 119596 | 689.78 | 749 | 754 | 172.3 |
| C | 3 | 233 | 5743 | 28.96 | 749 | 754 | 172.3 |
| C | 13 | 61 | 5198 | 25.79 | 749 | 754 | 172.3 |
| D | 7 | 238 | 3534802 | 22351.63 | 658 | 640 | 158.1 |
| D | 1 | 52 | 1187983 | 7509.29 | 658 | 640 | 158.1 |
| D | 12 | 233 | 78630 | 493.24 | 658 | 640 | 158.1 |
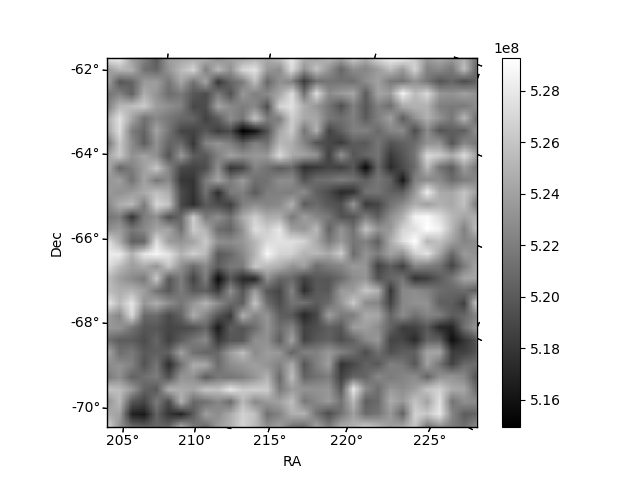
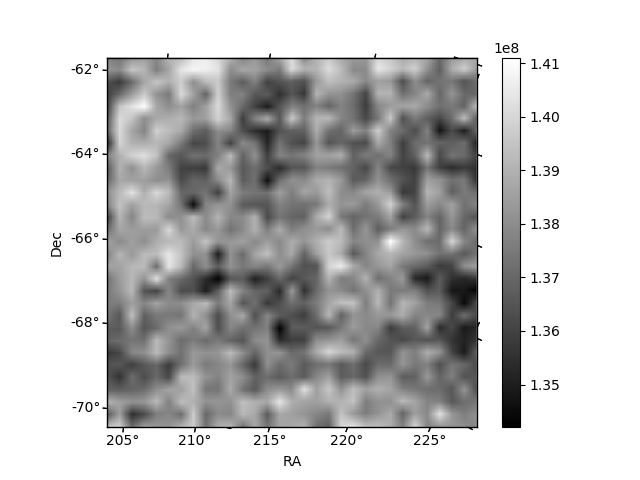
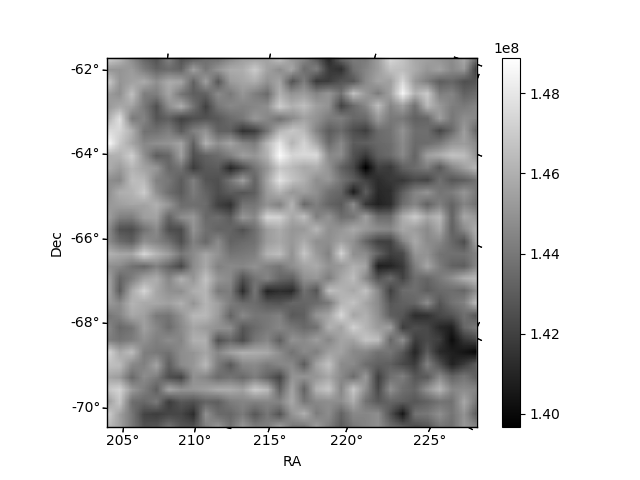
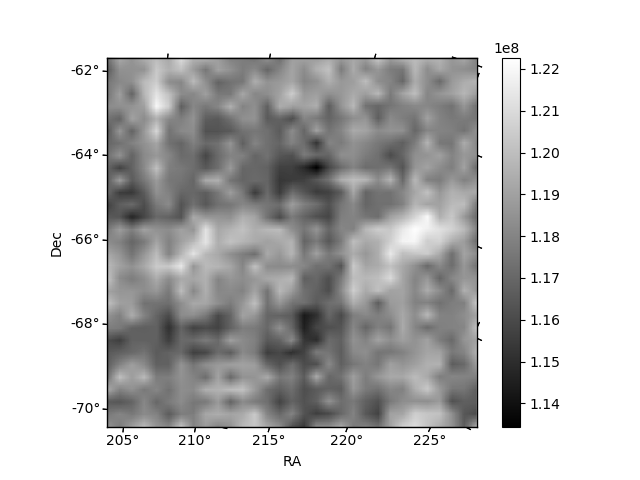
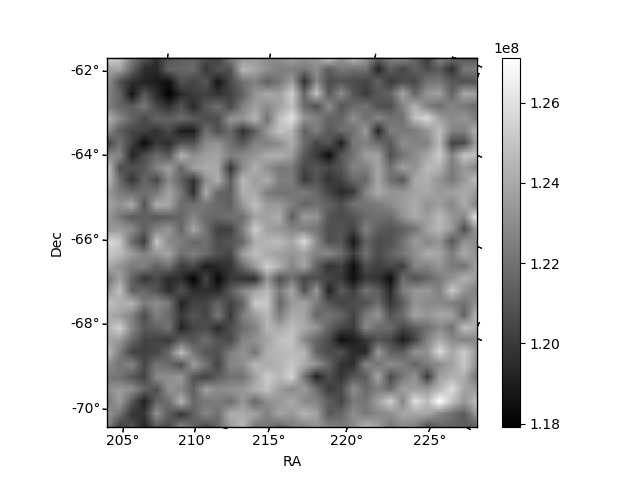
Histogram calculated using DETX and DETY for each event in the final _common_clean file
| Quadrant A | 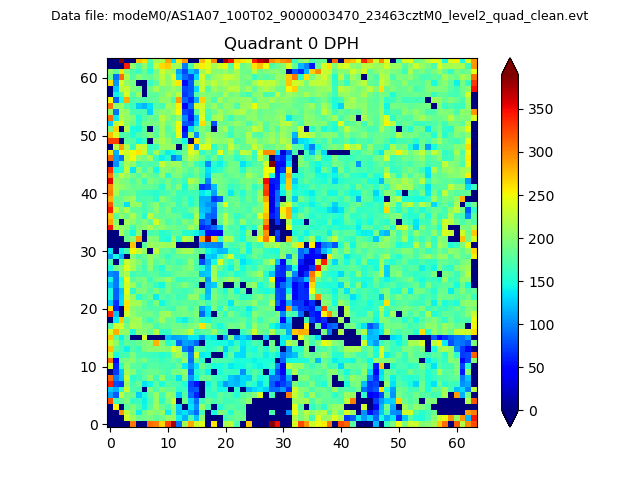 |
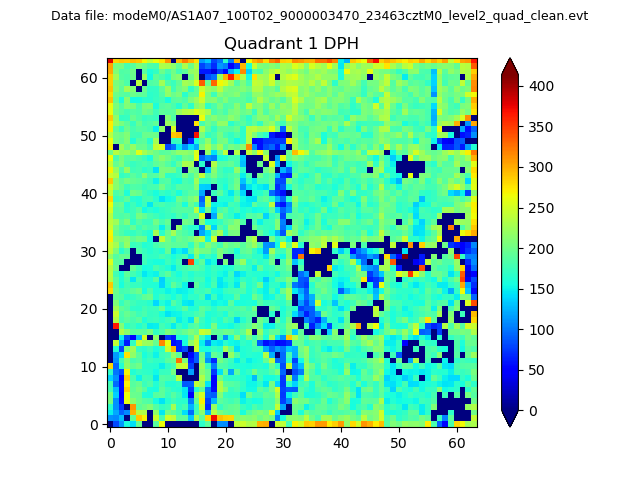 |
Quadrant B |
|---|---|---|---|
| Quadrant D | 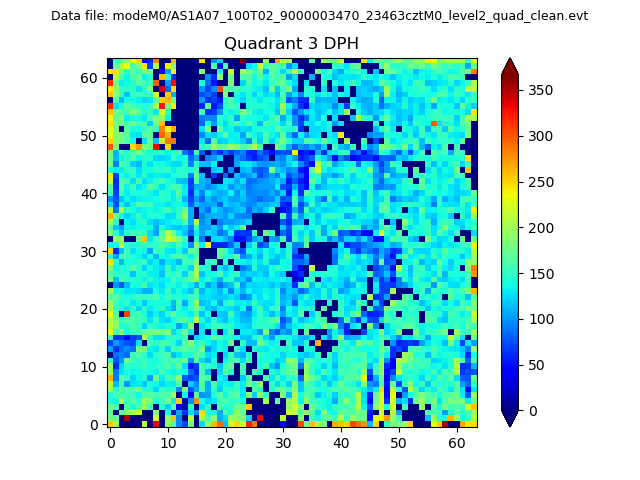 |
 |
Quadrant C |
| Plot type | Count rate plots | Images |
|---|---|---|
| Comparison with Poisson distribution Blue bars denote a histogram of data divided into 1 sec bins. Red curve is a Poisson curve with rate = median count rate of data. |
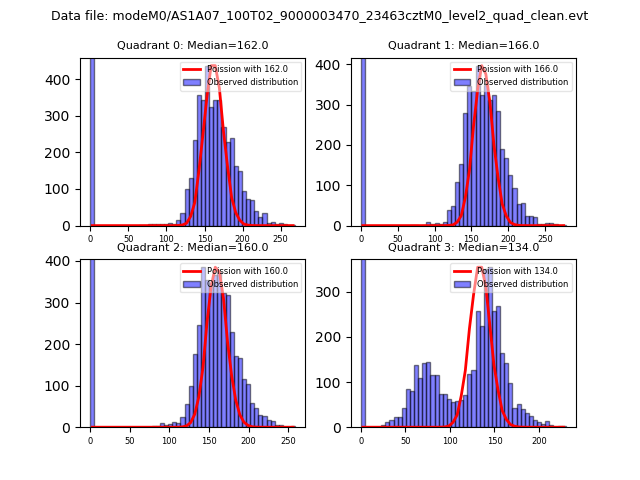 |
 |
| Quadrant-wise count rates Data is divided into 100 sec bins |
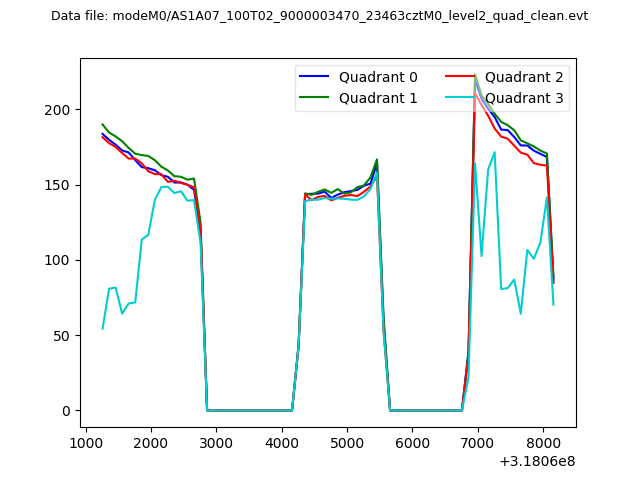 |
|
| Module-wise count rates for Quadrant A Data is divided into 100 sec bins |
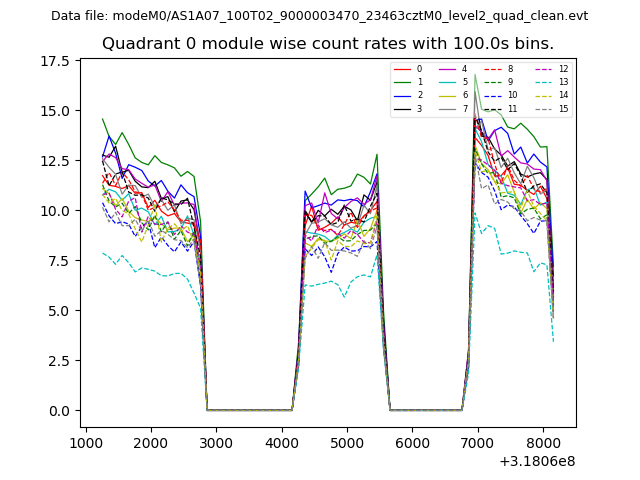 |
 |
| Module-wise count rates for Quadrant B Data is divided into 100 sec bins |
 |
 |
| Module-wise count rates for Quadrant C Data is divided into 100 sec bins |
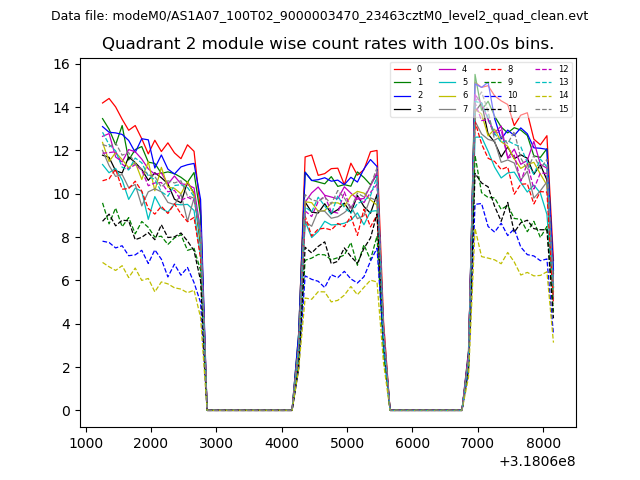 |
 |
| Module-wise count rates for Quadrant D Data is divided into 100 sec bins |
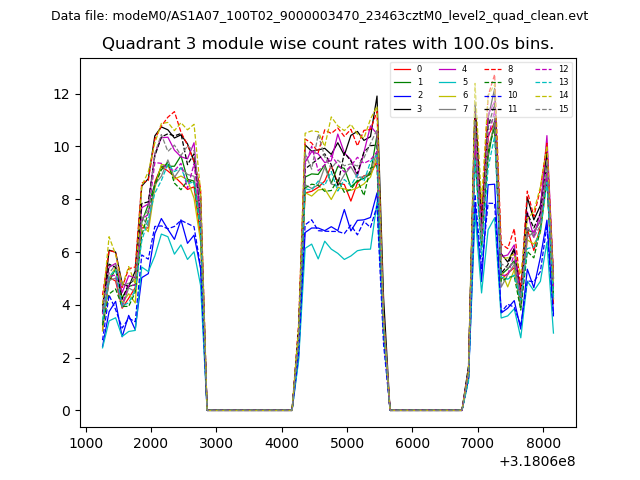 |
 |
| Parameter | Plot |
|---|---|
| CZT HV Monitor | 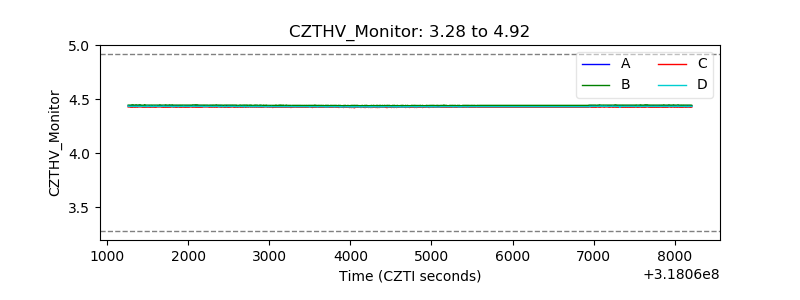 |
| D_VDD | 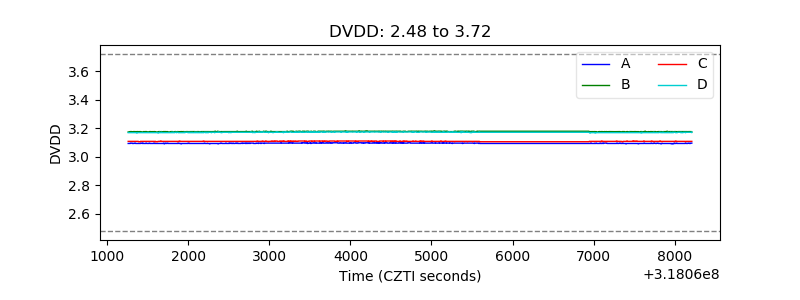 |
| Temperature 1 | 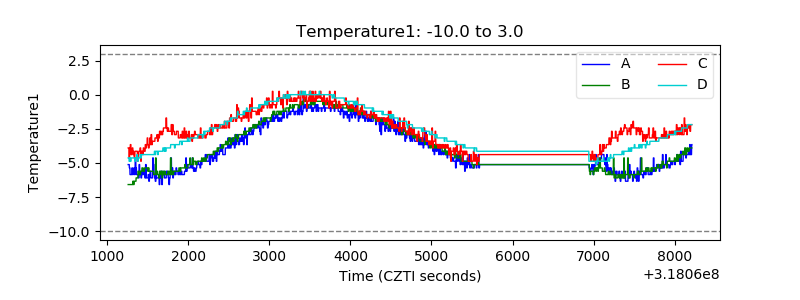 |
| Veto HV Monitor | 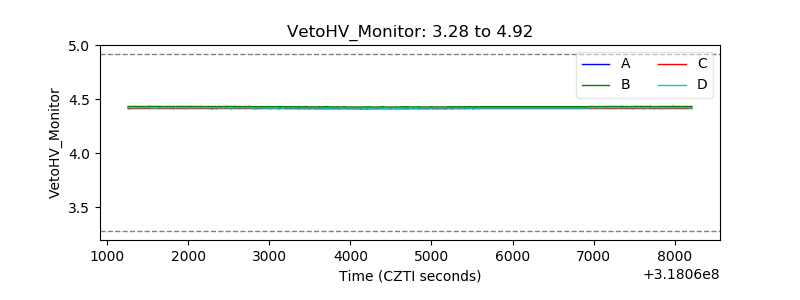 |
| Veto LLD | 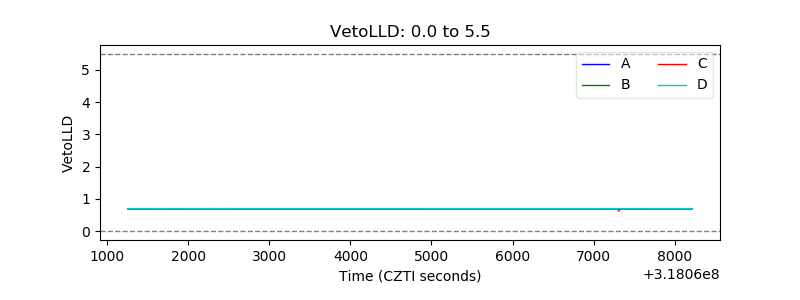 |
| Alpha Counter | 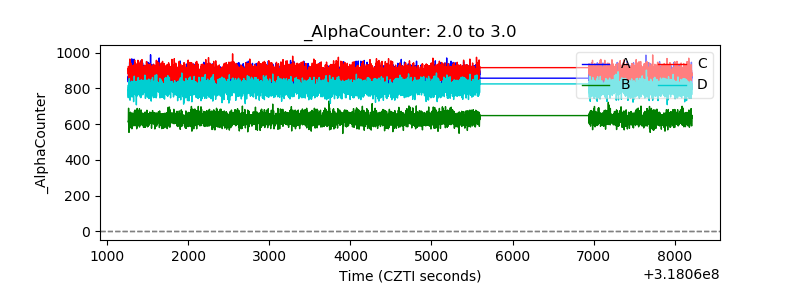 |
| _CPM_Rate | 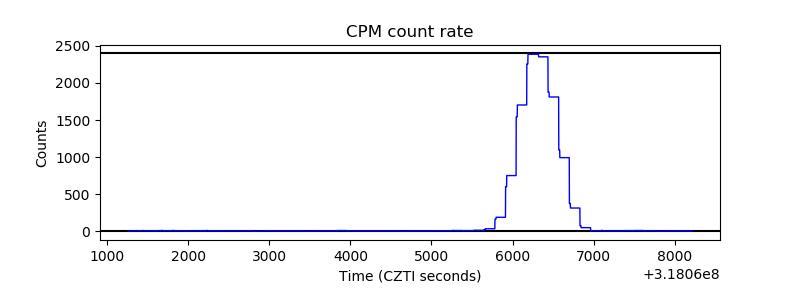 |
| CZT Counter | 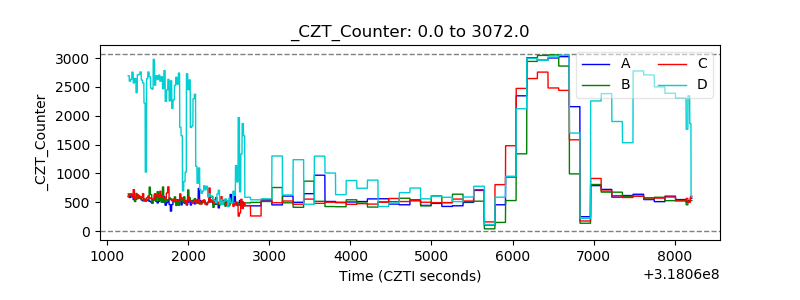 |
| +2.5 Volts monitor |  |
| +5 Volts monitor |  |
| _ROLL_ROT | 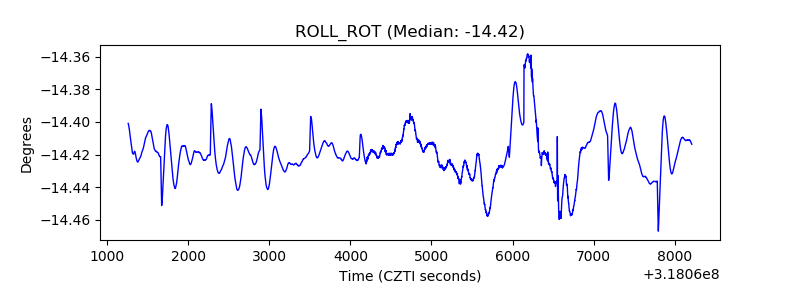 |
| _Roll_DEC | 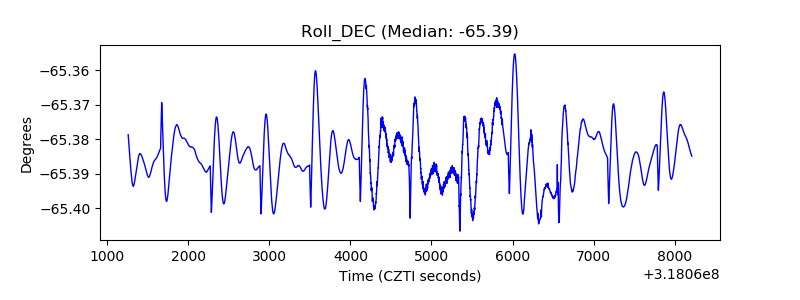 |
| _Roll_RA | 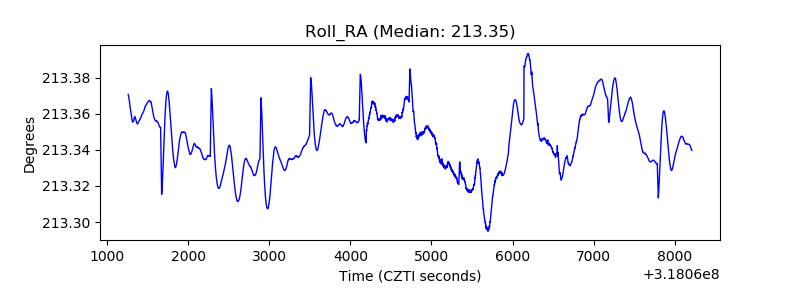 |
| Veto Counter |  |